
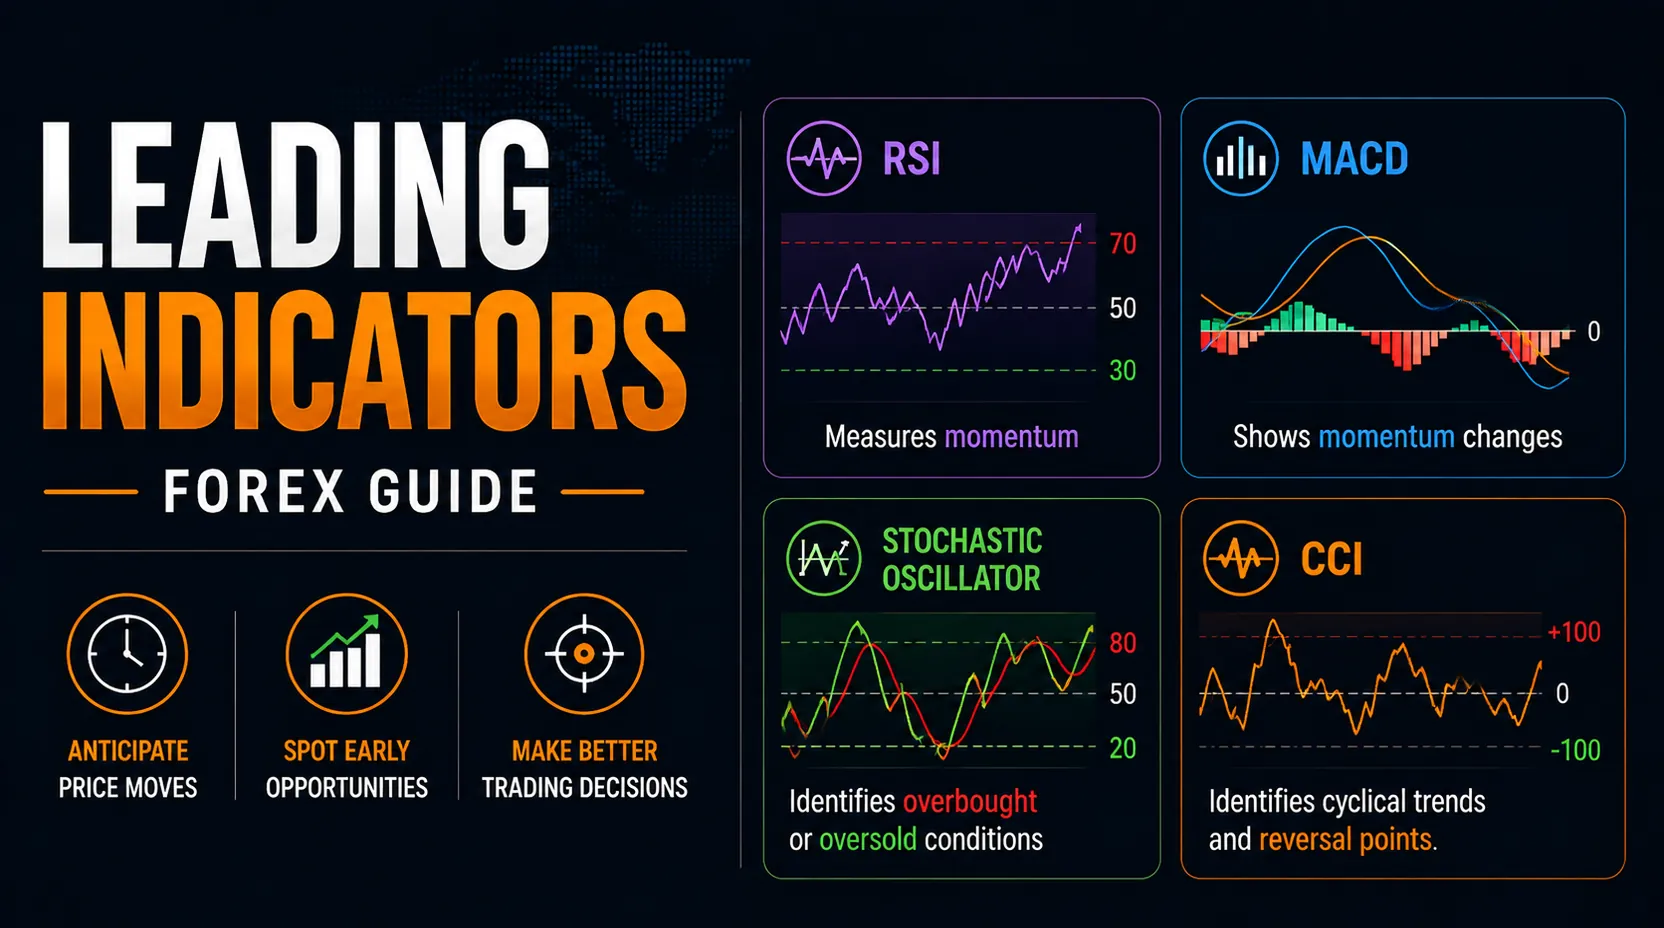
What Is a Forex Leading Indicator Used For?
A forex leading indicator is a technical measure used to flag developing conditions before a later price-based confirmation. Oscillators such as RSI or Stochastic can show stretched movement or shifting momentum; chart structure separately shows whether price is testing a range edge or reacting near a level.
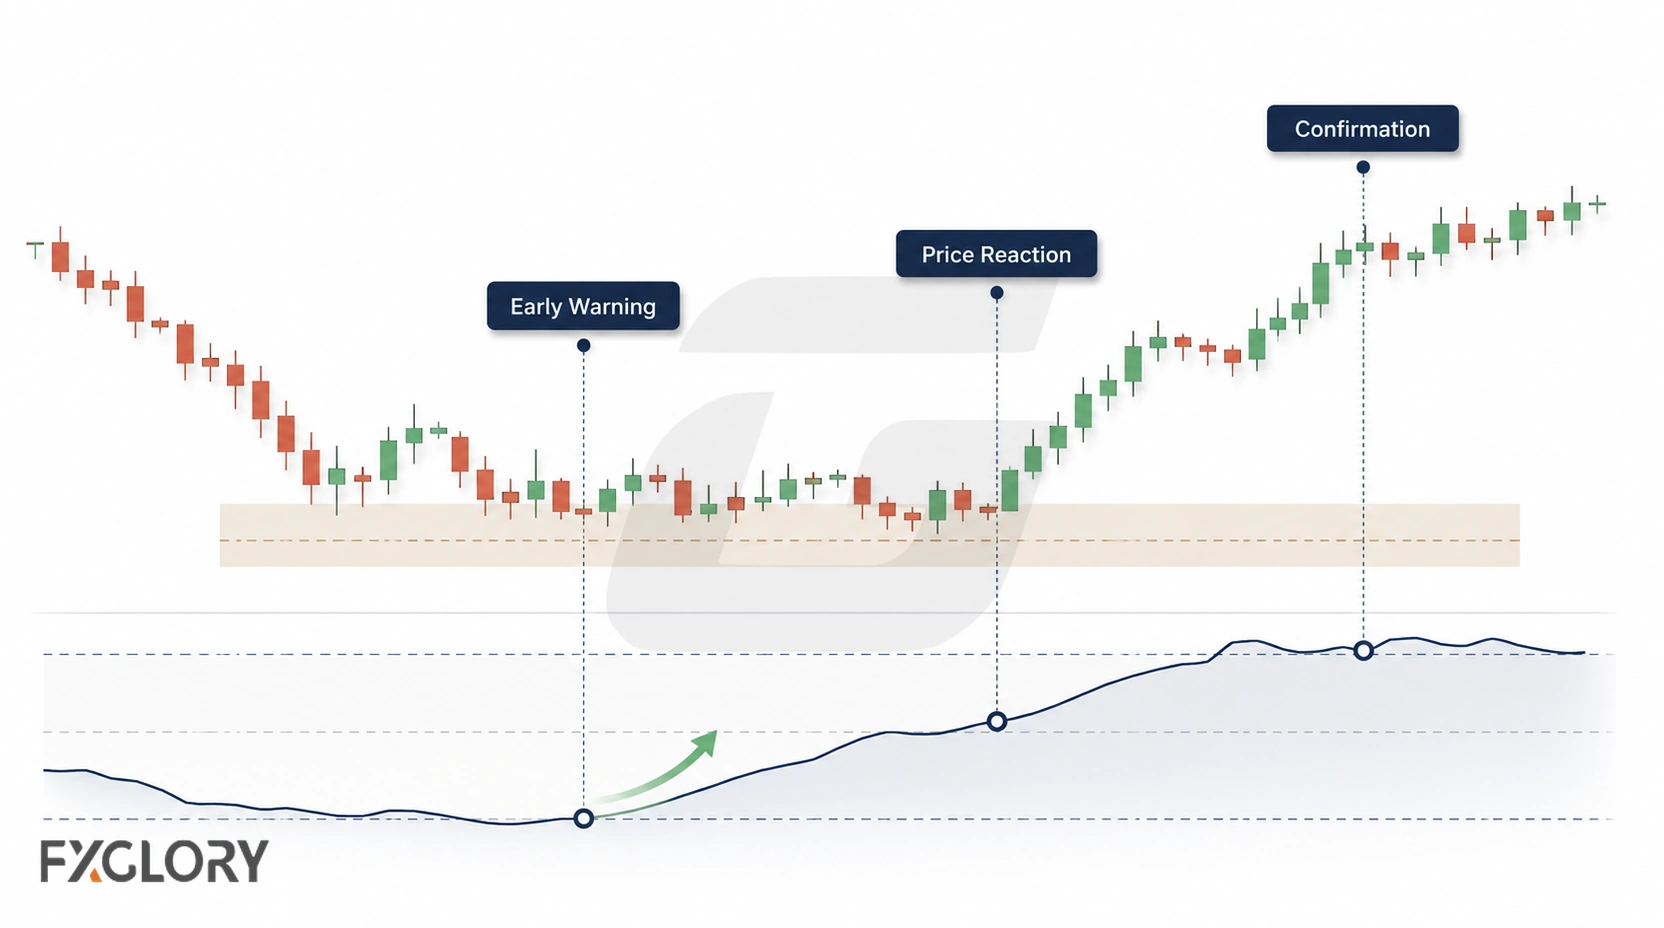
Earlier readings are not necessarily more reliable: an oscillator can remain stretched while price continues trending, or shift without a meaningful price reaction.
Leading tools are easier to read when the early-warning question is clear. One tool may help with momentum pressure, another may help with range position, and another may help with price-location context.
For broader indicator context, review the forex technical indicators guide.
Leading vs Lagging Indicators in Forex
Leading oscillators may flag conditions before a confirmed price turn. Lagging indicators, including many moving-average signals, summarize price behavior that has already developed. Both use historical data; “leading” describes the warning’s timing, not an ability to foresee the next move.
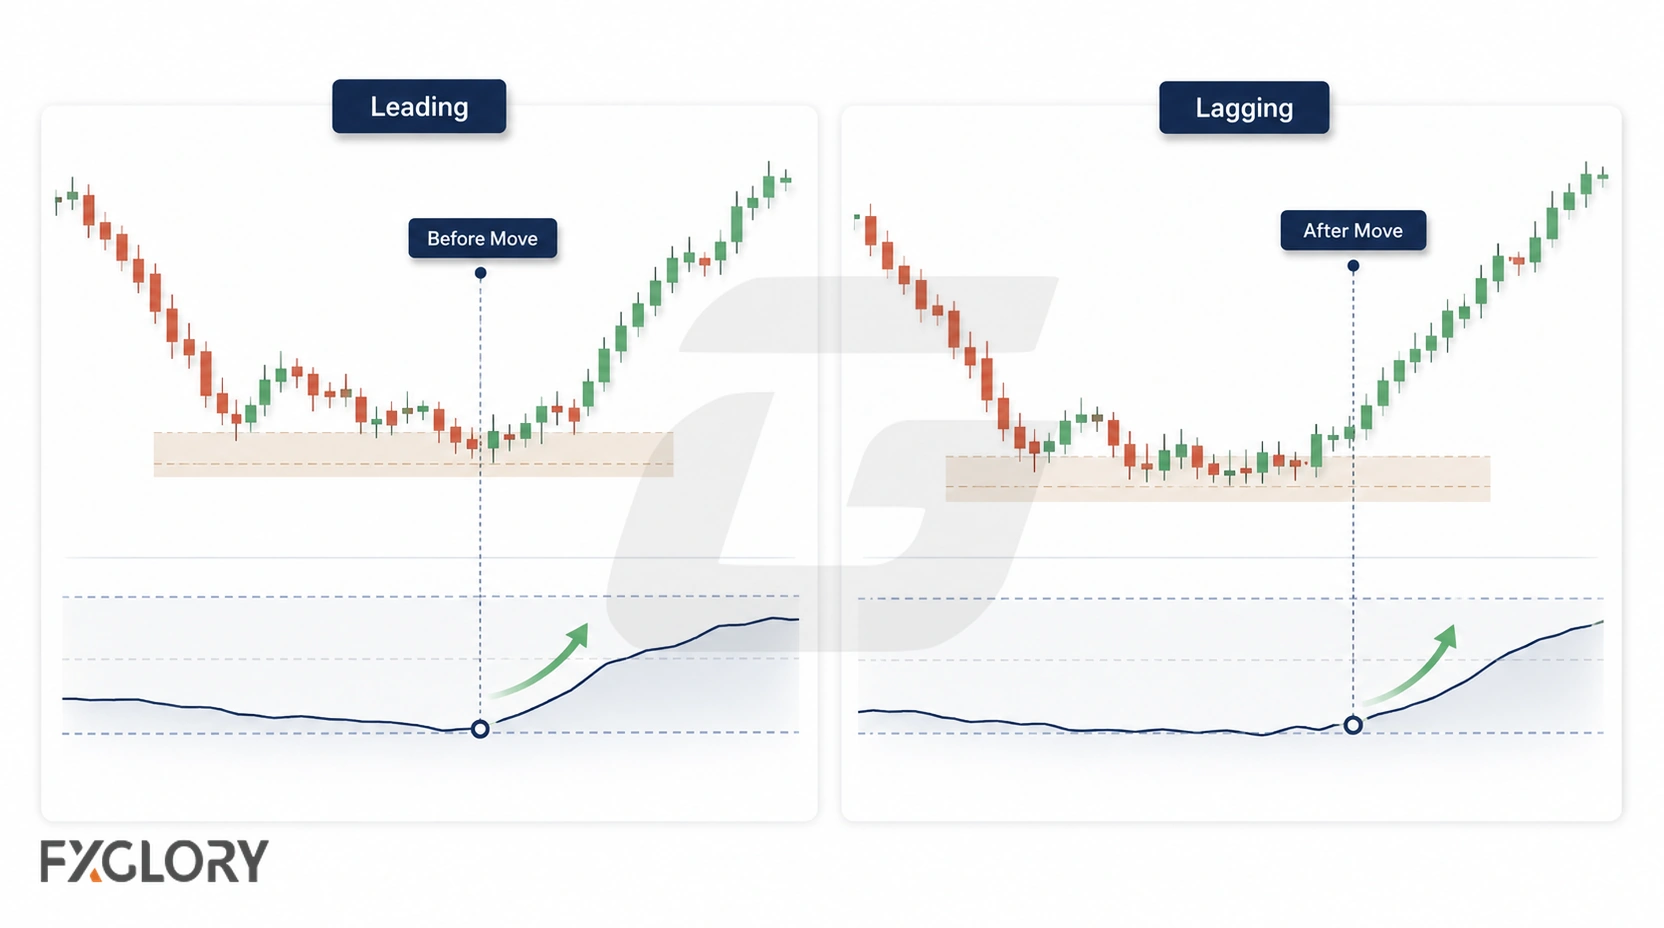
| Indicator type | What it can help review | Main weakness |
|---|---|---|
| Leading tool | Oscillator warnings about momentum or range position | Can produce early false signals |
| Lagging tool | Confirmation after price has already shown direction, structure, momentum, or strength | Can react late after part of the move has already happened |
| Leading plus confirmation | Early warning checked against structure, level reaction, trend context, or follow-through | Still does not remove risk |
Choose Early-Warning Methods by Question
Not every early-warning method answers the same question. Oscillators measure momentum, price deviation, range position, or price-volume pressure; Fibonacci and support/resistance mark potential reaction areas, while divergence compares price swings with an indicator’s swings. Those methods complement one another but are not all leading indicators.
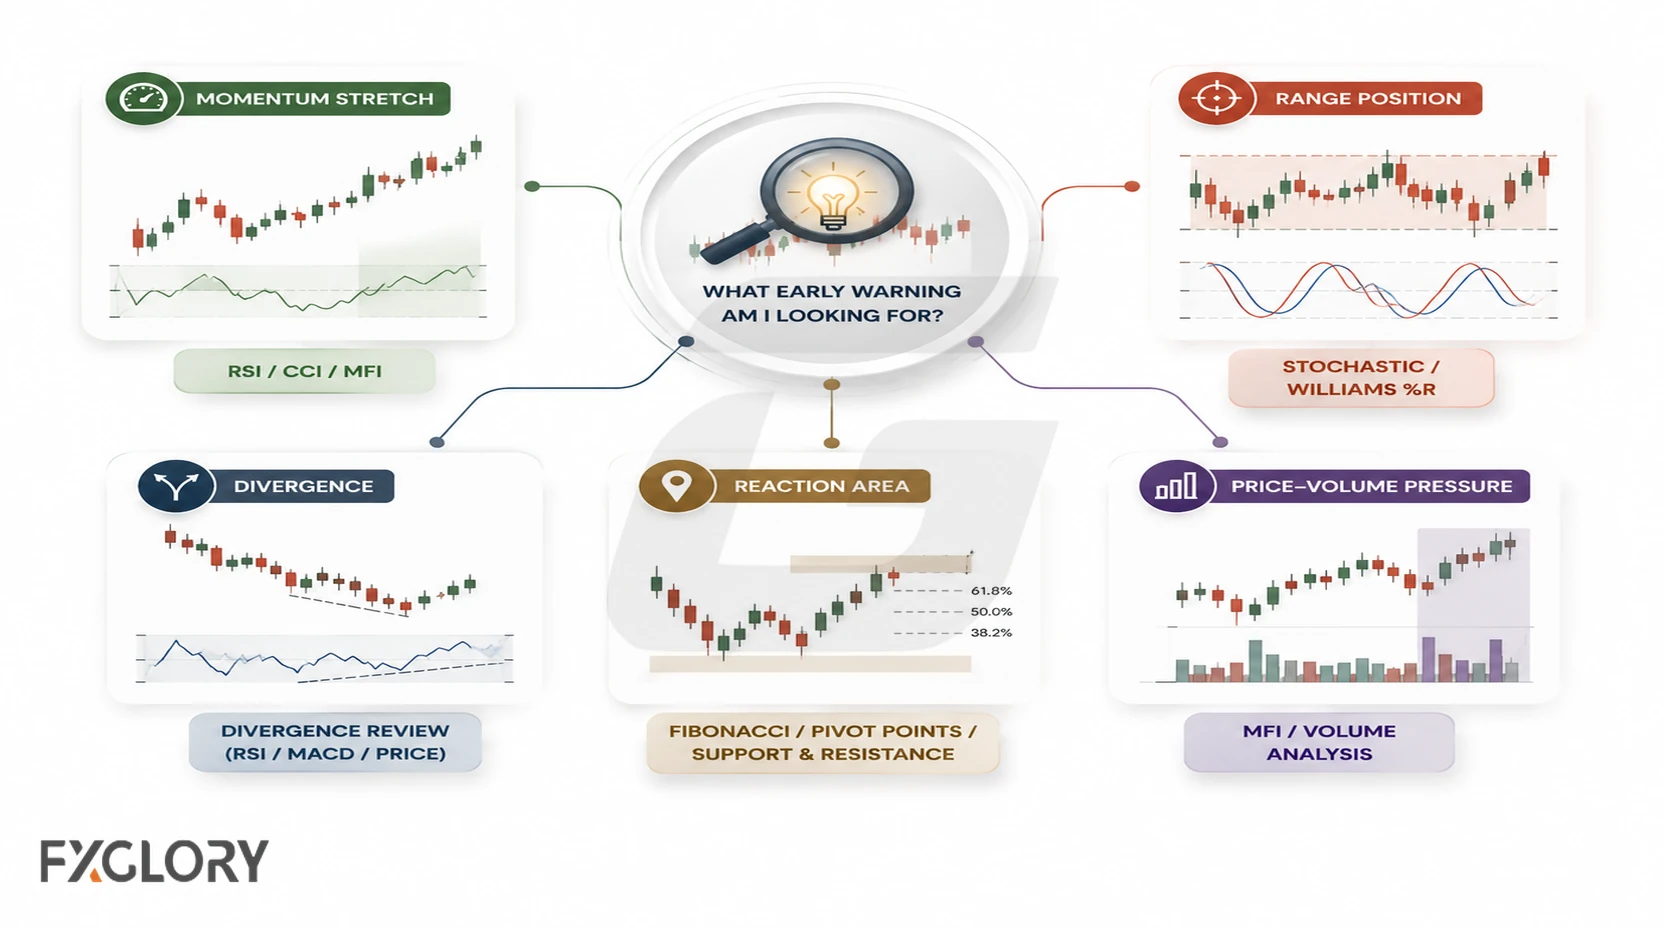
| Early-warning question | Possible tool type | What to avoid |
|---|---|---|
| Is momentum stretched or shifting? | RSI momentum-pressure review, CCI, MFI | Treating overbought or oversold as automatic reversal |
| Where is price inside a recent range? | Stochastic range-position review, Williams %R | Trusting repeated early warnings during strong trends |
| Is price stretched from typical behavior? | CCI stretch-and-cycle review, deviation-style context | Using stretched movement without price structure |
| Are price and momentum disagreeing? | Price–indicator divergence analysis | Calling reversal before price reacts |
| Is price near a possible reaction area? | Fibonacci retracement zones, calculated pivot levels, charted support and resistance | Treating a level as confirmation by itself |
| Is price-volume pressure changing? | MFI price-volume pressure review, cautious volume-style checks | Ignoring forex tick-volume and platform-feed limits |
Common Forex Leading Indicators and Early-Warning Tools
RSI, Stochastic, CCI, and MFI are formula-based oscillators commonly used for early warnings. Divergence is a relationship between price and an indicator; Fibonacci retracement is a chart-drawing method, pivot points are calculated price levels, and support/resistance describes areas on the chart. The latter methods provide context for an oscillator warning rather than becoming oscillators themselves.
| Tool | Early-warning role | Where it can fail | Safer use |
|---|---|---|---|
| RSI | Momentum pressure, overbought, oversold, and divergence context | Can stay stretched during strong trends | Review RSI-specific rules |
| Stochastic | Range position and possible reaction pressure | Can over-signal during fast directional movement | Review Stochastic-specific rules |
| CCI | Stretched movement and cycle-pressure review | Can become noisy when structure is unclear | Review CCI-specific rules |
| MFI | Price-volume pressure and overbought or oversold context | Forex volume input may be tick volume or platform-specific activity | Review MFI-specific rules |
| Divergence | Disagreement between price and momentum | Does not confirm reversal without price reaction | Review divergence confirmation checks |
| Fibonacci retracement | Possible pullback or reaction area | Level can fail without reaction or structure | Review Fibonacci retracement context |
| Forex pivot points | Calculated session reference levels and possible reaction zones | Levels are not automatic reversal points | Compare with support, resistance, and structure |
| Support and resistance | Price-location context for early warnings | A level alone does not confirm direction | Review support and resistance zones |
When Leading Indicators Work Better or Worse
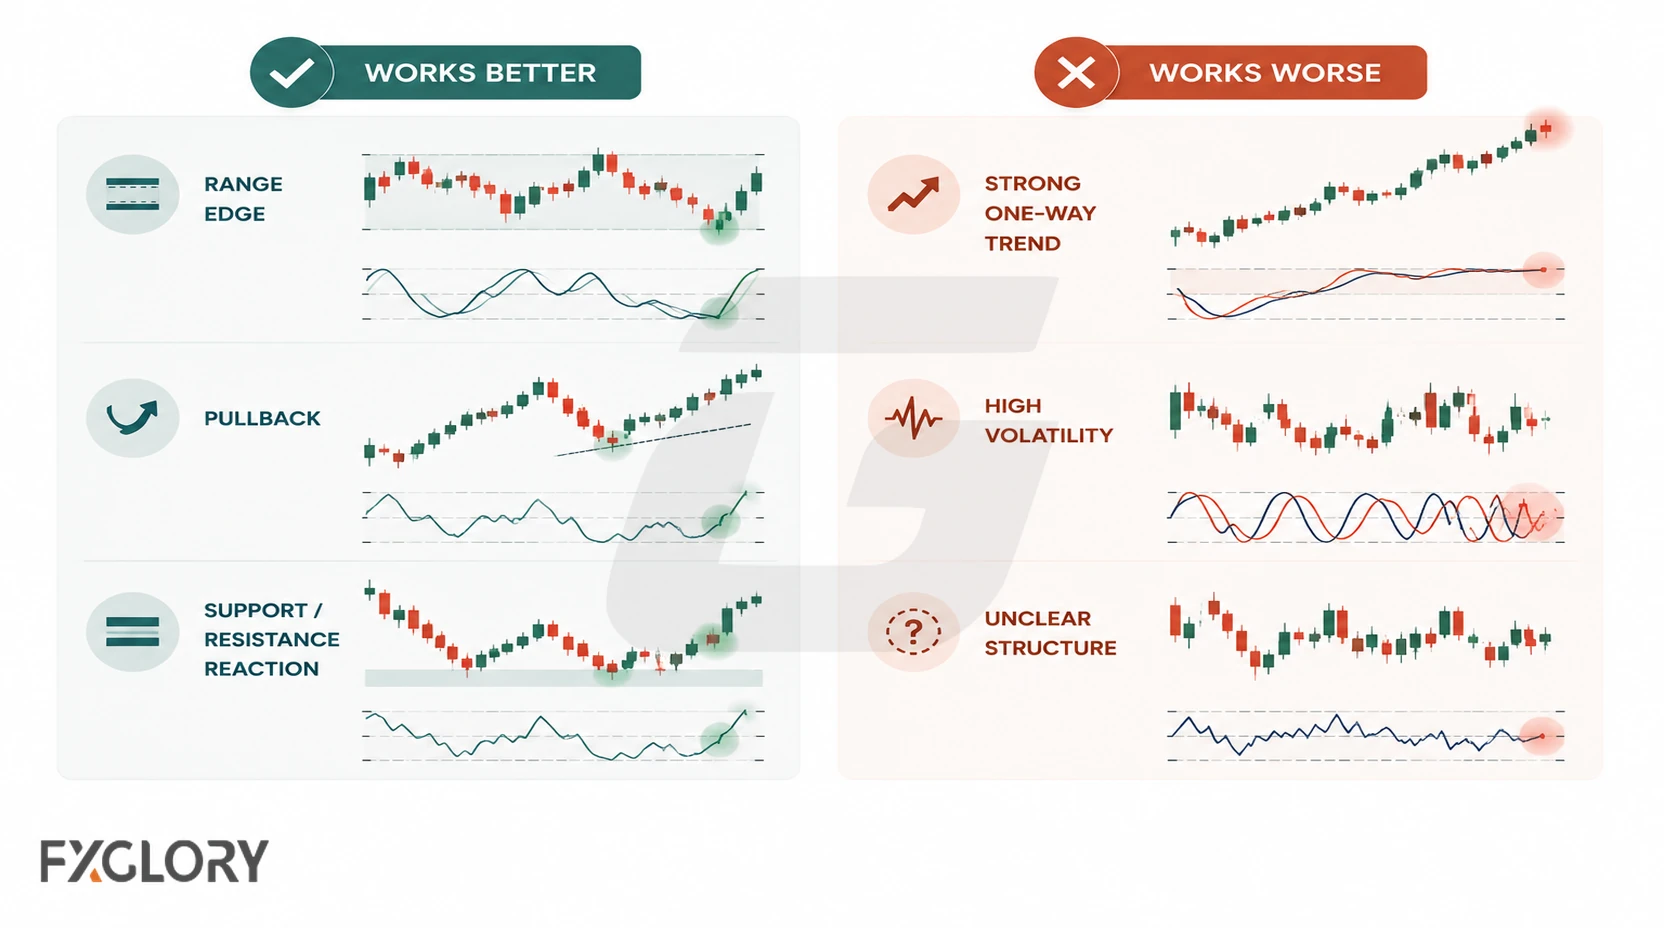
The useful leading indicator changes when the market condition changes. A tool that helps around a range edge can fail badly inside a strong one-way trend.
| Market condition | Early-warning question | Main caution |
|---|---|---|
| Ranging market | Is price reacting near a range boundary? | Repeated signals can still fail without level reaction |
| Pullback in a trend | Is the pullback stretched or controlled? | Counter-trend warnings can appear too early |
| Support or resistance reaction | Does the warning appear near a meaningful price area? | A level is not confirmation by itself |
| Strong one-way trend | Is the warning fighting a trend with no structure change? | Oscillators can stay stretched for a long time |
| High-volatility market | Is movement too fast to define invalidation? | Early warnings can fail quickly |
| Unclear structure | Is there enough price context for the signal to matter? | Warnings away from identifiable levels or structure are harder to interpret |
Confirmation, Context, and Risk Checks
A price reaction, structure change, or follow-through can help confirm an early warning. Price location, trend, and volatility provide context; invalidation and position sizing manage risk rather than confirm the signal. Keeping these jobs separate prevents a promising chart location from being mistaken for proof of a trade.
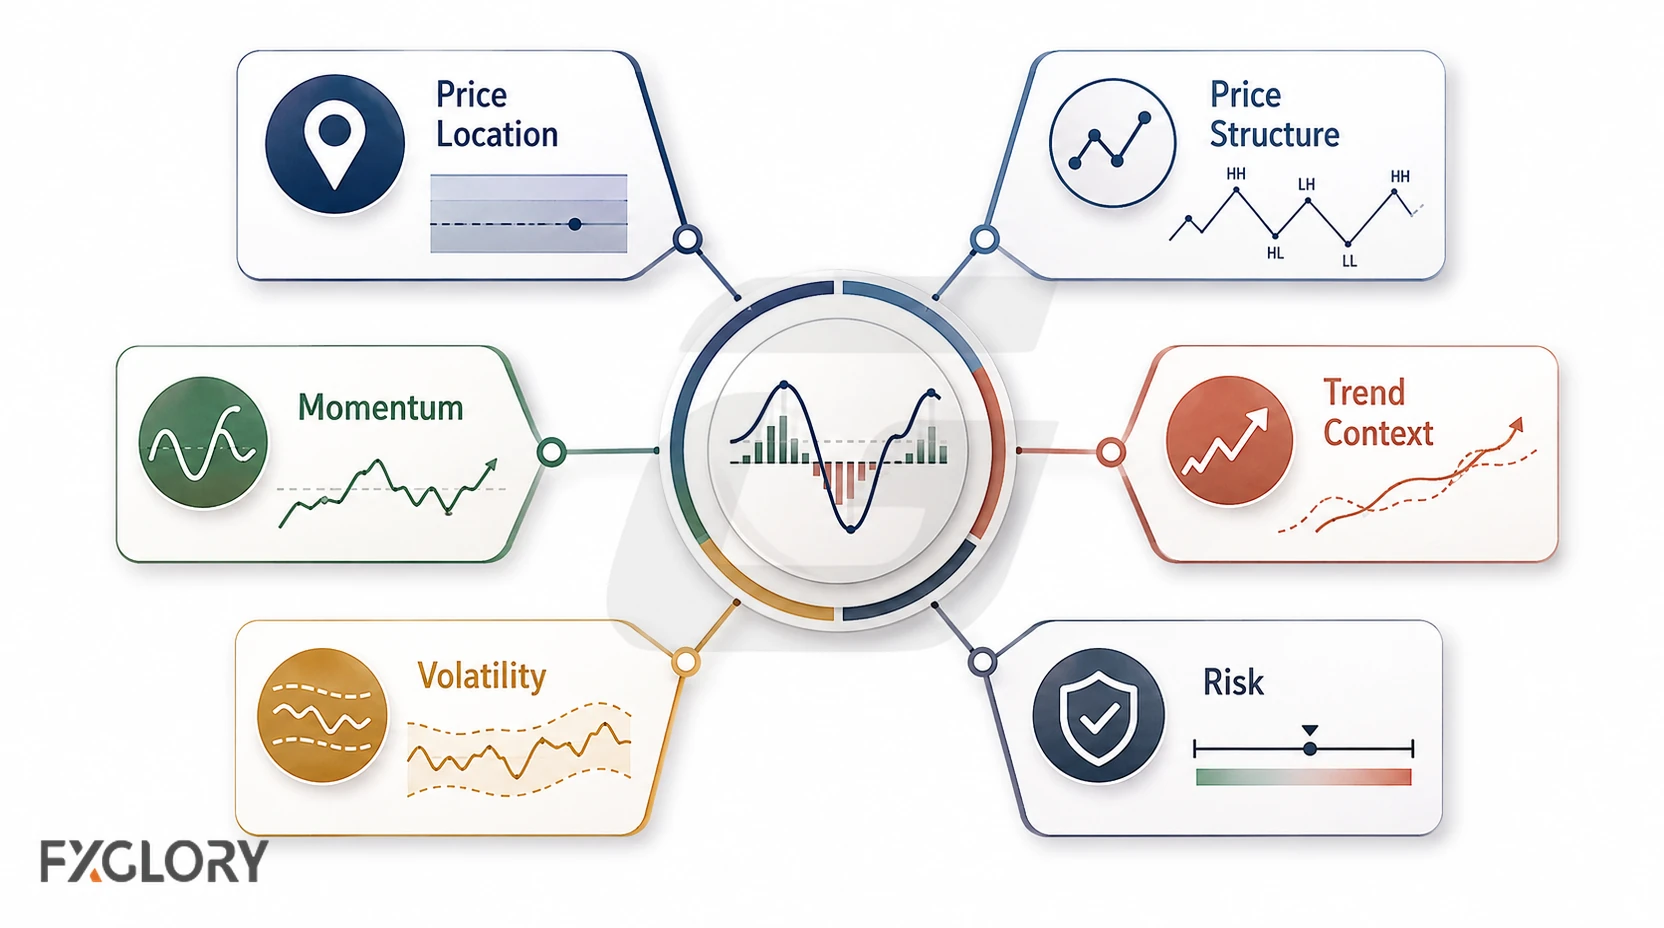
- Price location: Is the signal near support, resistance, a range edge, a pivot area, or a retracement zone?
- Price structure: Has price shown a break, retest, failed continuation, higher low, lower high, or another structure change?
- Momentum behavior: Is RSI, Stochastic, CCI, MFI, or divergence showing a real change, or only repeating noise?
- Trend context: Is the signal with the broader trend, against it, or inside a choppy condition?
- Volatility context: Is movement calm enough to define invalidation, or too fast to manage clearly?
- Risk planning (not confirmation): Where would the setup be invalidated, and can a position size fit the risk limit after accounting for stop distance and pip value?
For confirmation beyond the indicator, review price action in forex, market structure context, and trend-filter context.
Volume and Custom Indicator Caution
Some traders use volume-style tools, arrows, color changes, or custom scripts as early warnings. These tools need extra caution in forex because the data source and signal logic matter.
Spot forex does not have one centralized exchange volume feed in the same way some exchange-traded markets do. Platform volume can be based on broker or tick data, so volume-style warnings should be checked carefully.
- Volume-source check: Does the trader know what the platform volume actually measures?
- Signal-stability check: Does the warning stay fixed after the candle closes?
- Logic check: Can the trader explain what creates the signal?
- Overfitting check: Does the signal only look good after settings are adjusted to old examples?
- Confirmation check: Does price structure support the early warning?
Before relying on volume-style or custom warnings, review forex volume indicator context and non-repainting signal checks.
Market Context Examples: Matching Leading Indicators to Instruments
Use the market page for instrument context, then compare leading-indicator behavior inside the charting setup where the relevant indicator is available.
| Market page | Early-warning question | Context to check |
|---|---|---|
| EUR/CHF market page | What would a range-position warning add if price is reacting near a quiet boundary? | Support/resistance, range structure, spread, and invalidation |
| EUR/GBP market page | What would an oscillator warning add if price is moving near a range edge? | Level reaction, candle behavior, and false-signal history |
| GBP/USD market page | What would divergence add after a directional move begins to weaken? | Market structure, trend context, and follow-through |
| Gold market page | What would a stretched oscillator warning mean during a strong and volatile move? | Volatility, news risk, level distance, and counter-trend risk |
| BTC/USD market page | What would an early warning mean during fast movement and unstable conditions? | Spread, volatility, execution conditions, and structure clarity |
False-Signal Filters for Forex Leading Indicators
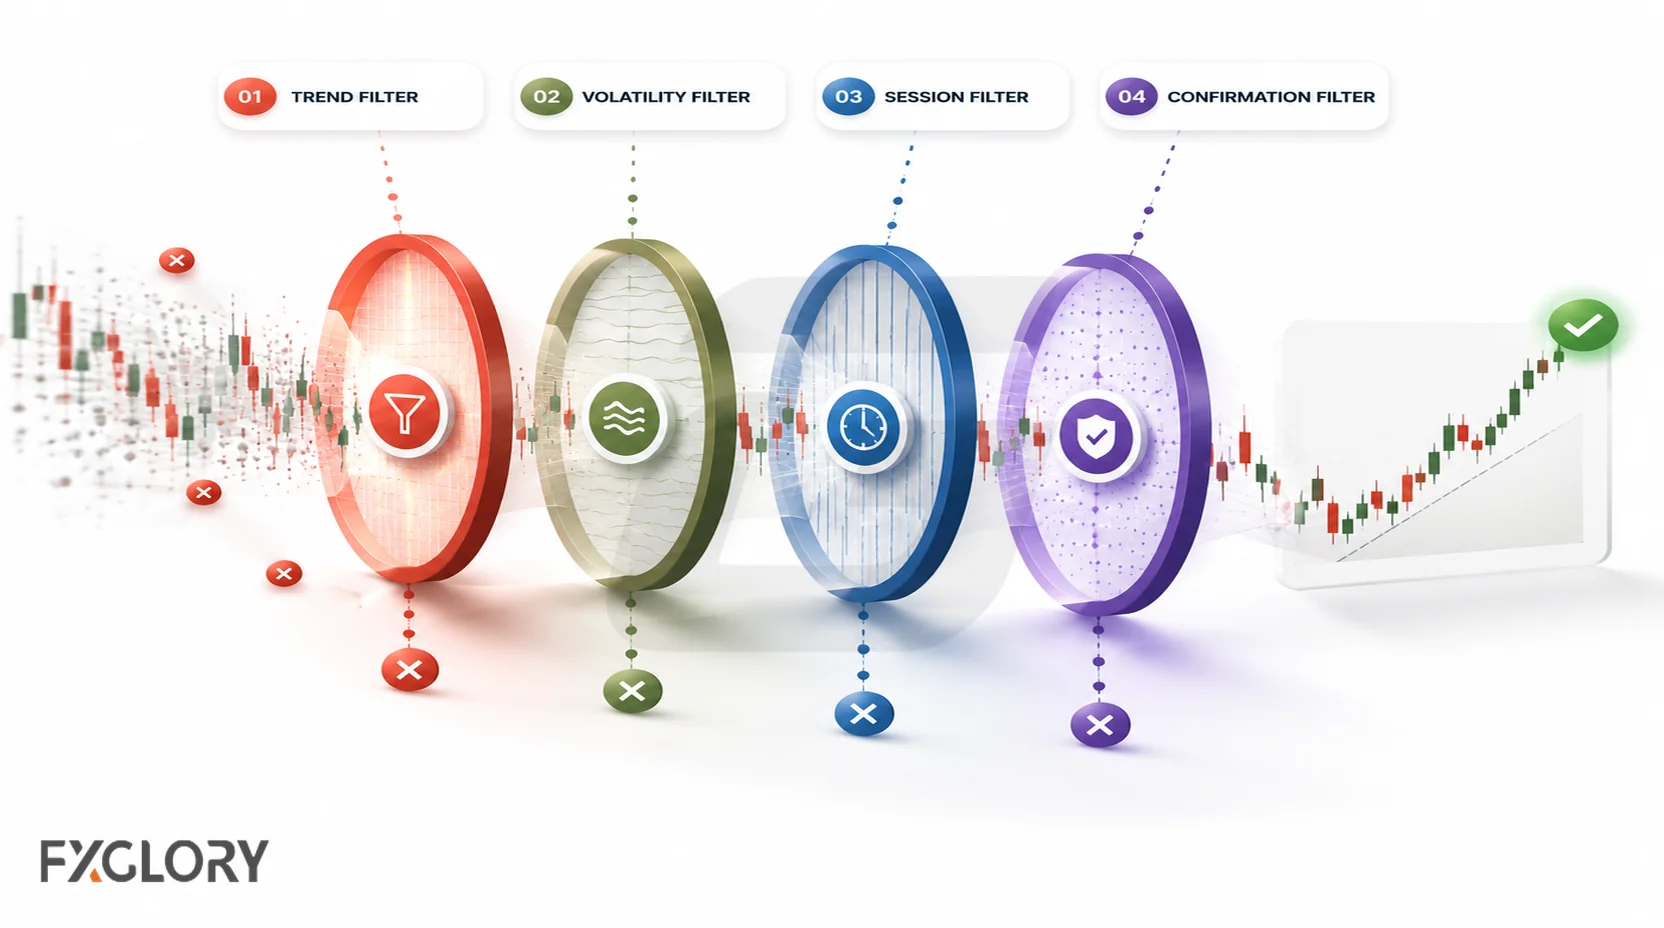
Use these filters when a leading indicator looks active but the chart condition does not support the warning.
| Filter | Problem it catches | What to check |
|---|---|---|
| Strong-trend filter | Oscillator stays stretched while price keeps moving in the same direction | Trend context and structure change |
| No-level filter | Signal appears away from support, resistance, range edge, or retracement area | Price location |
| Volatility filter | Fast movement makes the signal appear too early or invalidation unclear | Volatility and risk distance |
| News-event filter | High-impact news, abnormal spreads, or fast liquidity changes dominate the chart | News context and spread behavior |
| Divergence-without-structure filter | Divergence appears but price does not react or change structure | Reaction and follow-through |
| Repeated-signal filter | Oscillator keeps printing similar warnings without price confirmation | Signal quality and market condition |
| Counter-trend filter | Early warning fights a strong trend without a clear reaction zone | Trend strength and location |
| No-invalidation filter | No clear place where the idea is wrong | Structure level and risk distance |
How to Test Forex Leading Indicators
A leading indicator should be tested inside one market condition at a time. Testing it across random charts without separating ranges, trends, pullbacks, volatility, and news conditions can create misleading results.
- Choose the early-warning job: Overbought/oversold pressure, range reaction, pullback area, divergence, volume-style pressure, or reaction-zone check.
- Choose the market condition: Range, pullback, strong trend, high volatility, quiet market, or unclear structure.
- Specify price-based confirmation: Define an observable reaction, structure change, or follow-through; record price levels, trend, and volatility separately as context.
- Define the trigger: Write the exact price-based event that would confirm the early warning and the time window in which it must occur.
- Define invalidation: Write the price behavior that would make the idea wrong.
- Record signal timing: Note whether the warning came early, too early, late, or repeatedly.
- Check spread and slippage context: Record whether trading costs or execution conditions could affect the setup.
- Check news-event risk: Mark whether high-impact news or abnormal volatility was nearby.
- Record sample size: Count all eligible warnings, including rejected candidates, before comparing results across market conditions.
- Separate setup stages: Record generated warnings, warnings meeting the predefined confirmation rule, and setups accepted after risk and execution filters; document rejections at each stage.
- Record the failure type: False signal, early signal, strong-trend failure, no-level signal, no confirmation, unclear structure, poor risk distance, or curve fitting.
Compare confirmation rates against all eligible warnings and final acceptance rates against the stated candidate pool; specify each denominator. A false-alert rate is meaningful only when the confirmation window and failure rule were defined in advance. Neither a confirmed setup nor an accepted trade is necessarily a profitable one.
For broader tool comparison, use the best indicators for forex guide.