
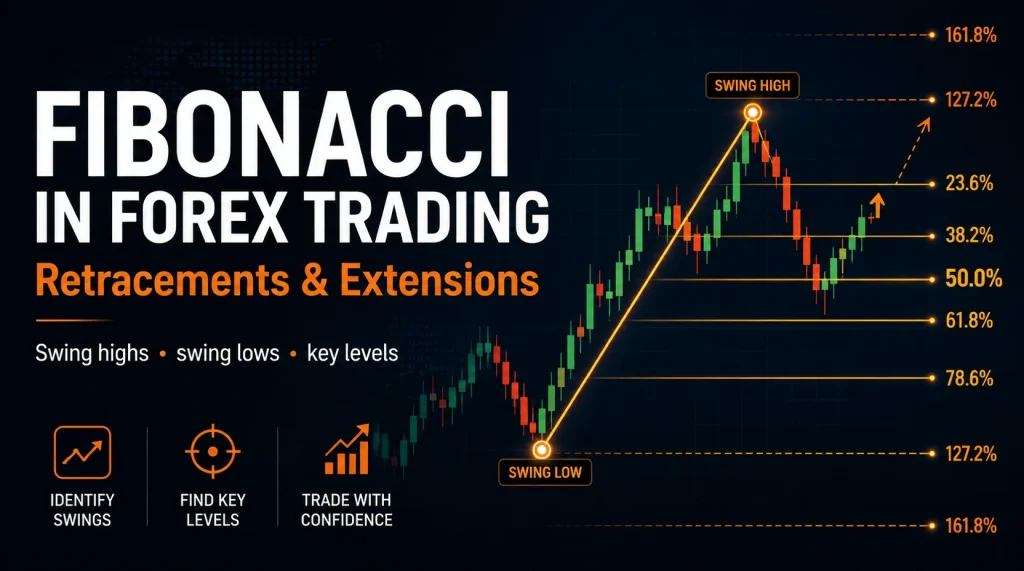
What Is Fibonacci in Forex Trading?
Fibonacci in forex trading is a technical-analysis drawing method that maps ratio-based retracement and extension levels from a selected price swing.
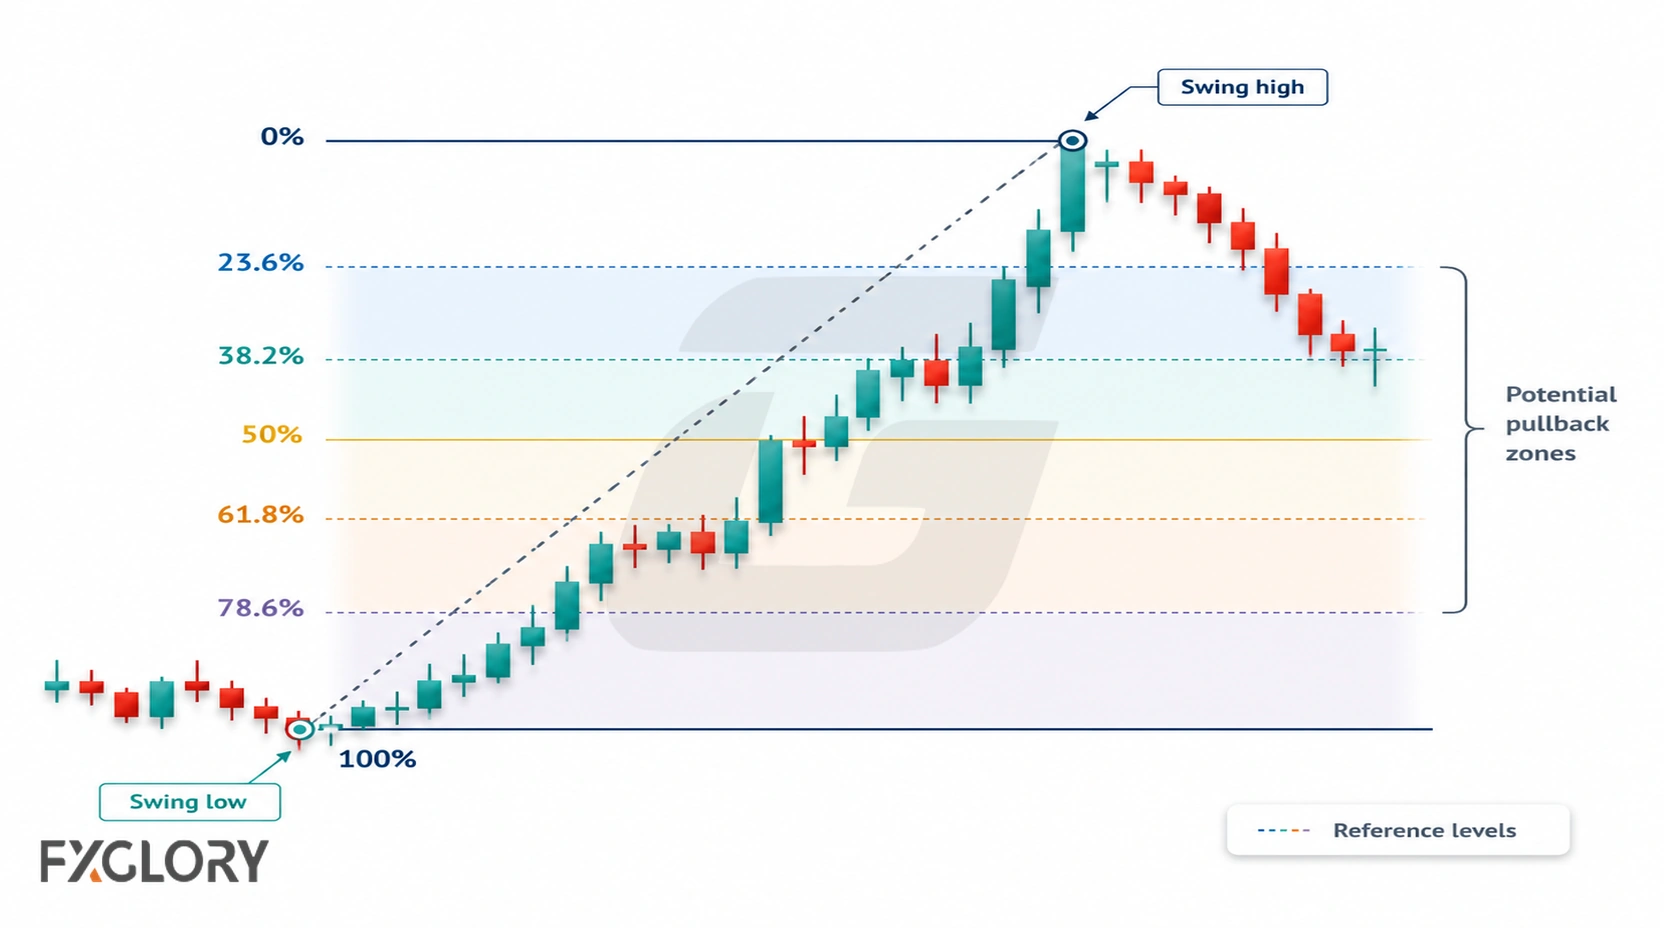
A trader selects a swing high and swing low, and the charting tool places ratio levels between or beyond those points. The levels provide reference areas for analysis; they do not tell a trader by themselves where to enter, exit, or how much to risk.
For the broader framework around chart-based analysis, see the technical-analysis roadmap.
Fibonacci Numbers, Ratios, and Forex Levels
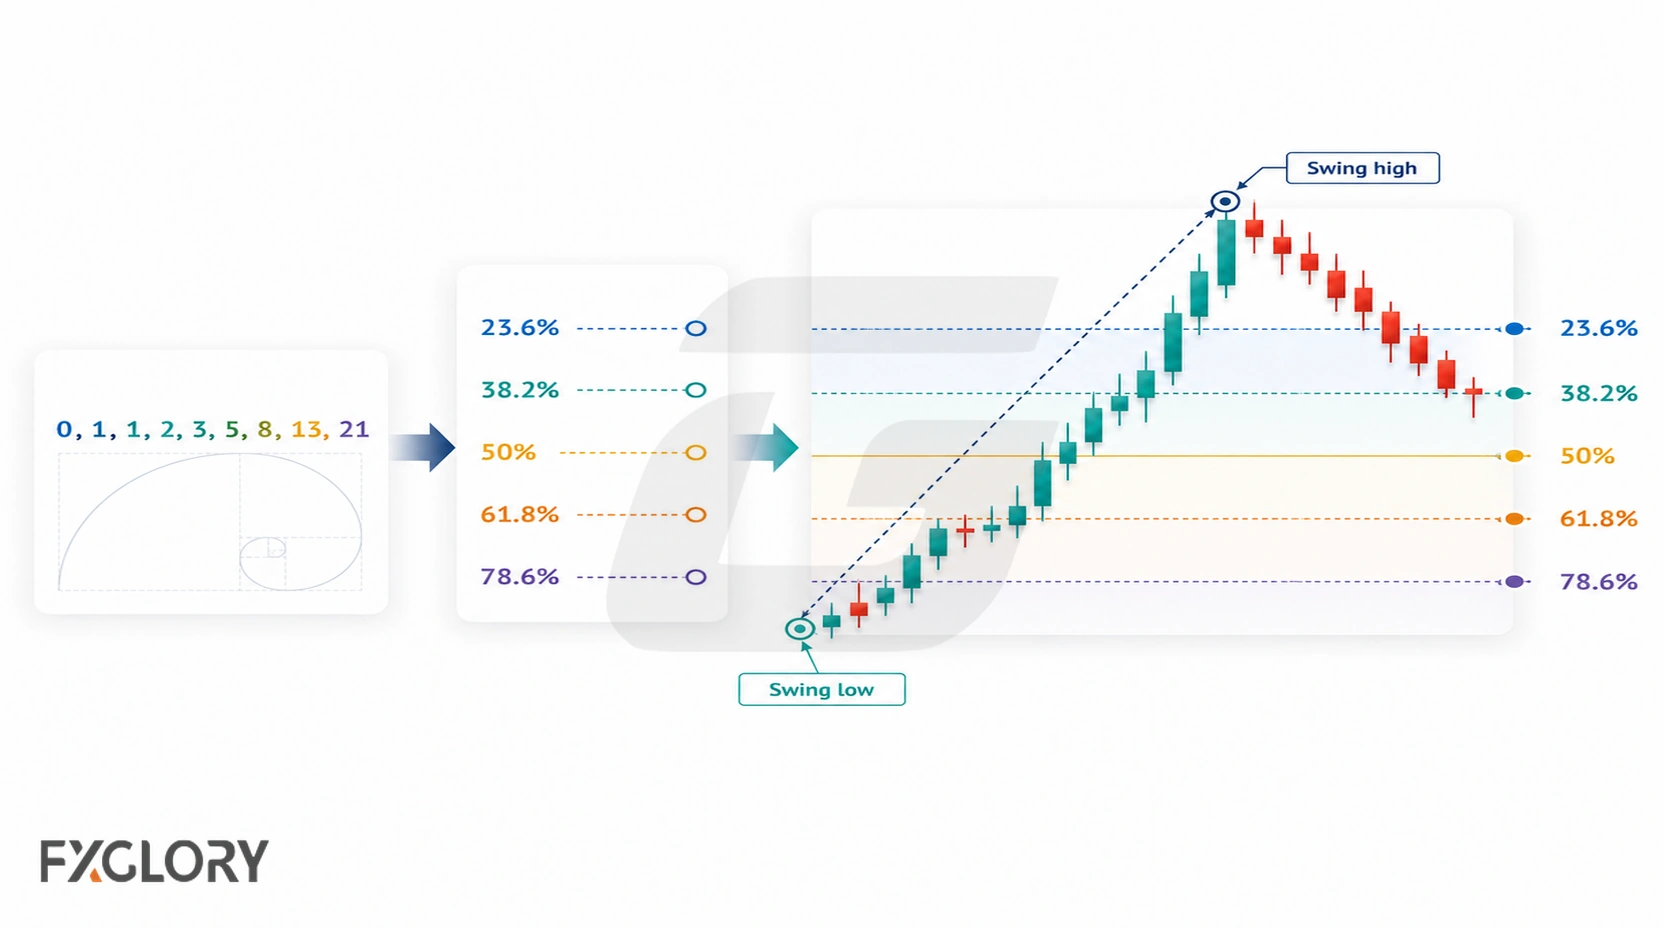
The Fibonacci sequence begins 0, 1, 1, 2, 3, 5, 8, 13, 21, with each new number formed by adding the two before it. In forex charting, traders generally work with percentages derived from Fibonacci relationships rather than plotting the raw sequence numbers.
| Level Type | Common Levels | What They Show |
|---|---|---|
| Retracement | 23.6%, 38.2%, 50%, 61.8%, 78.6% | Possible pullback zones inside a selected swing |
| Extension | 127.2%, 161.8%, 200% | Possible projected zones beyond the original swing |
The 50% level is commonly included in Fibonacci retracement tools because traders often watch whether price gives back about half of a prior move. It is a conventional midpoint level, not a Fibonacci-sequence ratio.
Fibonacci Retracement vs Fibonacci Extension
| Tool | Used For | Main Limitation |
|---|---|---|
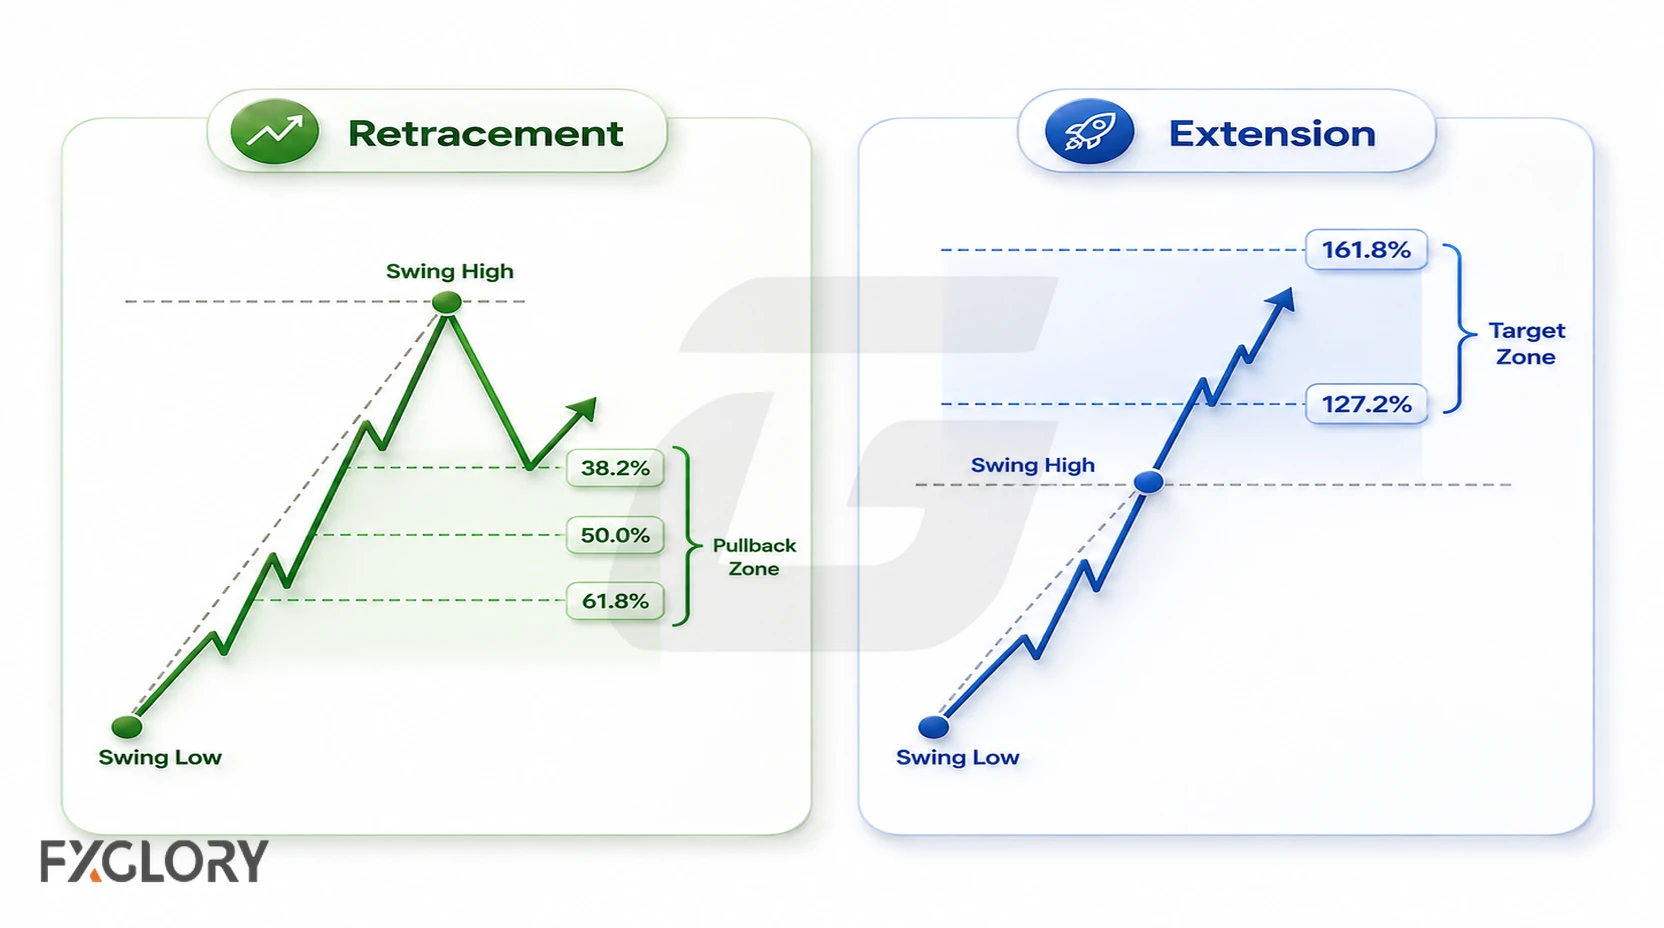
| Fibonacci retracement | Reviewing possible pullback zones within a selected price swing | The chosen level may not hold, especially if the swing anchors are weak |
| Fibonacci extension | Reviewing possible projected zones beyond the original swing | The projected zone may be missed, overshot, or never reached |
Both tools measure a selected move. The difference is whether the level is being read inside that move or projected beyond it.
How Fibonacci Is Drawn on a Forex Chart
A Fibonacci drawing starts with two chart anchors: a visible swing high and swing low. Because anchor selection is partly interpretive, two traders can draw different levels on the same market.
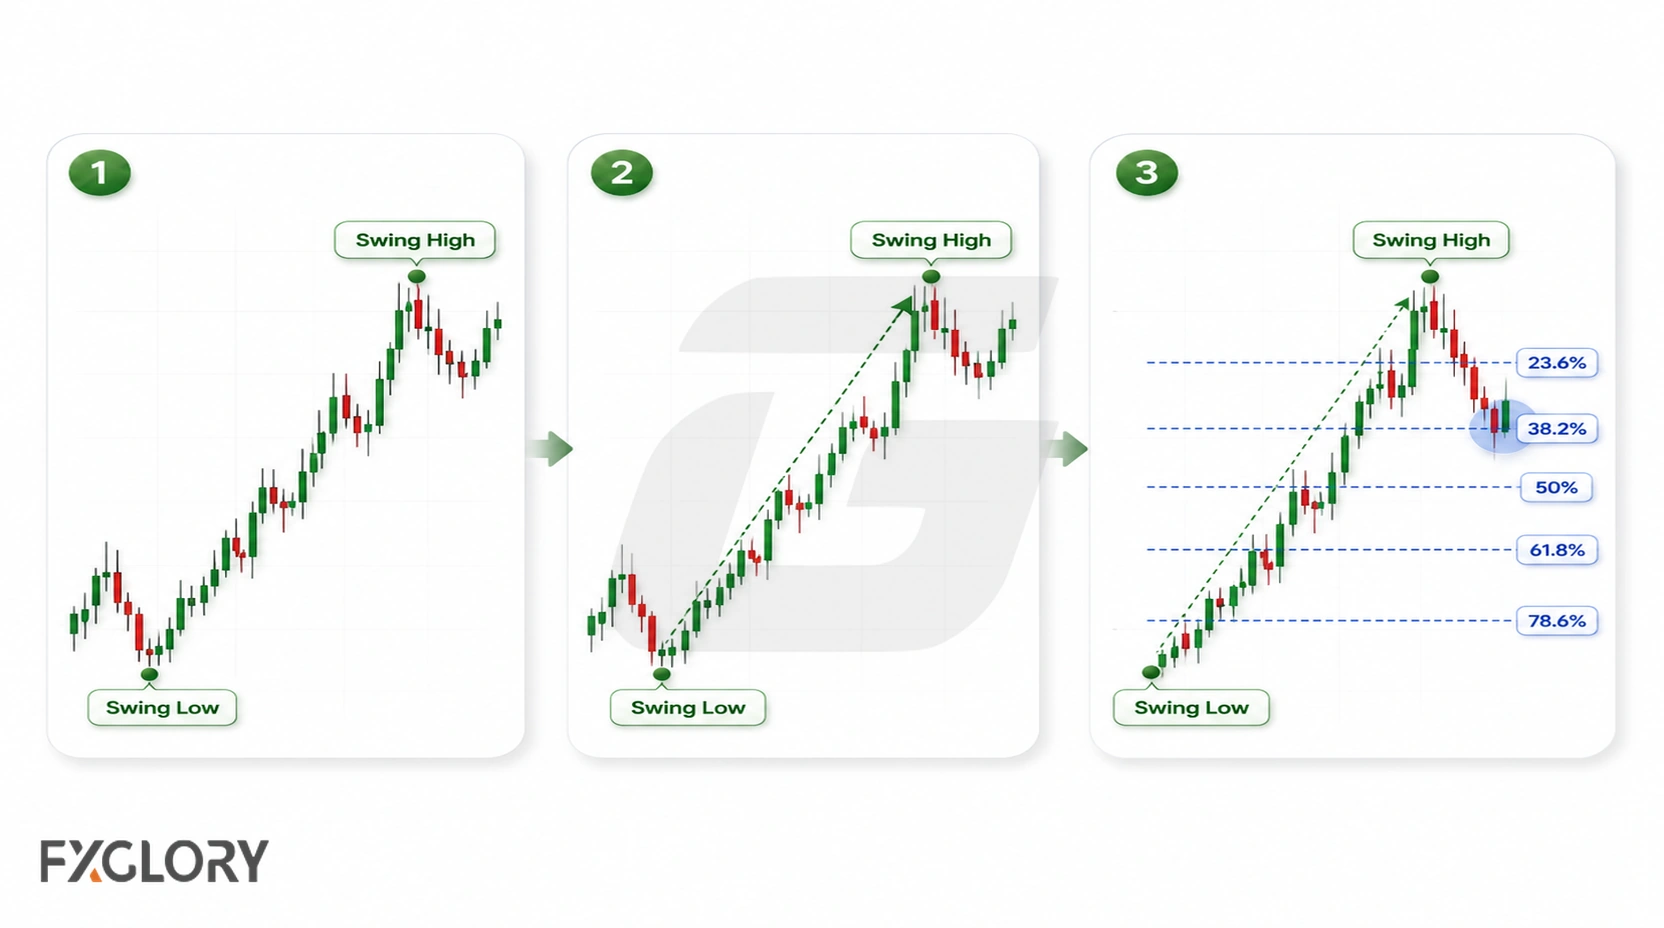
Before drawing, make sure the pair or asset, timeframe, chart type, and current price area are clear. If those basics are unfamiliar, review how to read a forex chart.
- Upward move: Draw from the swing low to the swing high when reviewing a pullback after an advance.
- Downward move: Draw from the swing high to the swing low when reviewing a pullback after a decline.
- Clear anchors: Prefer obvious swing points over small, noisy fluctuations.
How Traders Read Fibonacci Levels
A Fibonacci level becomes more informative when it is read with the chart around it rather than in isolation. Traders may compare the level with trend direction, swing structure, previous reaction areas, and current price behavior.
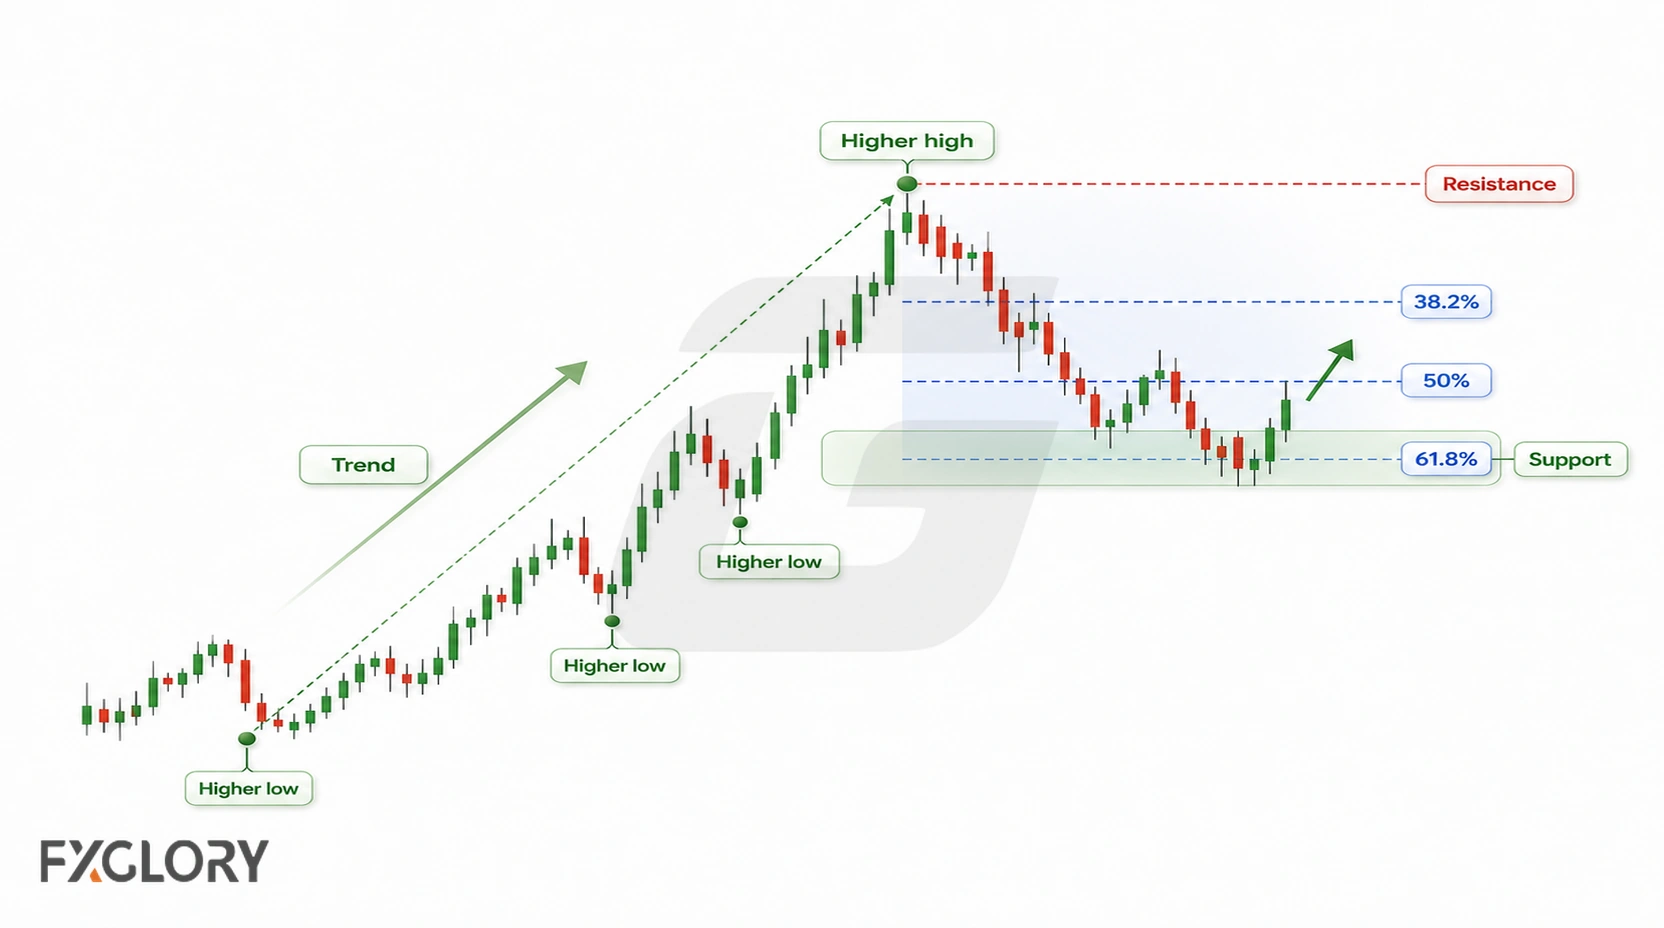
| Context | What to Review | Related Reading |
|---|---|---|
| Trend | Whether the measured swing fits an upward, downward, sideways, or unclear market | Forex trend |
| Market structure | Whether the selected highs and lows form a meaningful swing | Forex market structure |
| Support and resistance | Whether a Fibonacci zone overlaps an area where price has reacted before | Support and resistance |
| Price behavior | Whether price pauses, rejects, trades through, or overshoots the zone | Use the current chart rather than assuming the level must hold |
Alignment can make a zone more relevant to review, but it does not convert the level into a guaranteed signal.
Fibonacci Tools vs Fibonacci Chart Patterns
Fibonacci retracement and extension tools measure a selected swing. Fibonacci-based chart patterns use ratios to measure a broader price structure made from multiple swings.
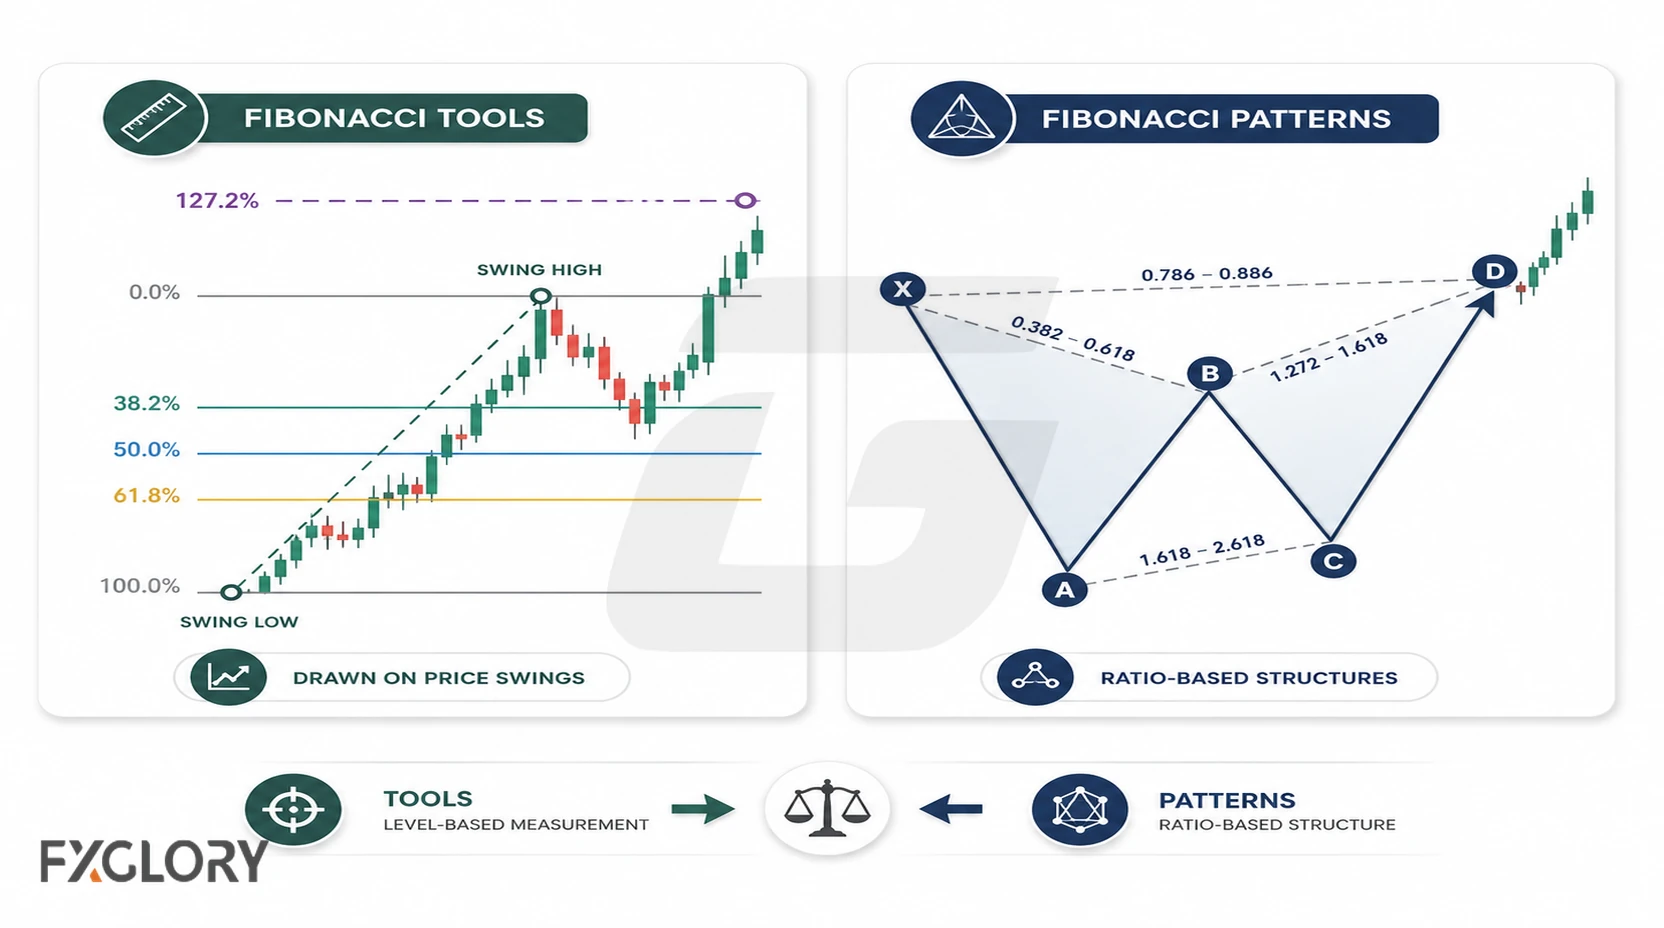
Harmonic patterns such as ABCD, Gartley, Bat, Butterfly, Crab, and Cypher use Fibonacci ratios to define measured structures and possible completion zones. For that topic, see harmonic patterns in forex.
Timeframes and Fibonacci in Forex
Every Fibonacci drawing belongs to a specific timeframe. A level on a 5-minute chart reflects a different swing context from a level on a daily chart.
- Higher timeframe: Shows broader swing context.
- Lower timeframe: Shows finer detail but can contain more noise.
- Mixed timeframes: A short-term level can conflict with the larger chart condition.
The timeframe does not make a Fibonacci level certain; it defines the scale of the move being measured.
Common Mistakes With Fibonacci Forex Trading
Most Fibonacci mistakes come from weak anchor selection or from treating reference levels as automatic signals.
- Forcing swing points: Changing anchors until a preferred level appears makes the drawing fit the conclusion instead of the chart.
- Using a messy range: Heavy overlap can make it difficult to identify a clean swing to measure.
- Treating 61.8% as a required reaction: Price can stop before it, trade through it, or ignore it.
- Using extensions as guaranteed targets: Projected levels are possible review zones, not promised destinations.
- Mixing tools and patterns: A retracement drawing is not the same analysis as a harmonic pattern.
- Ignoring trading conditions: Spread, volatility, liquidity, position size, and account risk still matter around any chart level.
- No invalidation point: If a trader cannot explain what chart development would make the Fibonacci scenario no longer useful, the setup lacks a clear boundary.
Example: Fibonacci Retracement on Gold
Suppose gold has made a visible upward swing on the timeframe being studied. A trader can draw Fibonacci from the swing low to the swing high to map possible pullback zones within that move.
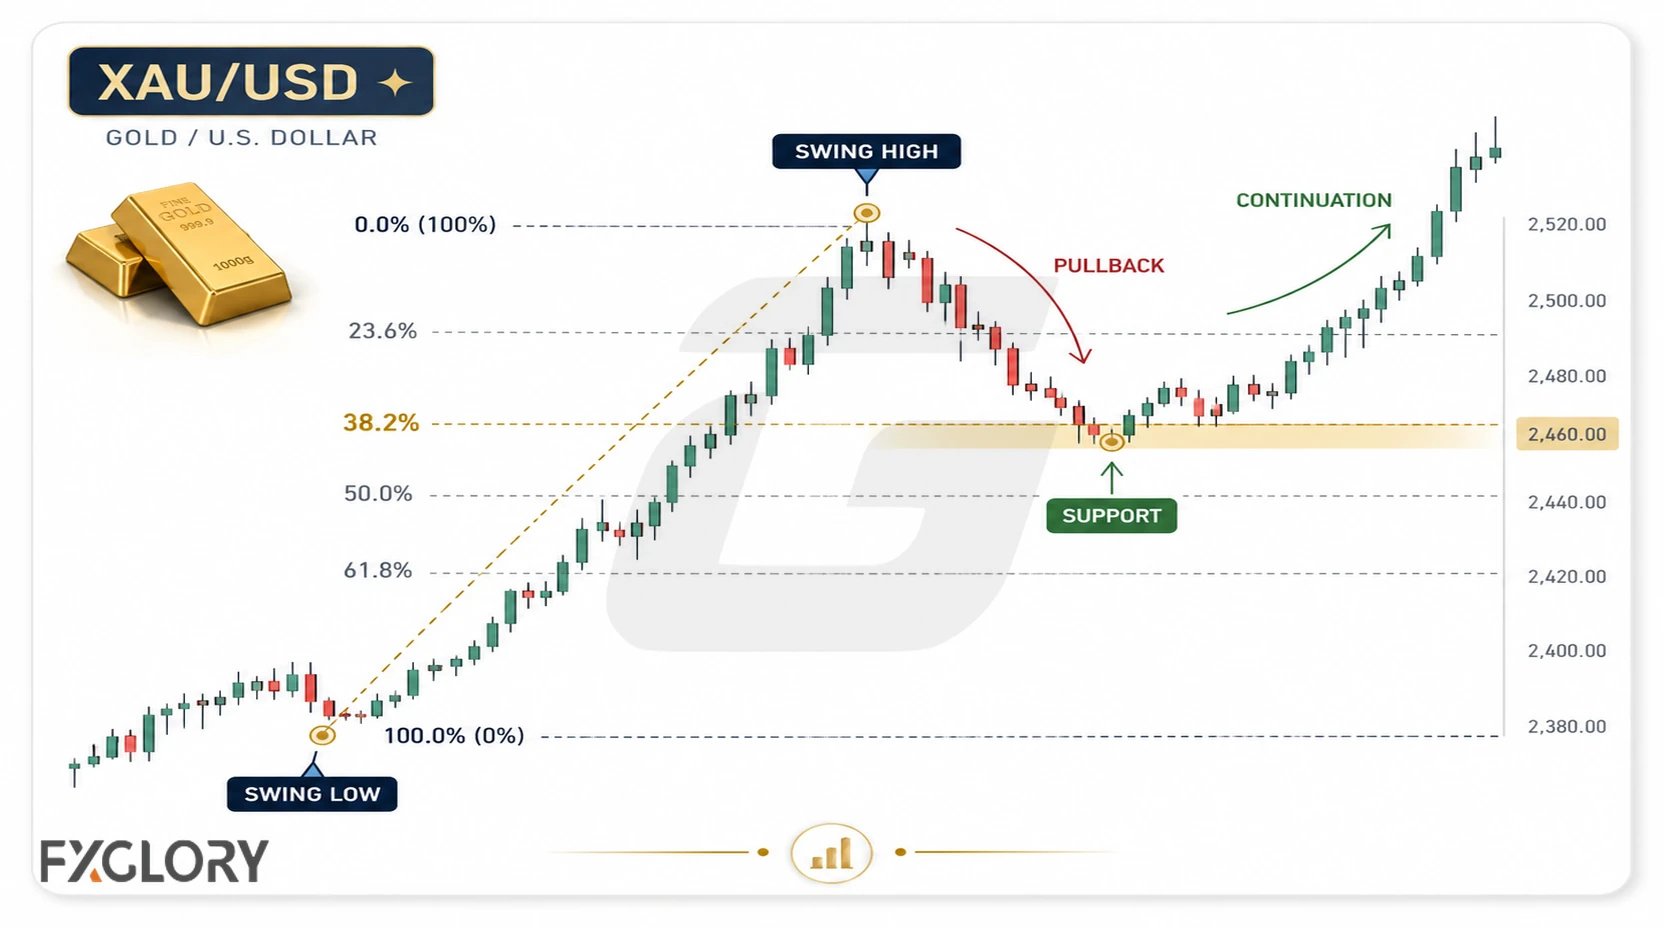
If gold later trades near the 38.2%, 50%, or 61.8% area, those zones can be compared with the surrounding chart context. Price may pause, reverse, continue lower, or pass through a level without a meaningful reaction.
The example is a chart-analysis exercise, not a trade recommendation. A live decision would still need to account for market conditions, execution, position size, and account risk.