
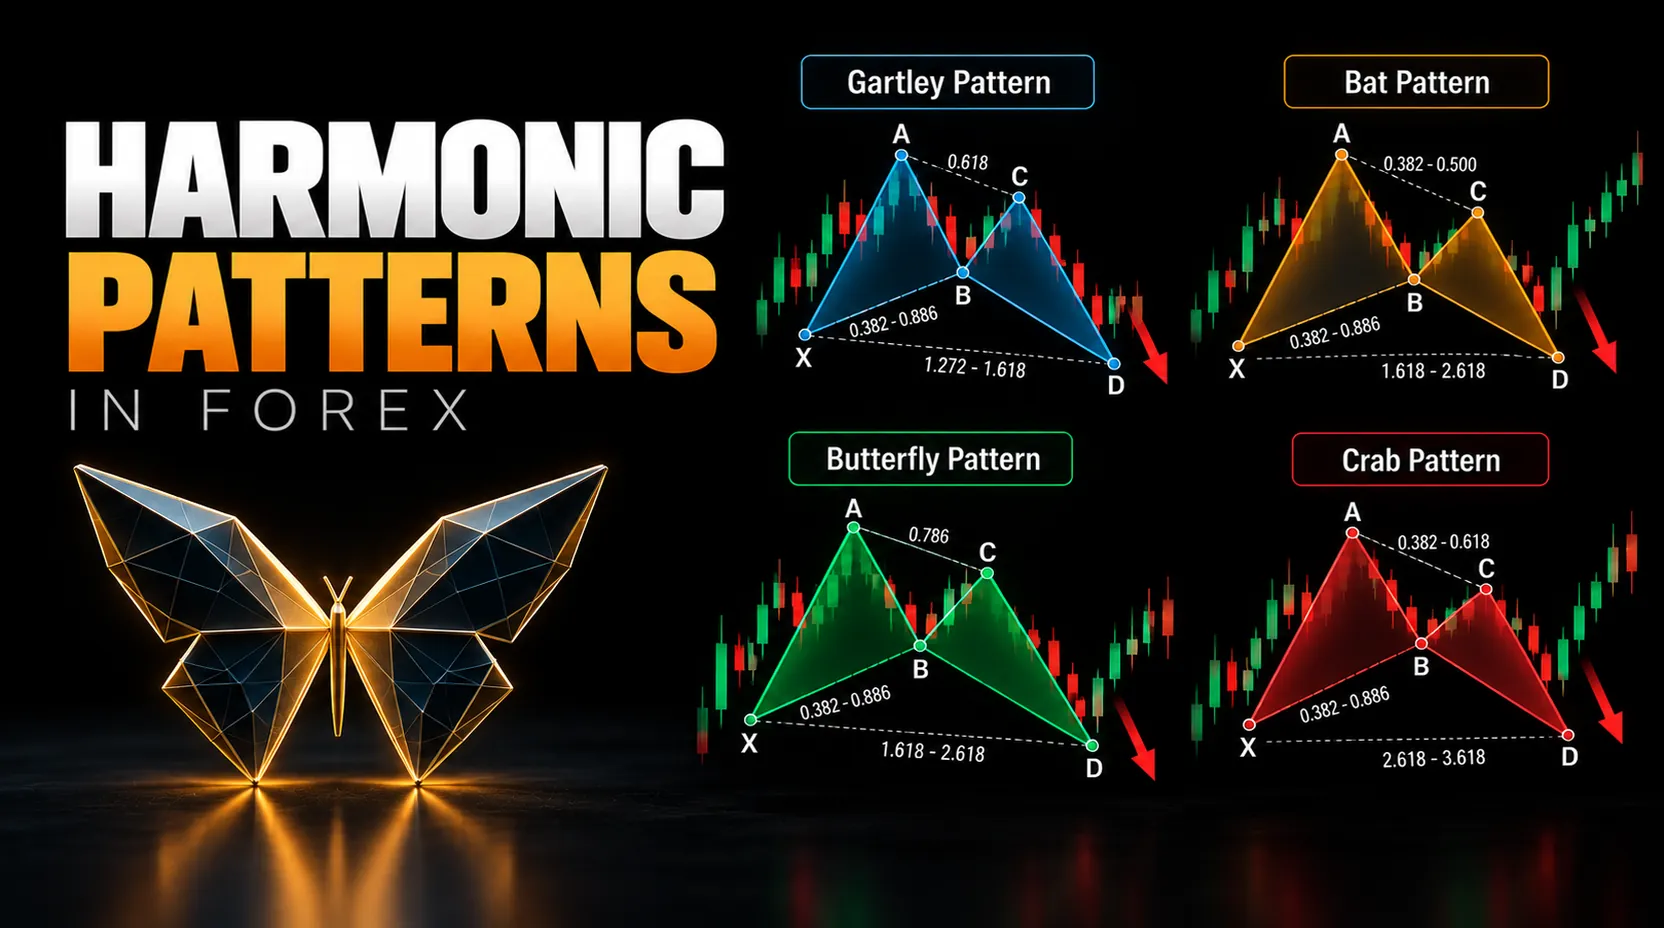
What Are Harmonic Patterns in Forex?
Harmonic patterns in forex are advanced chart structures that use Fibonacci retracement and extension ratios to study price swings. Instead of relying only on a visual shape, harmonic analysis checks whether each swing fits a specific ratio relationship.
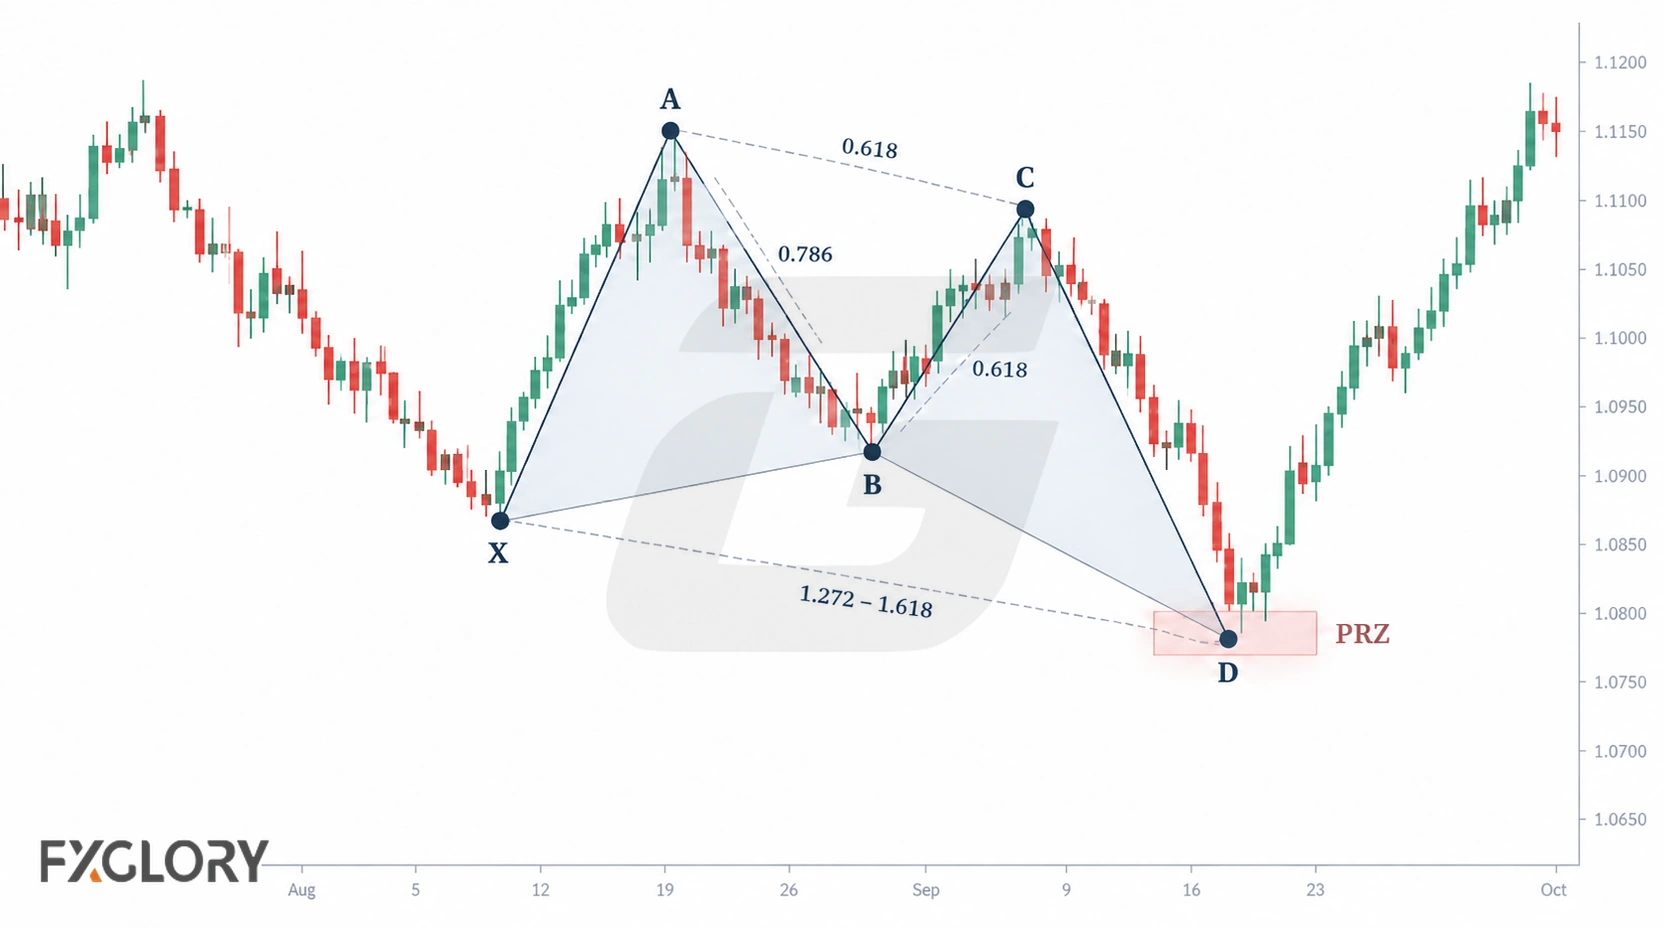
Most harmonic patterns use a sequence of points labeled X, A, B, C, and D. The final D area is often watched as a potential reversal zone, but it is not a guaranteed reversal point. A structure may be complete there even if price later ranges, continues through the zone, or never provides a trade confirmation.
Harmonic patterns belong to the broader chart-pattern family, but they are more measurement-heavy than many classic formations. They are not ideal first patterns for beginners because they require swing selection, ratio measurement, and completion discipline. Any trade based on them also needs a clear risk plan. For the wider chart-pattern framework, start with the main chart-pattern guide.
Fibonacci Chart Patterns in Forex
Fibonacci chart patterns in forex usually refer to measured price structures that use retracement and extension ratios. Harmonic patterns are the clearest example because they use Fibonacci relationships between swing points to define possible completion areas.
This is different from using a Fibonacci retracement tool by itself. A retracement tool marks ratio-based zones between selected swing points. A harmonic pattern measures a broader structure, such as ABCD, Gartley, Bat, Butterfly, Crab, Shark, or 5-0, and then studies whether price reacts near a potential reversal zone.
For the basic tool side, review Fibonacci retracement and extension basics.
How Harmonic Patterns Work
Harmonic patterns work by comparing price swings with Fibonacci ratios. A trader marks important swing points, measures retracements and extensions, and checks whether the structure matches a known harmonic pattern.
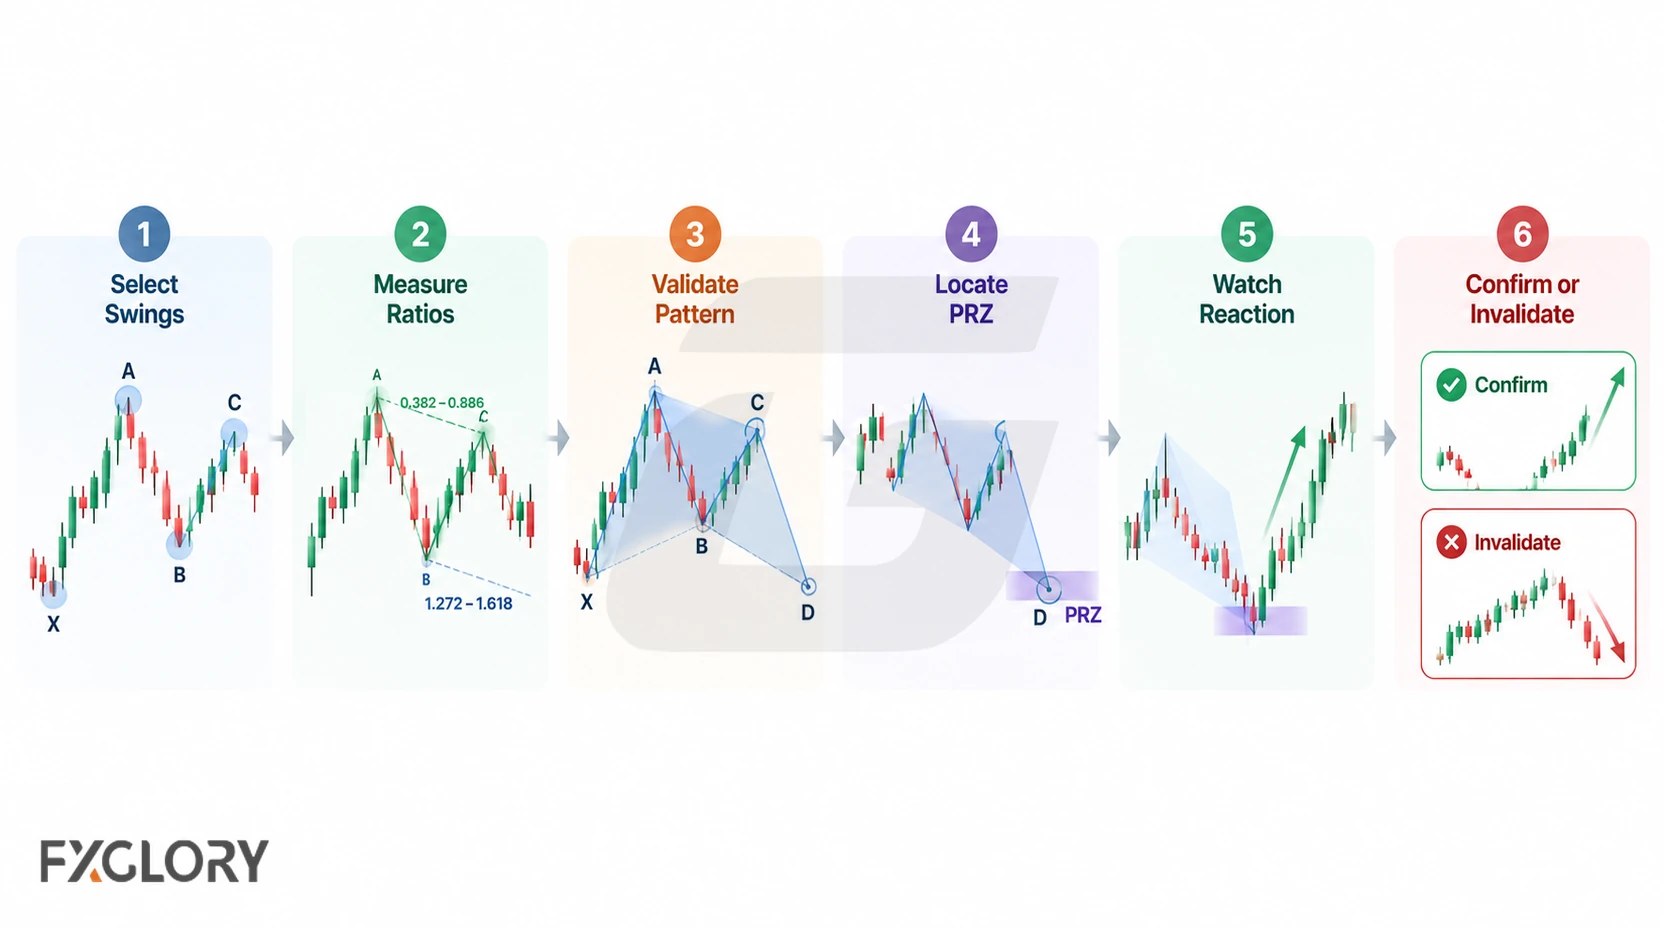
The goal is not to find a perfect drawing. The goal is to decide whether the price structure, ratios, and market context point toward a usable potential reversal zone. If the ratios are forced or the swing points are unclear, the pattern may not be useful.
- Swing selection: The trader identifies the main turning points that create the structure.
- Ratio validation: The retracement and extension legs are checked against expected Fibonacci areas.
- Pattern completion: The required geometry and ratios align when price reaches the D area; a later reversal is not part of geometric completion.
- Potential reversal zone: Multiple ratio measurements may cluster near one area.
- Trade confirmation: Subsequent price behavior may support a reversal scenario but does not retroactively complete the geometry.
- Trade planning: The trader decides which developments would negate the trading hypothesis and where a position would be exited.
Because harmonic patterns require measurement, they are usually harder than basic support-resistance patterns. They can become misleading when traders adjust points until the chart fits the desired pattern.
XABCD Harmonic Pattern Anatomy
Many harmonic patterns use five main points: X, A, B, C, and D. The legs between these points are usually called XA, AB, BC, and CD.
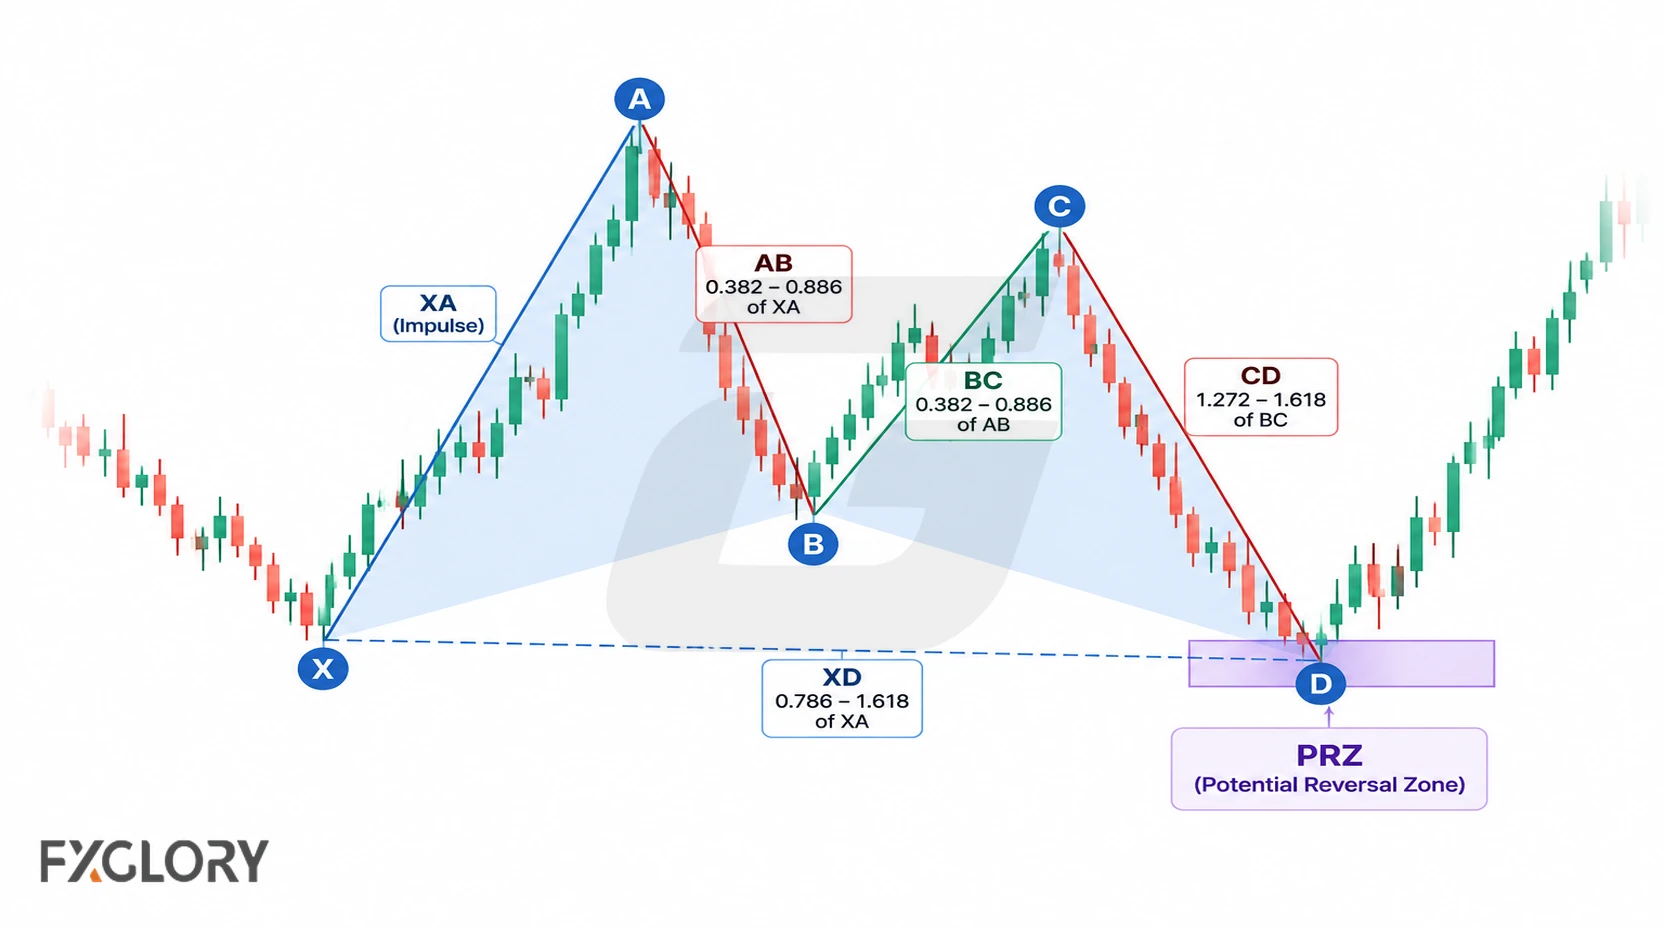
- X: The starting swing point of the structure. It anchors the first major leg.
- A: The end of the first strong move from X. It creates the XA leg used for later ratio checks.
- B: A retracement from A. It often determines which harmonic family may be forming.
- C: A swing from B. It helps form the projected completion area.
- D: The final measured point or completion area. Traders can then assess any price reaction separately.
- XA, AB, BC, and CD: The measured legs between the points. Each leg is checked against ratio expectations.
- PRZ: The potential reversal zone near D. It is a possible reaction area, not a guaranteed turning point.
Harmonic Pattern Map
Use the quick map below to separate the main parts of a harmonic pattern before judging the potential reversal zone.
- X to A: The first clear directional swing gives the structure its starting leg. If XA is unclear, the rest of the pattern becomes weak.
- A to B: The retracement from the first move begins to define the possible pattern family. If B is forced, the pattern label may be wrong.
- B to C: The second swing starts projecting a possible completion zone. If C is noisy or random, the PRZ may become unreliable.
- C to D: The final swing approaches the area where ratios may converge. Before D forms, the pattern is still only a candidate.
- After completion: Price may react, stall, range, or push through the PRZ. These outcomes inform a trading scenario rather than whether D was reached.
What Is the Potential Reversal Zone?
The potential reversal zone, often shortened to PRZ, is the area where several Fibonacci measurements may converge near point D. Traders watch this area because it can become a reaction zone if the pattern is valid and market context supports it.
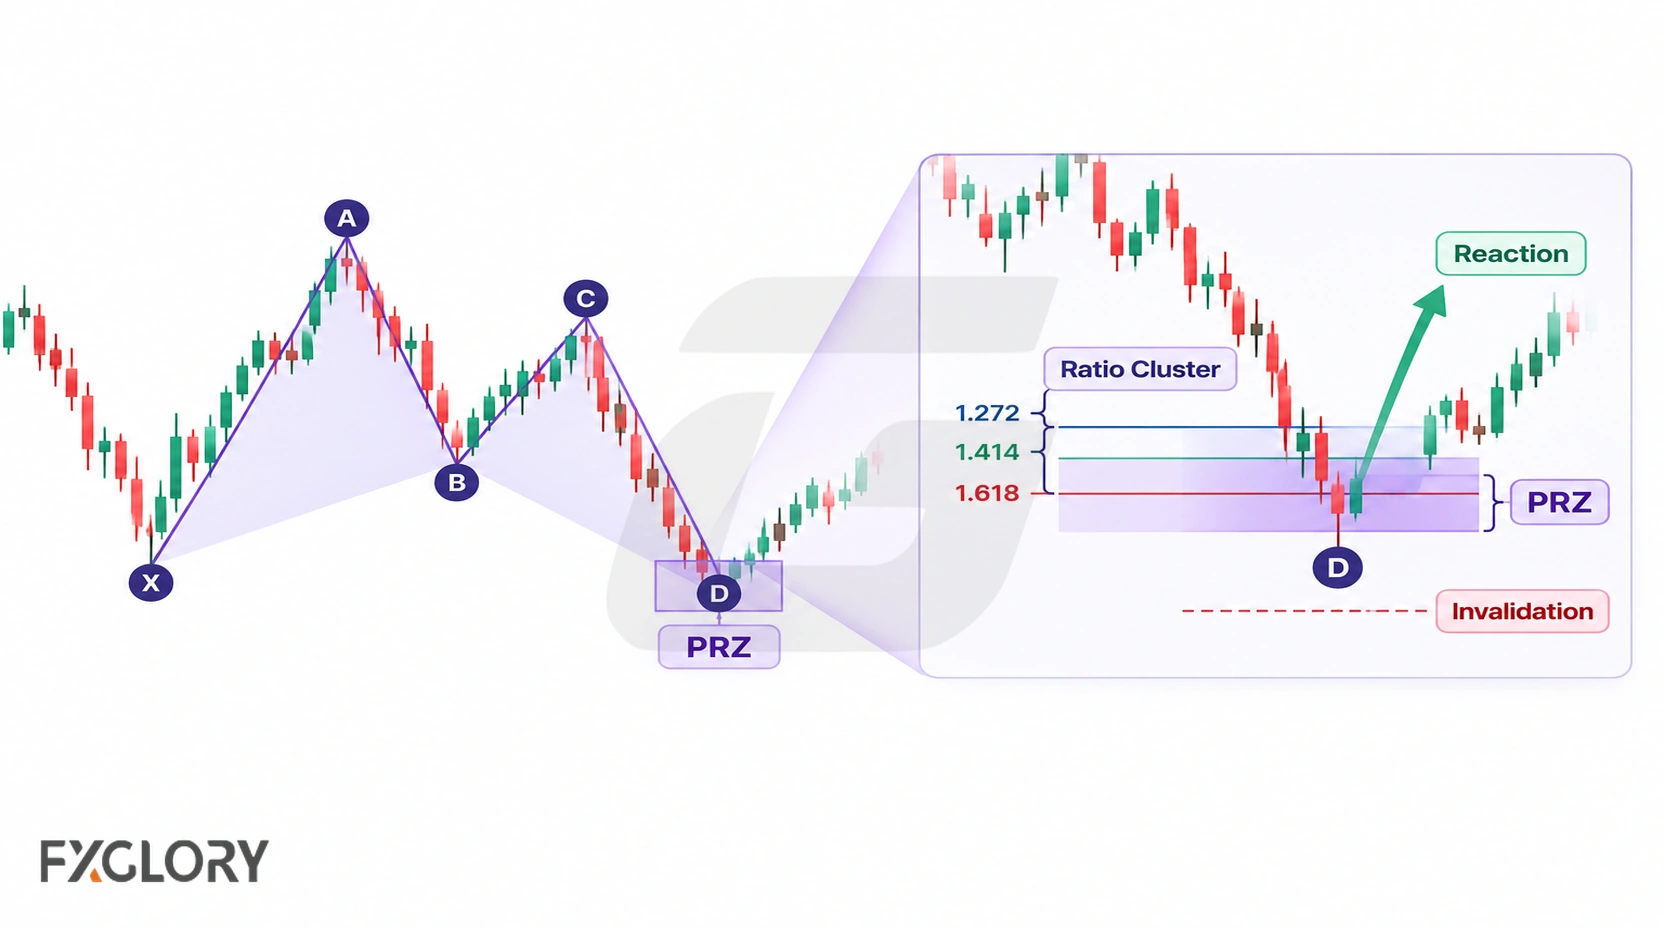
The word “potential” matters. A PRZ is not a promise that price will reverse. Price can stall, pierce the zone, range around it, or move through it completely.
- Ratio cluster: Several measurements point to a similar area. Ratios should not be forced to match.
- Price reaction: Candles or swing behavior show response near the zone. A single candle is not enough by itself.
- Context: The zone aligns with support, resistance, trend, or volatility context. Context can still fail during news or fast movement.
- Trading plan: A trader using the PRZ should define where the proposed reversal trade would no longer make sense. This is separate from measuring the PRZ.
Bullish vs Bearish Harmonic Patterns
Many harmonic patterns can appear in bullish or bearish form. The pattern name may stay the same, but the direction of the swings changes.
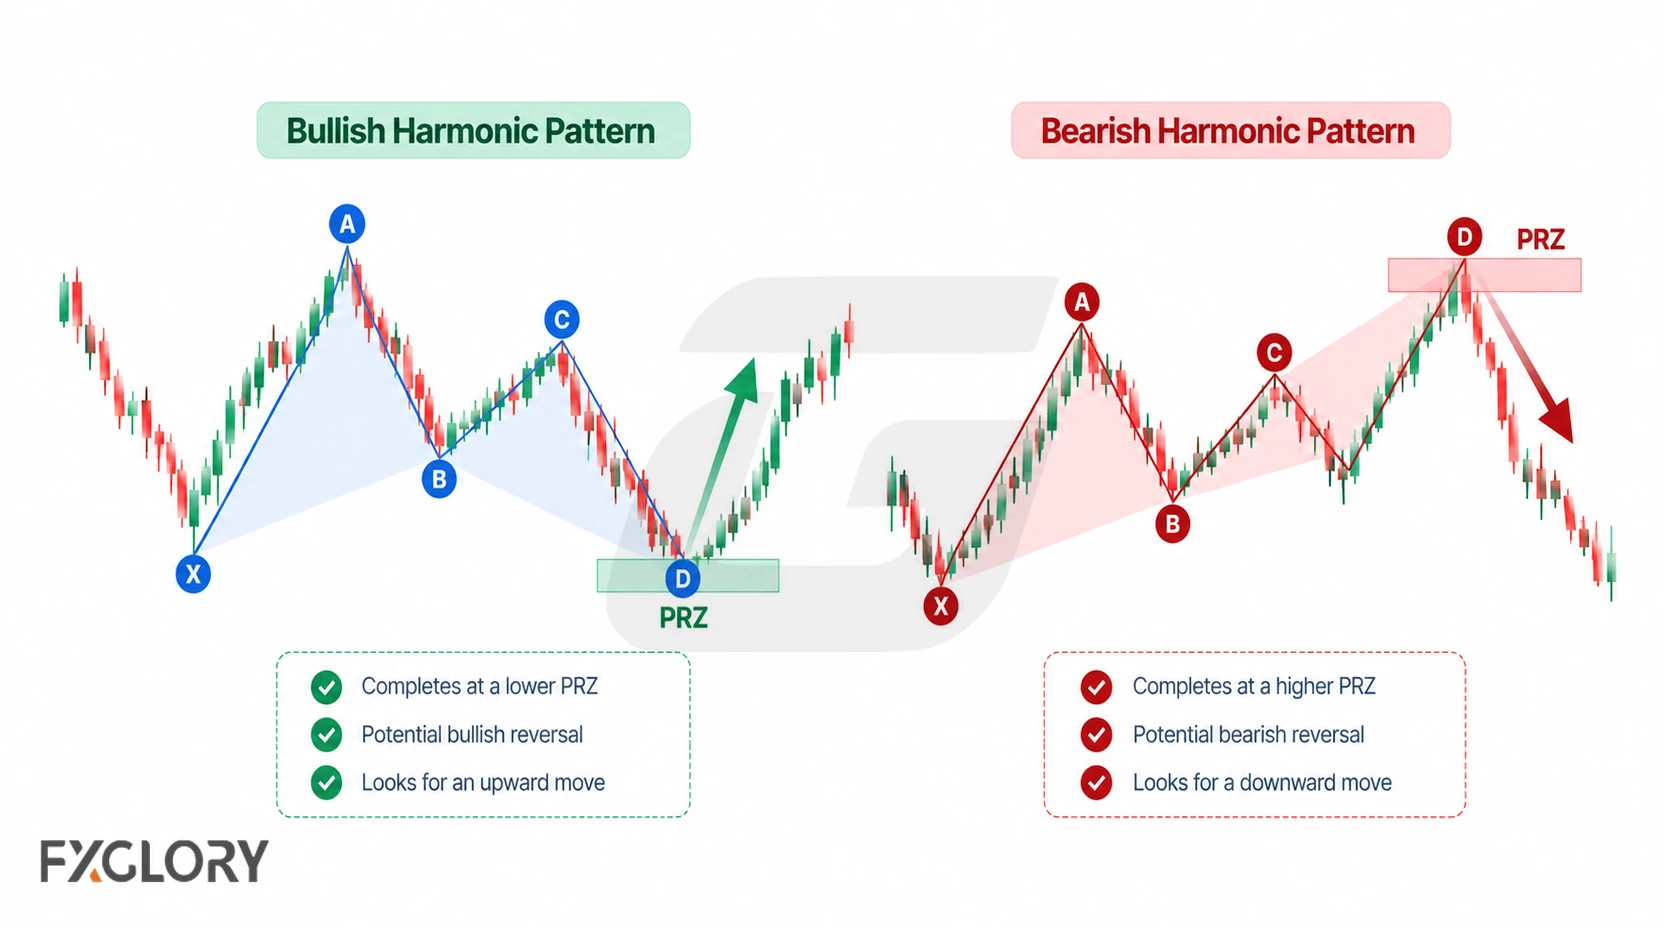
- Bullish harmonic pattern: Price completes near a lower D area. Selling pressure may be weakening near the PRZ, but a reversal trade still needs evidence and a risk plan.
- Bearish harmonic pattern: Price completes near an upper D area. Buying pressure may be weakening near the PRZ, but a reversal trade still needs evidence and a risk plan.
A bullish harmonic pattern is not automatically a buy signal, and a bearish harmonic pattern is not automatically a sell signal. The structure only creates a possible scenario that still needs price confirmation and risk control.
Common Harmonic Patterns in Forex
There are several harmonic patterns in forex. Some are simpler, while others require more precise swing and ratio validation.
- ABCD: A measured four-point structure with two main directional legs. It is often used as a foundation for understanding harmonic movement.
- Three-Drive: Three related pushes with retracement and extension logic. It needs symmetry and ratio validation, not just three swings.
- Gartley: A five-point XABCD pattern that completes before price returns to X. It is commonly studied, but easy to misdraw if ratios are forced.
- Bat: A five-point pattern with a deeper D completion than some Gartley structures. Its XA and B-point measurements must be checked against Bat-specific rules.
- Butterfly: A five-point extension pattern where D usually completes beyond X. It needs separate study because its extension logic is specific.
- Crab: An extension-style pattern with a deeper completion zone. It can involve sharp movement near point D.
- Deep Crab: A variation of Crab with a deeper B retracement concept. It can be difficult to validate cleanly on noisy charts.
- Shark: A newer-style harmonic structure with different point logic from classic XABCD patterns. It should not be mixed casually with Gartley-style rules.
- 5-0: A structure that often follows a strong prior move and retracement logic. It requires careful sequence recognition and invalidation.
This page explains the harmonic family as a whole. For a deeper look at the Butterfly structure, use the Butterfly harmonic pattern guide.
Harmonic Pattern Ratio Reference
Different harmonic patterns use different ratio expectations. The reference below gives broad ideas, not a rigid rulebook. Pattern definitions differ across methodologies; a chosen rule set should be applied consistently. Data feeds and swing selection can affect measured values, but they do not make the defining ratios interchangeable.
- ABCD: AB and CD are often compared for proportion or extension. Equal-looking legs alone do not confirm a reversal.
- Gartley: B is often watched near a 61.8% retracement of XA, with D often near a 78.6% XA area. Forcing B or D weakens the reading.
- Bat: B is commonly measured in the 38.2%–50% XA retracement region, with D near an 88.6% XA retracement. A price reaction is a separate trading consideration.
- Butterfly: B is often watched near 78.6% of XA, while D may extend beyond X. Detailed Butterfly rules belong on the dedicated Butterfly page.
- Crab: D is often watched as a deep extension beyond X, commonly around a 161.8% XA extension concept. Deep extensions can be volatile and difficult to manage.
- Deep Crab: B is commonly near an 88.6% XA retracement, while D extends beyond X toward a 161.8% XA projection. Check the selected methodology rather than mixing it with standard Crab rules.
- Shark: Shark patterns use different ratio structure and point logic from classic Gartley-style XABCD patterns. Validate the Shark by its own structure rather than applying generic XABCD rules.
The Harmonic Pattern Completion Rule
A harmonic pattern is not complete just because X, A, B, and C are visible. The D area matters because it is where the pattern reaches its expected completion zone.
Acting before completion can turn harmonic analysis into guessing. A partially formed pattern can change shape, extend further, or disappear as new price action forms.
- Before D: The pattern is only a candidate, not a complete structure.
- At D: If the selected pattern’s required ratios and swing structure align, the pattern can be geometrically complete even before a reversal appears.
- After D: Price action may support or undermine a proposed reversal trade; confirmation is optional for identifying the finished shape but relevant to entry decisions.
- If D overshoots required boundaries: The original geometric classification may be invalid or require a different pattern interpretation.
Strong vs Weak Harmonic Patterns
A strong harmonic pattern is not just a beautiful XABCD drawing. Its geometric quality comes from clear swing points, suitable ratios, and a well-defined PRZ. Trade confirmation and exit planning determine whether it is actionable, not whether its geometry exists.
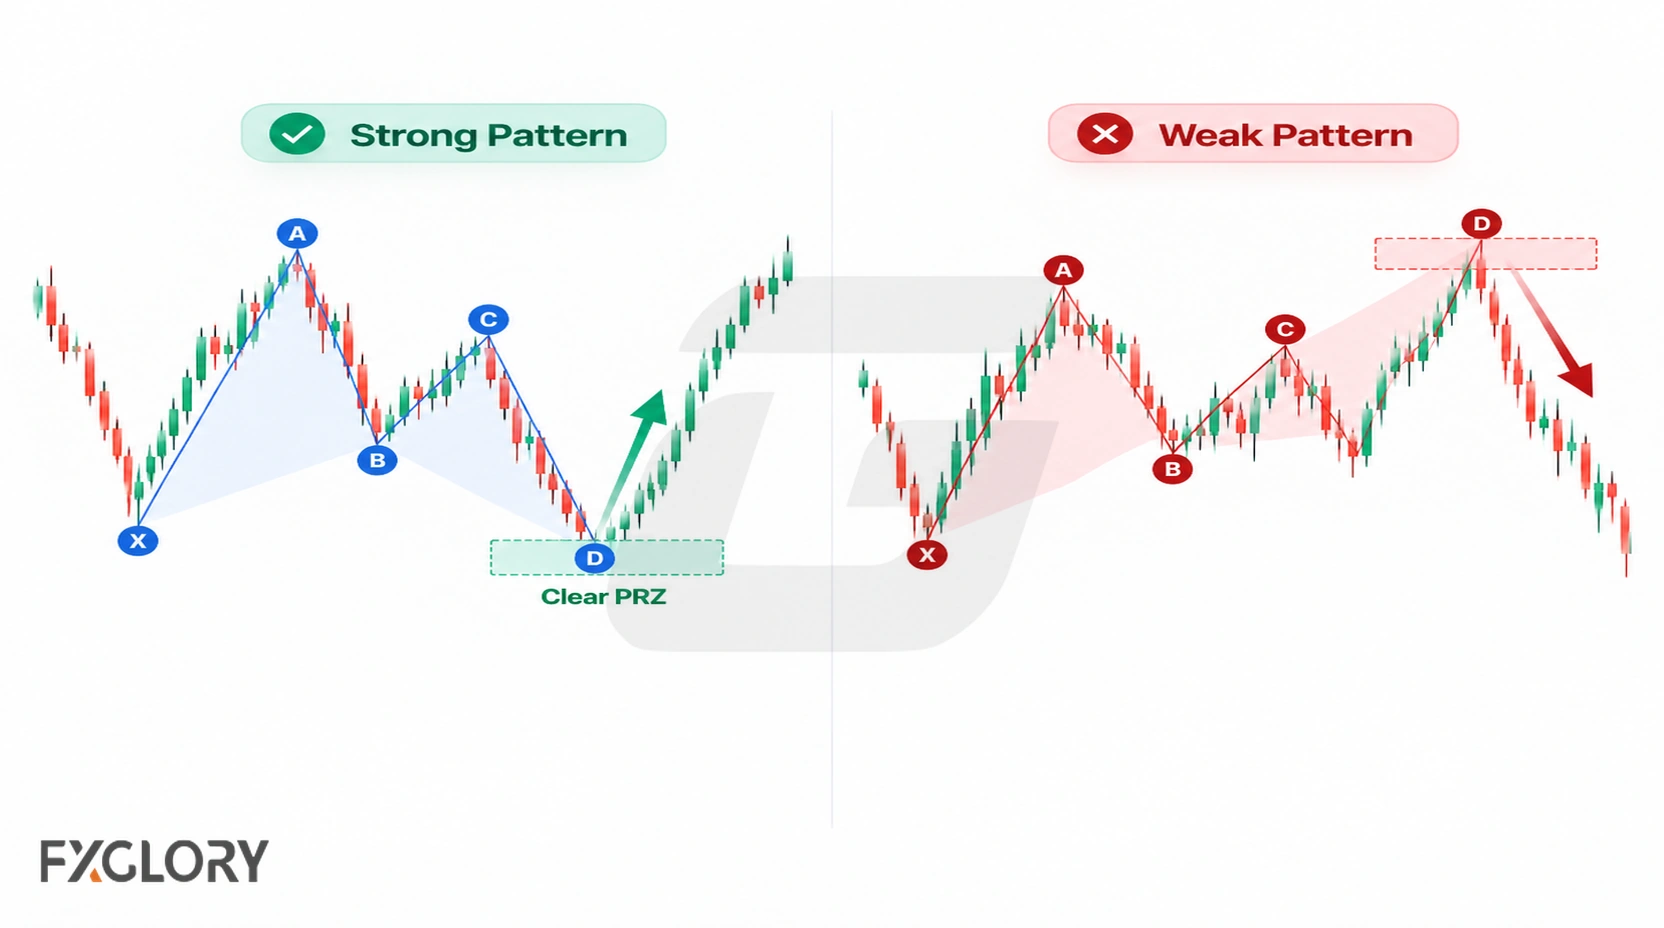
- Swing points: Stronger patterns have X, A, B, C, and D points that are visible without forcing them. Weaker patterns depend on tiny or random fluctuations.
- Ratio alignment: Stronger patterns have several ratios supporting a similar completion area. Weaker patterns stretch ratios until they match the desired pattern.
- PRZ quality: Stronger patterns have a potential reversal zone narrow enough to study and plan around. Weaker patterns have PRZ areas that are too wide or vague to be useful.
- Context: Stronger patterns align with meaningful structure, volatility, or broader market context. Weaker patterns ignore nearby levels, trend, or news conditions.
- Completion: A finished pattern has reached an eligible D area; an XABC candidate should not be mislabeled as complete.
- Trade evidence: Price reaction or follow-through may strengthen a proposed reversal trade, but cannot repair incorrect Fibonacci measurements.
- Risk plan: A well-prepared trade has its exit condition and position risk defined before entry, regardless of pattern quality.
How to Confirm Harmonic Patterns in Forex
Confirmation helps separate a completed harmonic structure from a more developed trading scenario. It does not prove that price will reverse, but it gives more information than the ratios alone.
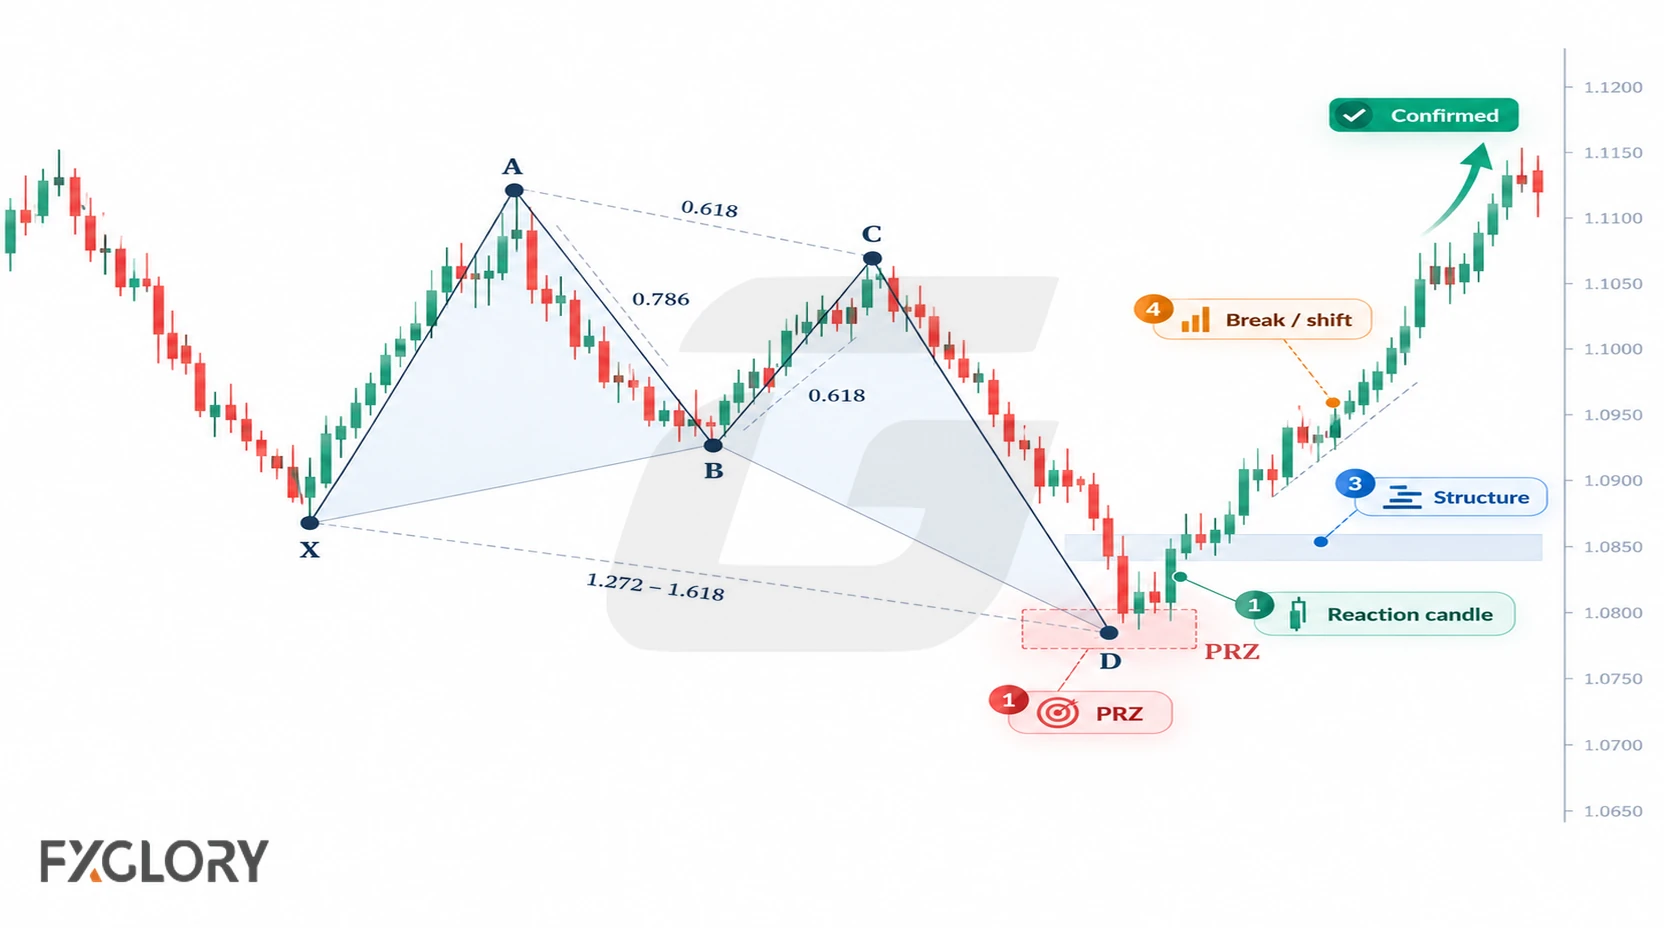
A first reaction at D can be brief and misleading. Traders may look for rejection candles, a local structure shift, or follow-through away from the PRZ, but each signal can fail. The earlier ratio checks establish whether the pattern completed; these later observations address the trade idea.
Confirmation can include candle reaction, a structure shift, a break of a minor trendline, momentum change, or price holding away from the PRZ. None of these removes risk.
Structural Invalidation vs Trade-Risk Invalidation
Structural invalidation means the measured swings or required ratios no longer satisfy the rules of the named pattern. This differs from an unfinished candidate, a completed pattern that fails to reverse, and a trader’s stop-loss decision.
- Unfinished candidate: Price has not yet reached the required D area, so completion has not been established; this is not a failed completed pattern.
- Geometric mismatch: Ratios or swing points do not meet the chosen pattern definition, or an overshoot makes the originally identified D structure invalid.
- Reversal scenario failure: Price moves decisively through the PRZ or produces contrary follow-through after valid geometric completion. The expected trade may fail even though the pattern was identified correctly.
- Market conditions: News, higher-timeframe trends, spreads, and slippage may weaken the trading case or affect execution without altering the measured historical geometry.
- Trade exit: A stop-loss or other predefined exit controls exposure. Its placement depends on the strategy and risk budget and is not necessarily identical to structural invalidation.
Some harmonic methods project target zones from pattern legs, but these are conditional objectives, not promises. Traders should evaluate an exit plan and position risk before considering potential rewards. For a fuller explanation, see trade risk management.
Harmonic Pattern vs Fibonacci Retracement
Harmonic patterns and Fibonacci retracement are related, but they are not the same thing. A harmonic pattern uses several measured swings and a completion area, while a Fibonacci retracement usually measures one move to study possible reaction levels.
- Main structure: A harmonic pattern uses a multi-leg structure such as XABCD. A Fibonacci retracement measures one move from a swing high to swing low, or low to high.
- Main purpose: A harmonic pattern checks whether several legs form a known ratio-based structure. A Fibonacci retracement marks possible retracement levels within or after one move.
- Completion idea: A harmonic pattern often focuses on point D and a potential reversal zone. A Fibonacci retracement often focuses on price reaction near a selected percentage level.
- Main risk: Harmonic analysis can force swing points until a named pattern appears. Fibonacci retracement can assume one level must hold or reverse price.
- Careful use: Harmonic identification requires ratio and completion checks; trades based on either tool require separate confirmation criteria and risk planning.
Harmonic Patterns vs Classic Chart Patterns
Harmonic patterns and classic chart patterns both organize price structure, but they do it differently.
- Main focus: Harmonic patterns focus on Fibonacci ratios and measured swing relationships. Classic chart patterns focus on visual structure such as necklines, compression, or support and resistance.
- Common examples: Harmonic patterns include Gartley, Bat, Butterfly, Crab, and Shark. Classic patterns include head and shoulders, double top, W pattern, triangles, and wedges.
- Completion area: Harmonic patterns often focus on a PRZ near D. Classic chart patterns often focus on breakouts, necklines, support, resistance, or compression decision areas.
- Main risk: Harmonic patterns can be damaged by forced ratios or overfitted swing points. Classic chart patterns can be damaged by forced shapes or entries before confirmation.
- Best use: Harmonic patterns suit multi-leg ratio analysis; classic patterns suit broader shape and level analysis. Neither guarantees a trade outcome.
When the chart is showing a broad reversal structure rather than a ratio-based XABCD setup, trend-exhaustion pattern context may be more relevant. When the goal is to compare all major pattern groups quickly, the chart-pattern reference sheet can help keep the structure organized.
Harmonic Scanner and Automation Caution
Some traders use scanners or automated tools to find harmonic-pattern candidates. These tools may help surface possible structures, but they should not replace manual validation.
A scanner can misread swing points, show a candidate before point D is complete, update the pattern as price changes, label incomplete structures, or ignore broader market context. A detected candidate still needs ratio review and geometric completion checks. Price reaction and a risk plan matter separately if a trade is considered.
Forex Context: Sessions, News, Spread, Slippage, and Volume
Forex harmonic patterns should be read with market conditions because currency pairs trade across global sessions. A potential reversal zone that looks clean during quiet movement may behave differently during a session overlap, economic release, or fast volatility shift.
- Session behavior: Price reactions around point D may behave differently during active sessions than during thin liquidity.
- News events: Economic releases and central-bank comments can overpower a Fibonacci-based structure quickly.
- Spread and slippage: Fast movement around the PRZ, retest, or invalidation area can affect execution and risk.
- Pair behavior: Different currency pairs may swing, retrace, extend, and react differently around harmonic zones.
- Timeframes: A lower-timeframe harmonic pattern can conflict with a stronger higher-timeframe trend, support, or resistance area.
- Volume limits: Spot forex does not have one centralized exchange volume figure, so volume-style readings need careful interpretation.
Some traders watch whether tick activity changes around the PRZ, but this remains supporting context. When volume-style context matters, tick-volume reading in forex should stay secondary to structure and ratio validation, with trade confirmation and risk assessed separately.
Using Indicators and Candles With Harmonic Patterns
Indicators and candlestick reactions can support harmonic-pattern analysis, but they should not replace ratio validation or price structure. Pattern identification still requires clear swings, correct ratios, and an eligible D area; confirmation and trade exits are subsequent decisions.
- Fibonacci tools: Help measure retracement and extension relationships between pattern legs, but the trader still chooses swing points.
- Momentum indicators: May help show whether pressure is fading near the PRZ, but divergence can continue for some time.
- Oscillators: May show whether price appears stretched near point D, but overbought or oversold readings are not reversal proof.
- Volatility indicators: May show whether movement is expanding or contracting around the PRZ, but high volatility can make execution and invalidation harder.
- Support and resistance: May show whether the PRZ aligns with a meaningful chart area, but a level does not confirm the pattern by itself.
- Candlestick reactions: May show short-term rejection or hesitation near point D, but one candle is not the same as harmonic confirmation.
- Tick activity: May add activity context around the PRZ, reaction, or retest, but it is supporting context, not centralized market volume.
When momentum is part of the reading, MACD momentum context or RSI pressure readings may help organize the analysis. When movement size matters around the completion area, ATR-based volatility context can be useful. When candle reaction matters near point D, candlestick behavior around key areas can add short-term detail.
Example: Measuring a Hypothetical EUR/CHF Gartley
Consider a purely hypothetical bullish Gartley-like structure in EUR/CHF. Assume the swing points are X = 1.08000, A = 1.10000, B = 1.08764, C = 1.09664, and D = 1.08428. These figures are invented solely to demonstrate measurement; they are not historical market observations or backtest results.
- XA: 1.10000 − 1.08000 = 0.02000 (200 pips).
- AB retracement: (1.10000 − 1.08764) ÷ 0.02000 = 61.8% of XA.
- BC retracement: (1.09664 − 1.08764) ÷ (1.10000 − 1.08764) ≈ 72.8% of AB.
- D completion: (1.10000 − 1.08428) ÷ 0.02000 = 78.6% of XA.
- AB and CD: Both legs measure 0.01236 (123.6 pips); CD is approximately 137.3% of BC.
Under a Gartley methodology that accepts these leg relationships, D supplies the geometric completion point. The measurements do not establish that EUR/CHF will reverse. A subsequent candle reaction, structure shift, or continued decline would inform the separate trade hypothesis. Before any hypothetical position, the trader would also decide an exit condition and position size; neither defines whether point D was reached.
Common Mistakes With Forex Harmonic Patterns
Harmonic-pattern mistakes often happen when traders fall in love with the shape before validating the structure.
- Forcing ratios: The trader adjusts swing points until the chart matches the desired harmonic name.
- Acting before completion: the trader treats an XABC candidate as geometrically complete before D forms.
- Ignoring the PRZ reaction: The trader assumes price must reverse as soon as it touches the zone.
- Mixing pattern rules: Gartley, Bat, Butterfly, Crab, Shark, and other structures are treated as if they use the same ratio logic.
- Overtrusting scanners: A detected candidate is treated as a confirmed pattern.
- Ignoring higher-timeframe context: A small harmonic setup fights a stronger larger trend or major level.
- Overusing volume assumptions: Volume-style clues are treated as if spot forex had one centralized exchange volume figure.
- No invalidation: the trader considers an entry without an exit criterion or position-risk limit; this does not make an otherwise completed pattern geometrically incomplete.
Beginner Workflow for Harmonic Patterns
Use this checklist to separate identification from trade planning rather than treating every chart shape as an entry signal.
- Identify: Mark unforced swing points and choose the appropriate pattern family.
- Measure: Check the family’s required retracements and extensions, then locate the candidate PRZ.
- Complete: Wait for price to reach an eligible D area before calling the geometry complete.
- Evaluate: Observe subsequent price reaction alongside higher-timeframe structure, sessions, volatility, and news.
- Plan separately: If considering a trade, define entry evidence, exit condition, execution costs, and position risk.
- Review: Record whether any poor result arose from misidentification, a failed reversal idea, or trade execution.
A Safer Way to Read Harmonic Patterns in Forex
Harmonic patterns help traders organize Fibonacci-based price structures. They can be useful for studying possible reaction zones, but they are advanced patterns that require careful measurement and patience.
Sound harmonic identification starts with clear swing points, consistent ratio measurements, and a completed D area. Subsequent confirmation and an independently defined exit plan determine whether a completed pattern supports a particular trade.
Harmonic-pattern analysis becomes more useful when it is read with context. Session behavior, news, spread, slippage, volatility, timeframe alignment, pair behavior, position size, and account risk still matter.