
What Is a Reversal Pattern in Forex?
A forex reversal pattern is a chart structure that suggests an established upward or downward trend may be changing direction. It develops through price swings around identifiable levels, but a developing pattern is not evidence that a new trend is already established.
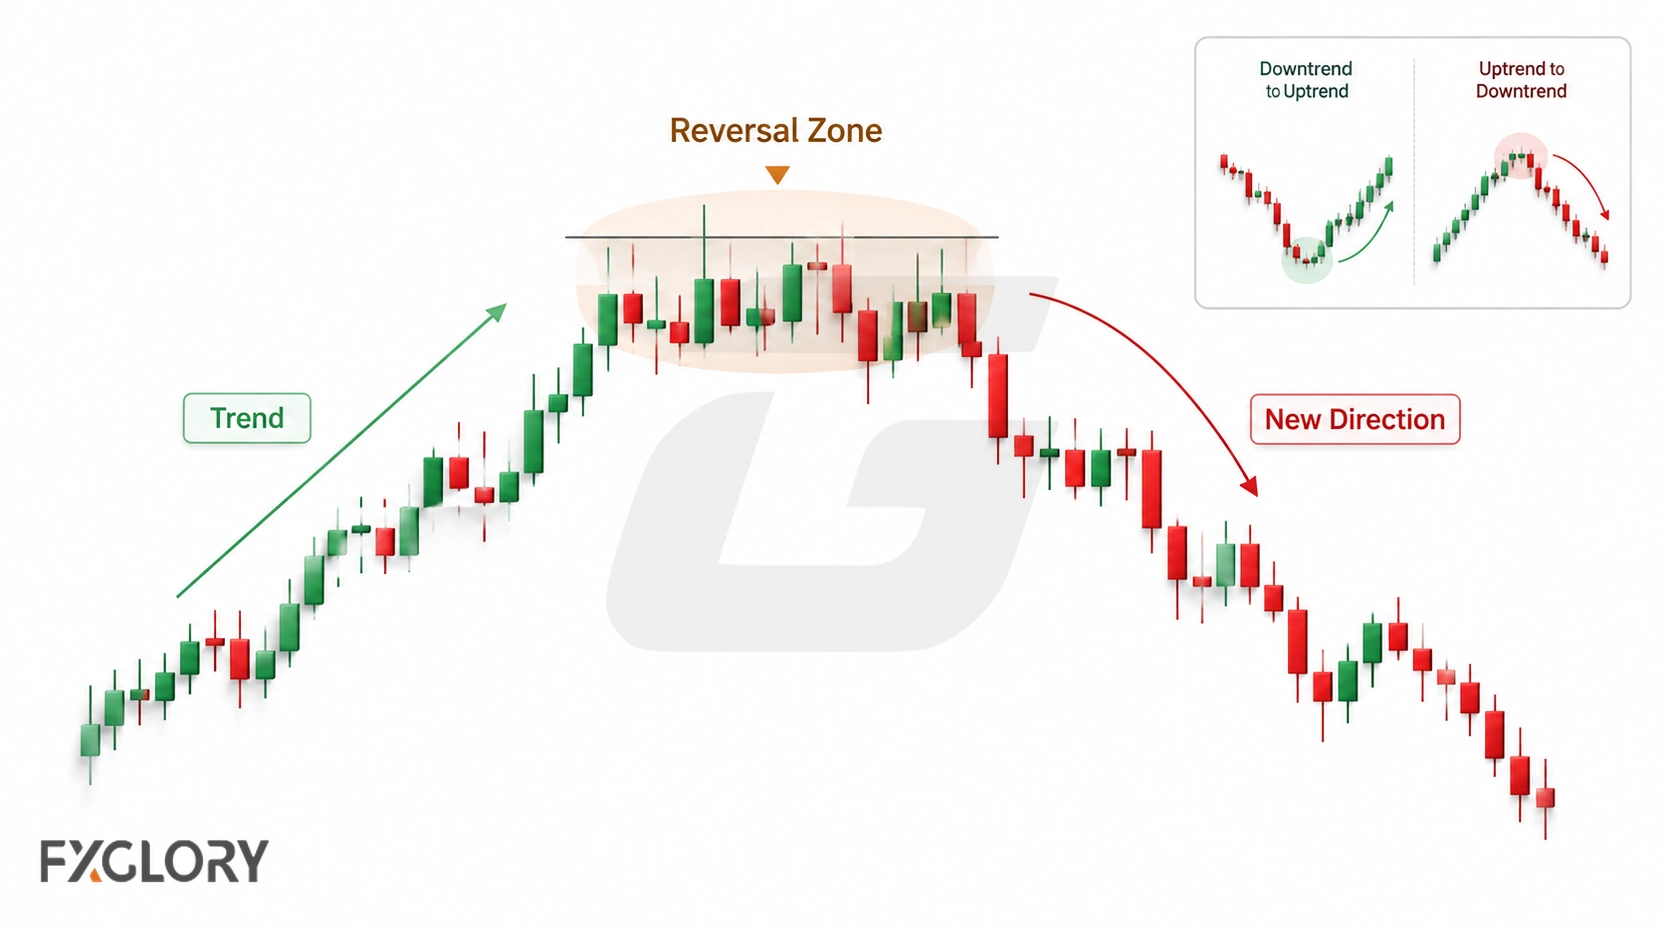
The relevant question is which price behavior would distinguish a potential turn from an ordinary correction. For a broader classification, see forex chart patterns.
How Forex Reversal Patterns Form
Following a directional move, price may stop extending its previous swings, test a familiar support or resistance area, and build a multi-swing formation. These are observable developments, not proof that buyers or sellers have lost control. A further structural change may then satisfy a particular pattern's confirmation rule.
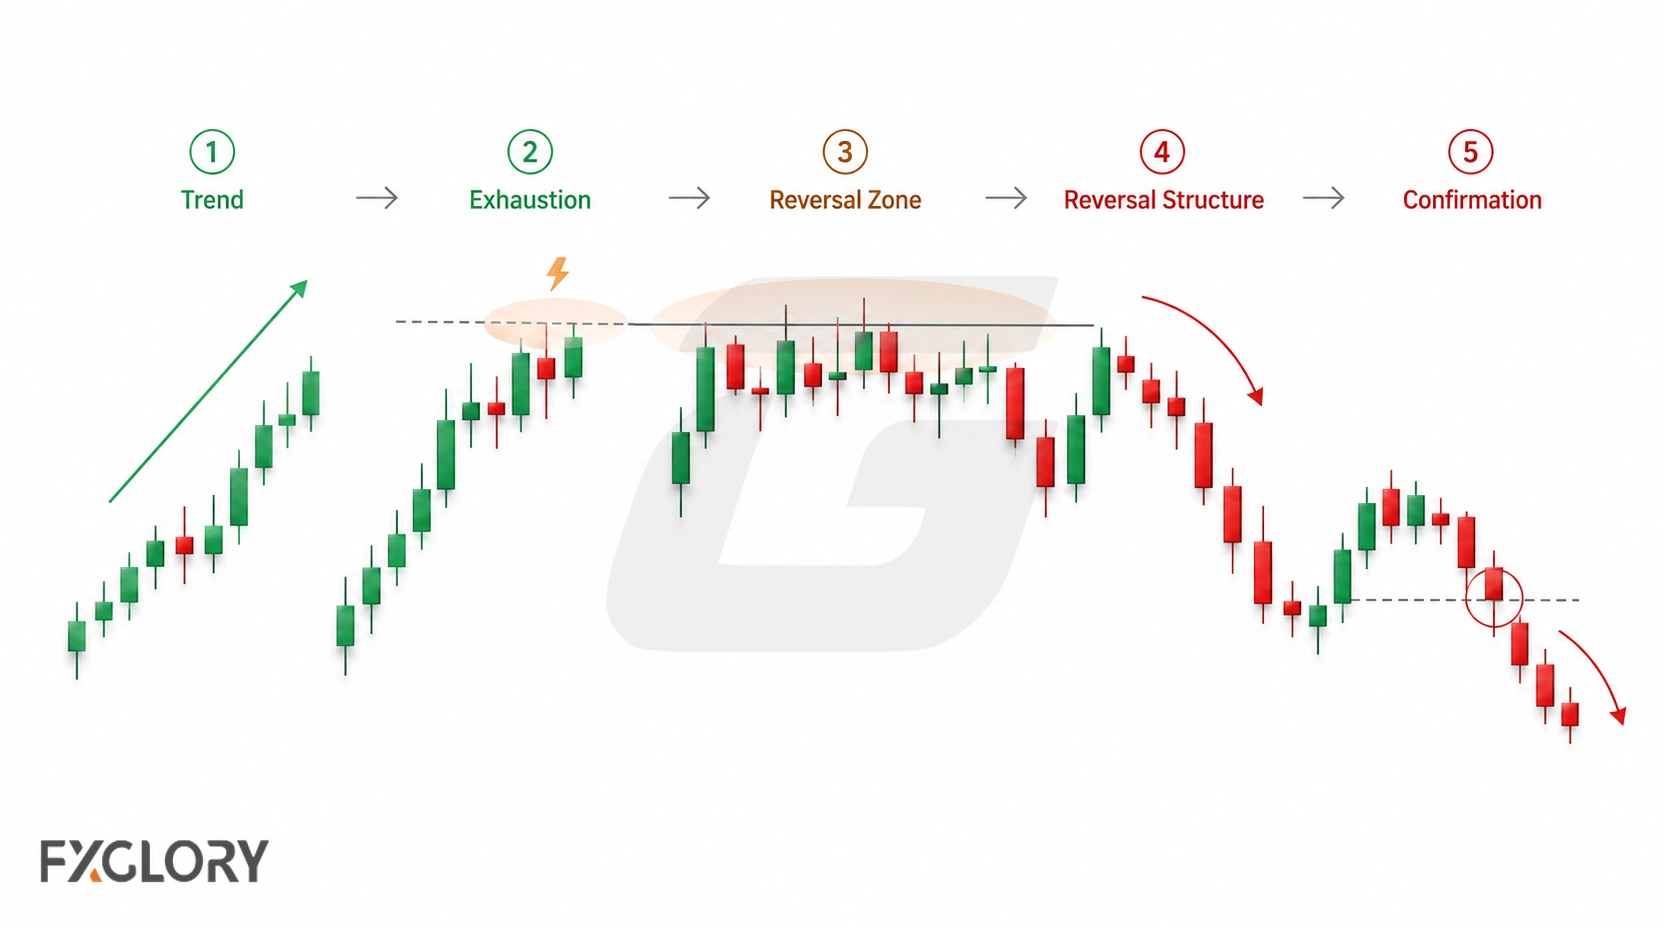
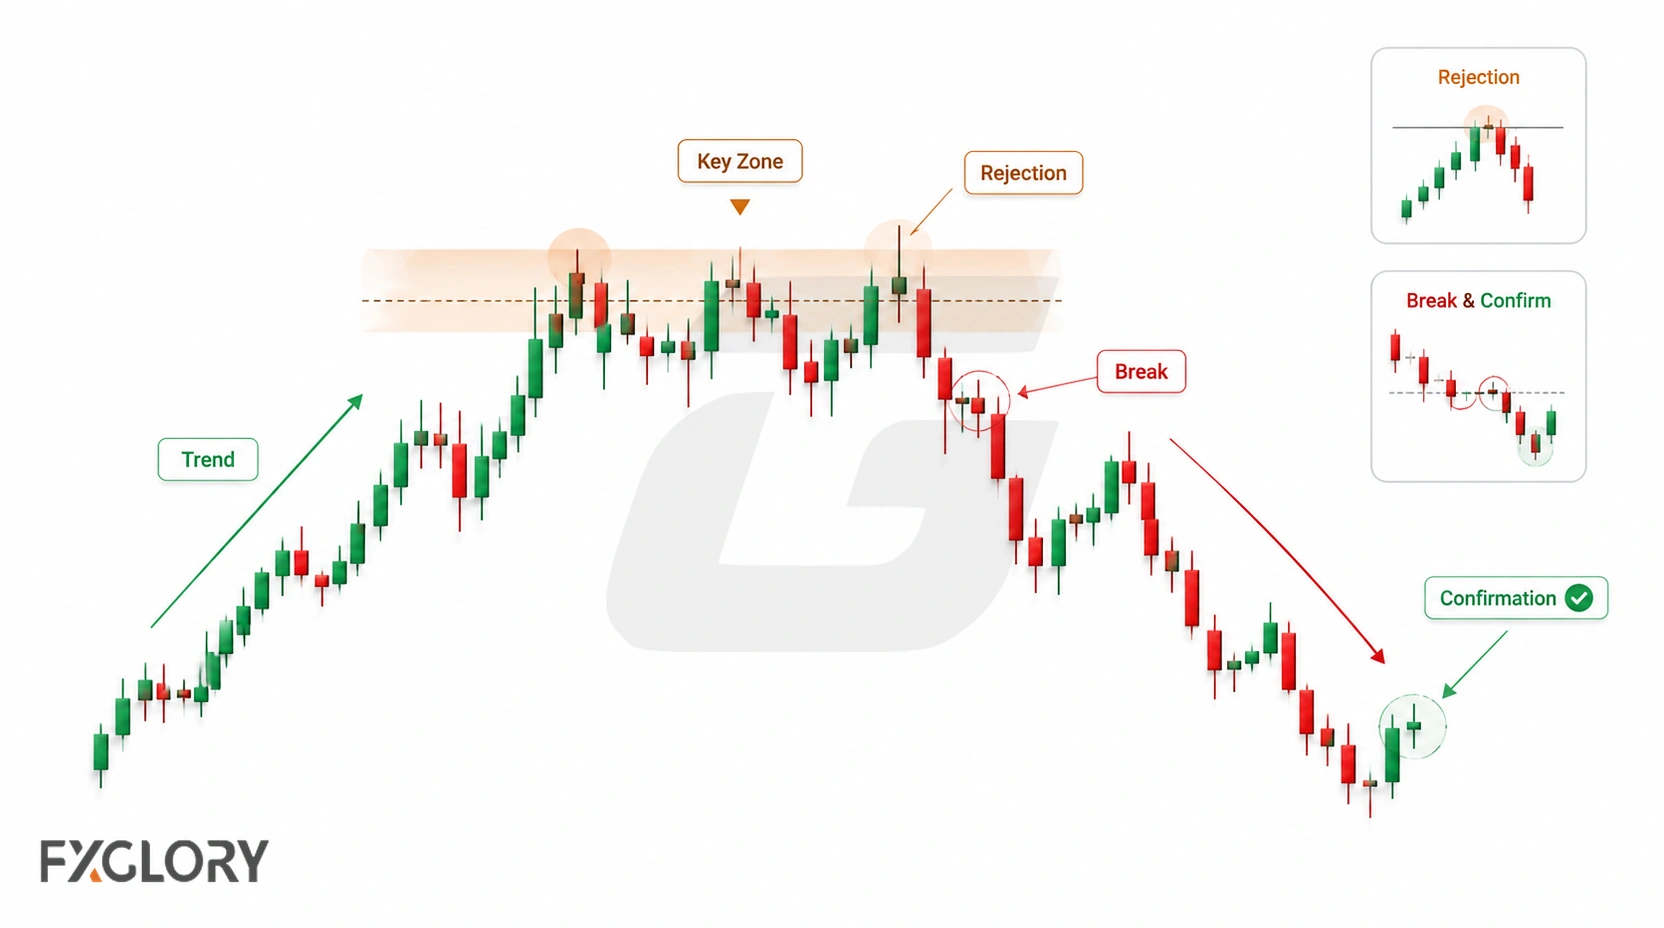
For example, after an uptrend, repeated highs near resistance may precede a break of intervening support. After a downtrend, repeated lows near support may precede a move through intervening resistance. If the previous directional move is absent, the same shape may be better described as a range.
Core Elements of a Reversal Candidate
| Element | Specific question |
|---|---|
| Prior trend | Which identifiable higher highs and higher lows, or lower highs and lower lows, preceded the setup? |
| Pattern boundary | Which neckline, swing level, support or resistance zone is relevant to this pattern? |
| Change in swings | Has price failed to extend the old trend, or broken a relevant swing point? |
| Confirmation rule | What precise break or close would confirm this particular pattern? |
| Directional invalidation | What subsequent price action would contradict the reversal thesis? |
These elements help describe an identifiable candidate; they do not establish the probability of a successful trade.
Bullish vs Bearish Reversal Patterns
A bullish reversal candidate follows a decline and points to a possible upward turn. A bearish candidate follows an advance and points to a possible downward turn. The important confirming boundary differs across specific structures.
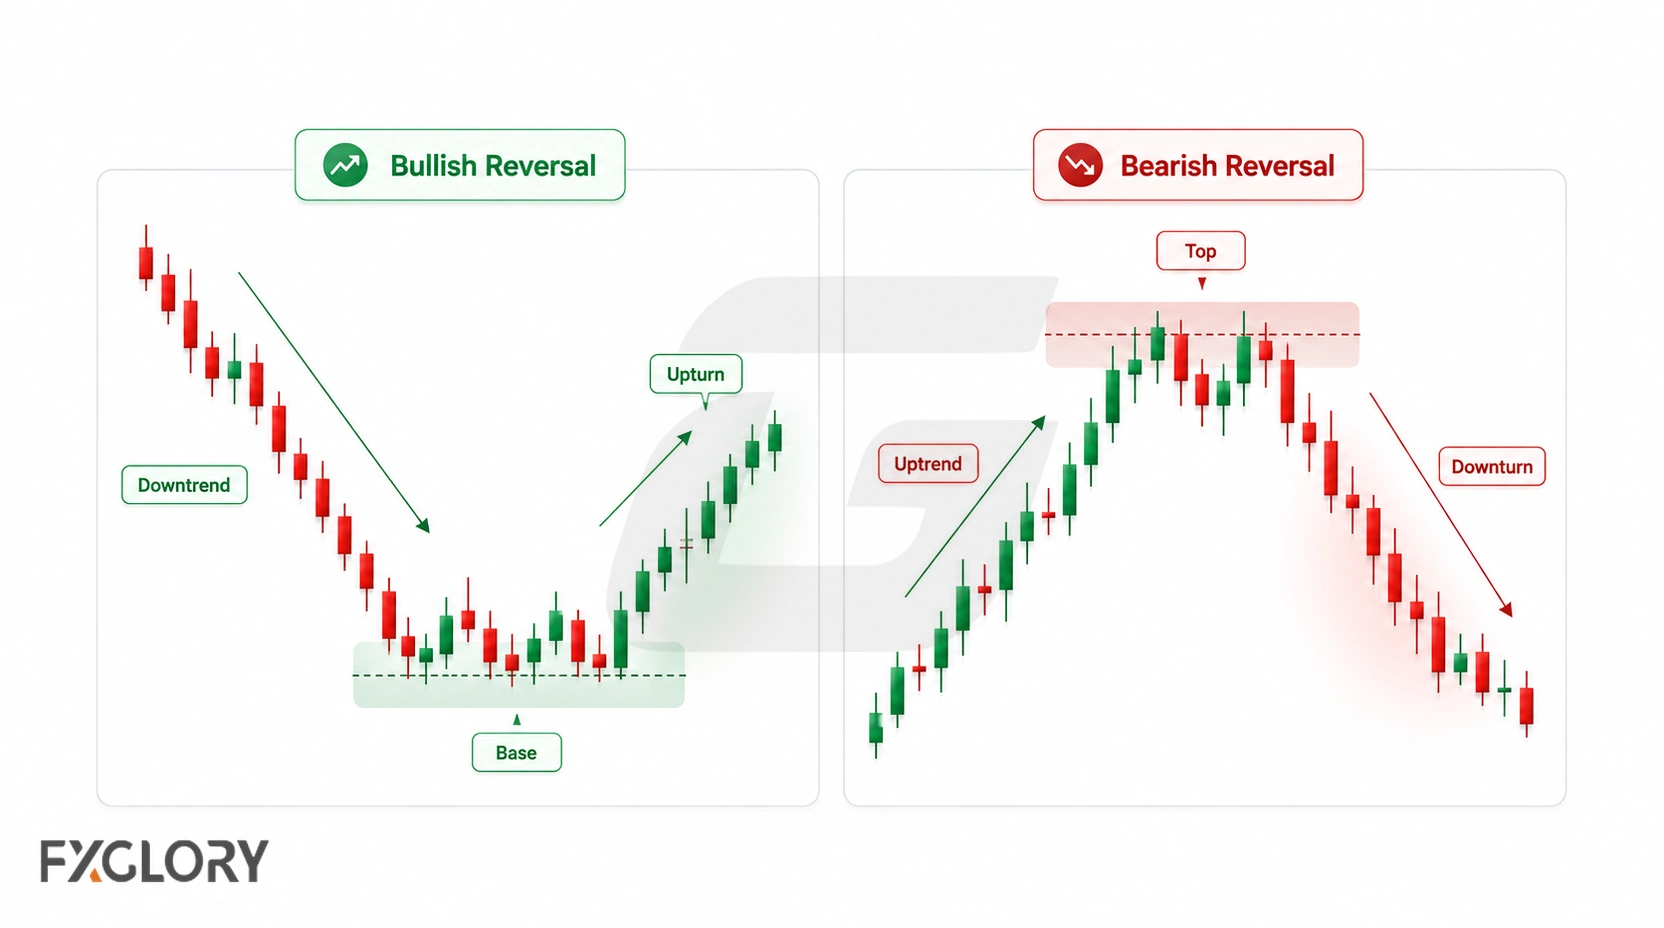
| Scenario | Prior structure | Example of relevant evidence |
|---|---|---|
| Bullish reversal | Lower highs and lower lows | Price breaks a specified neckline or prior lower high, then develops higher swing structure |
| Bearish reversal | Higher highs and higher lows | Price breaks a specified neckline or prior higher low, then develops lower swing structure |
| Range without prior trend | No sustained directional swing sequence | Boundary reactions alone do not establish a trend reversal |
A first break may confirm a particular chart pattern without establishing a new trend on the broader timeframe.
Reversal vs Retracement in Forex
A retracement moves against the prevailing trend while its defining swing structure may remain intact. A potential reversal challenges that structure. Whether the change is meaningful depends on which timeframe and swing points are used.
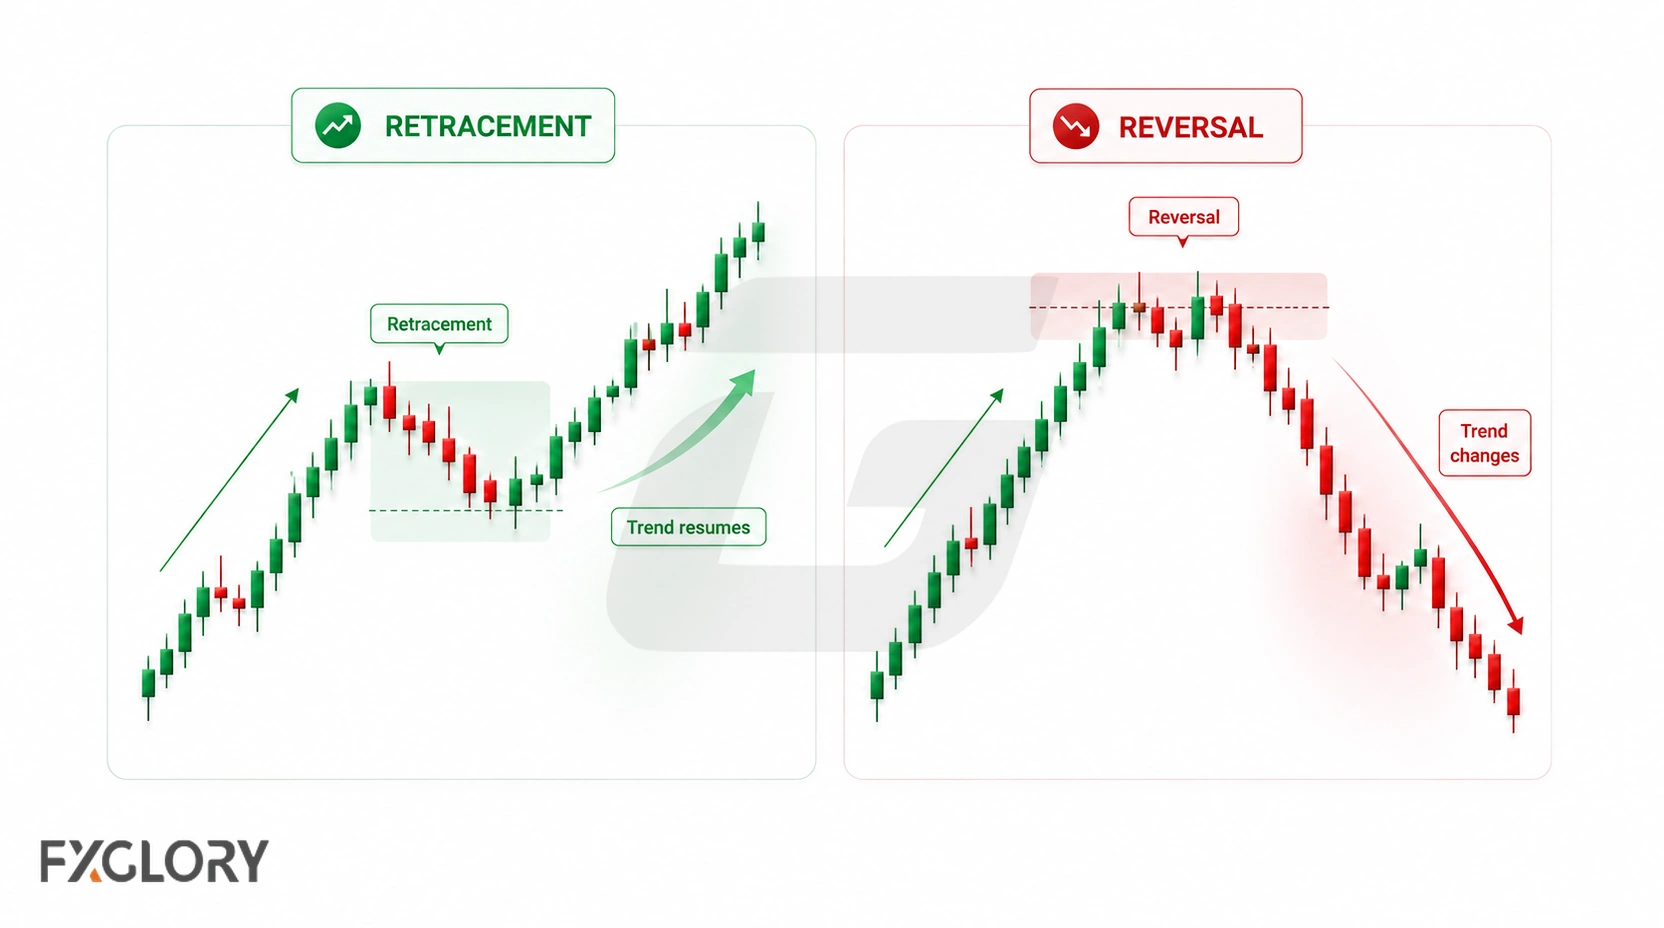
| Question | Retracement reading | Potential reversal reading |
|---|---|---|
| Uptrend example | A pullback holds above the relevant higher low | Price breaks below that higher low under the chosen rule |
| Downtrend example | A recovery stays below the relevant lower high | Price breaks above that lower high under the chosen rule |
| Later behavior | Price resumes the previous sequence of swings | Price begins forming swings in the opposite direction |
| Interpretation | The established trend need not have changed | The reversal thesis gains evidence but may still fail |
The relevant higher low or lower high must be selected before evaluating the outcome; an arbitrary minor swing does not invalidate an entire trend. For a deeper explanation, see forex retracements.
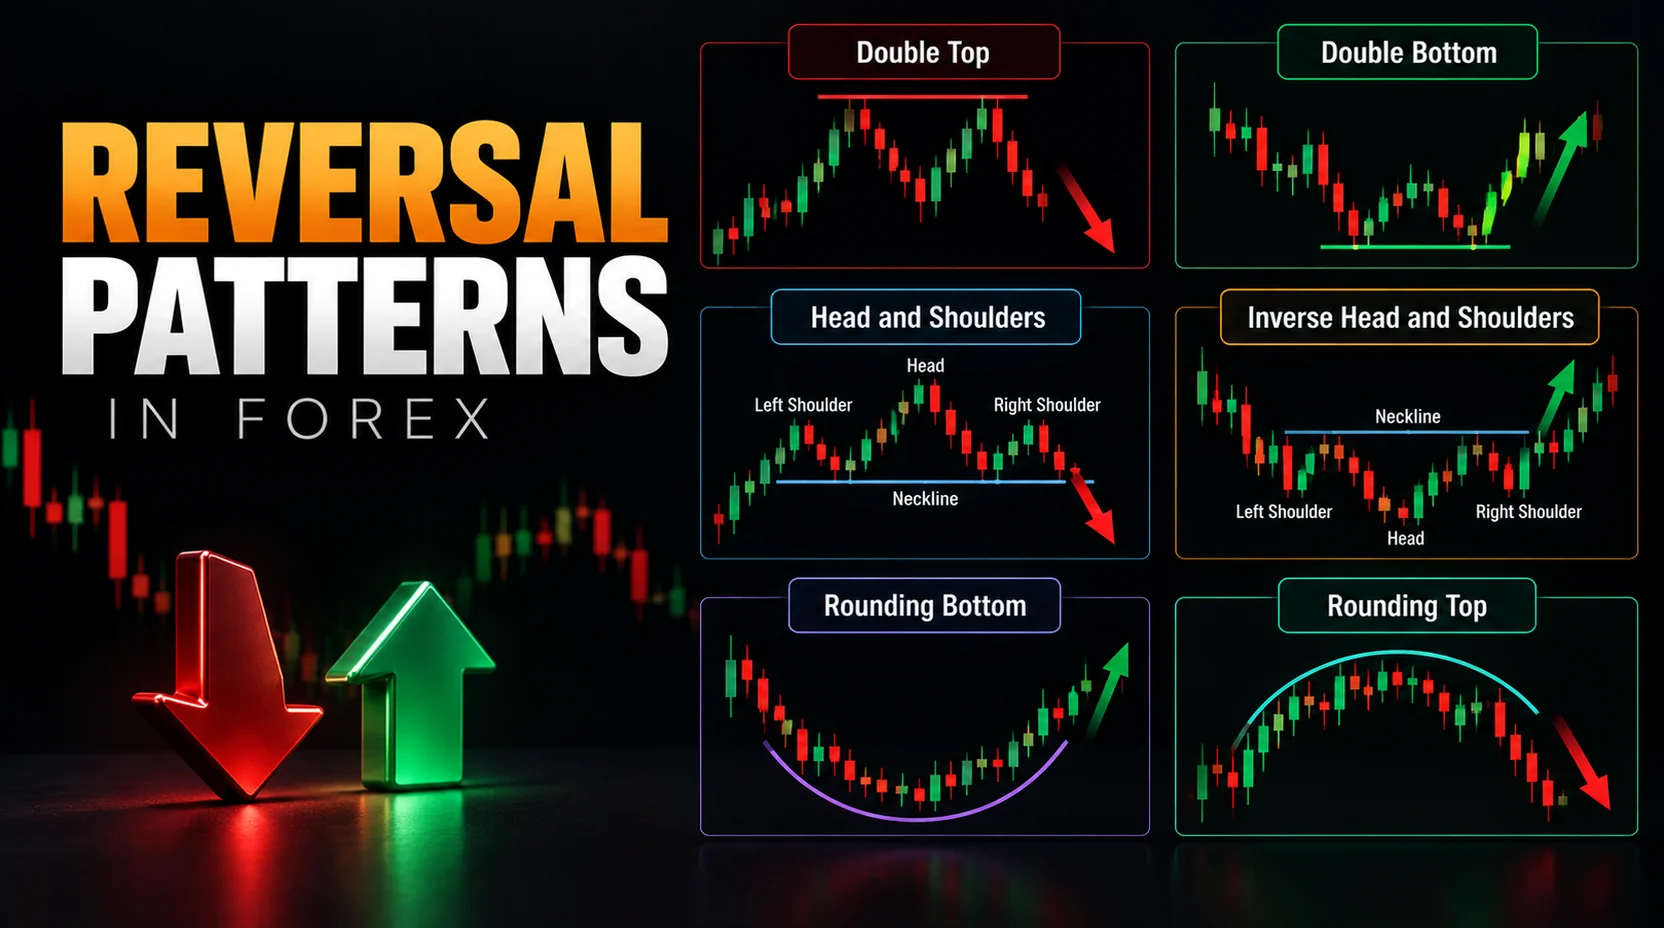
Common Forex Reversal Patterns
Different formations offer different ways to identify a potential turn. This overview emphasizes what distinguishes them; the dedicated guides cover detailed formation and trading rules.
| Pattern | Typical chart structure | Guide |
|---|---|---|
| Double top | Two tests near resistance after an advance; intervening support matters | Double top |
| W pattern / double bottom | Two tests near support after a decline; intervening resistance matters | W pattern |
| Head and shoulders | Three upper swings, with a higher middle high, above a neckline | Head and shoulders |
| Inverse head and shoulders | Three lower swings, with a lower middle low, below a neckline | Inverse structure |
| Triple top / bottom | Three tests of a similar resistance or support zone | Triple top pattern |
| Wedge | Converging, sloping boundaries, sometimes after a sustained trend | Wedge pattern |
Less common labels, such as diamond or Quasimodo patterns, need clearly specified swing rules before they can be compared meaningfully. For a broader visual reference, see the chart-pattern cheat sheet.
How to Judge Reversal-Pattern Quality
Assess whether a candidate is recognizable before judging whether it has confirmed or whether a trade is attractive.
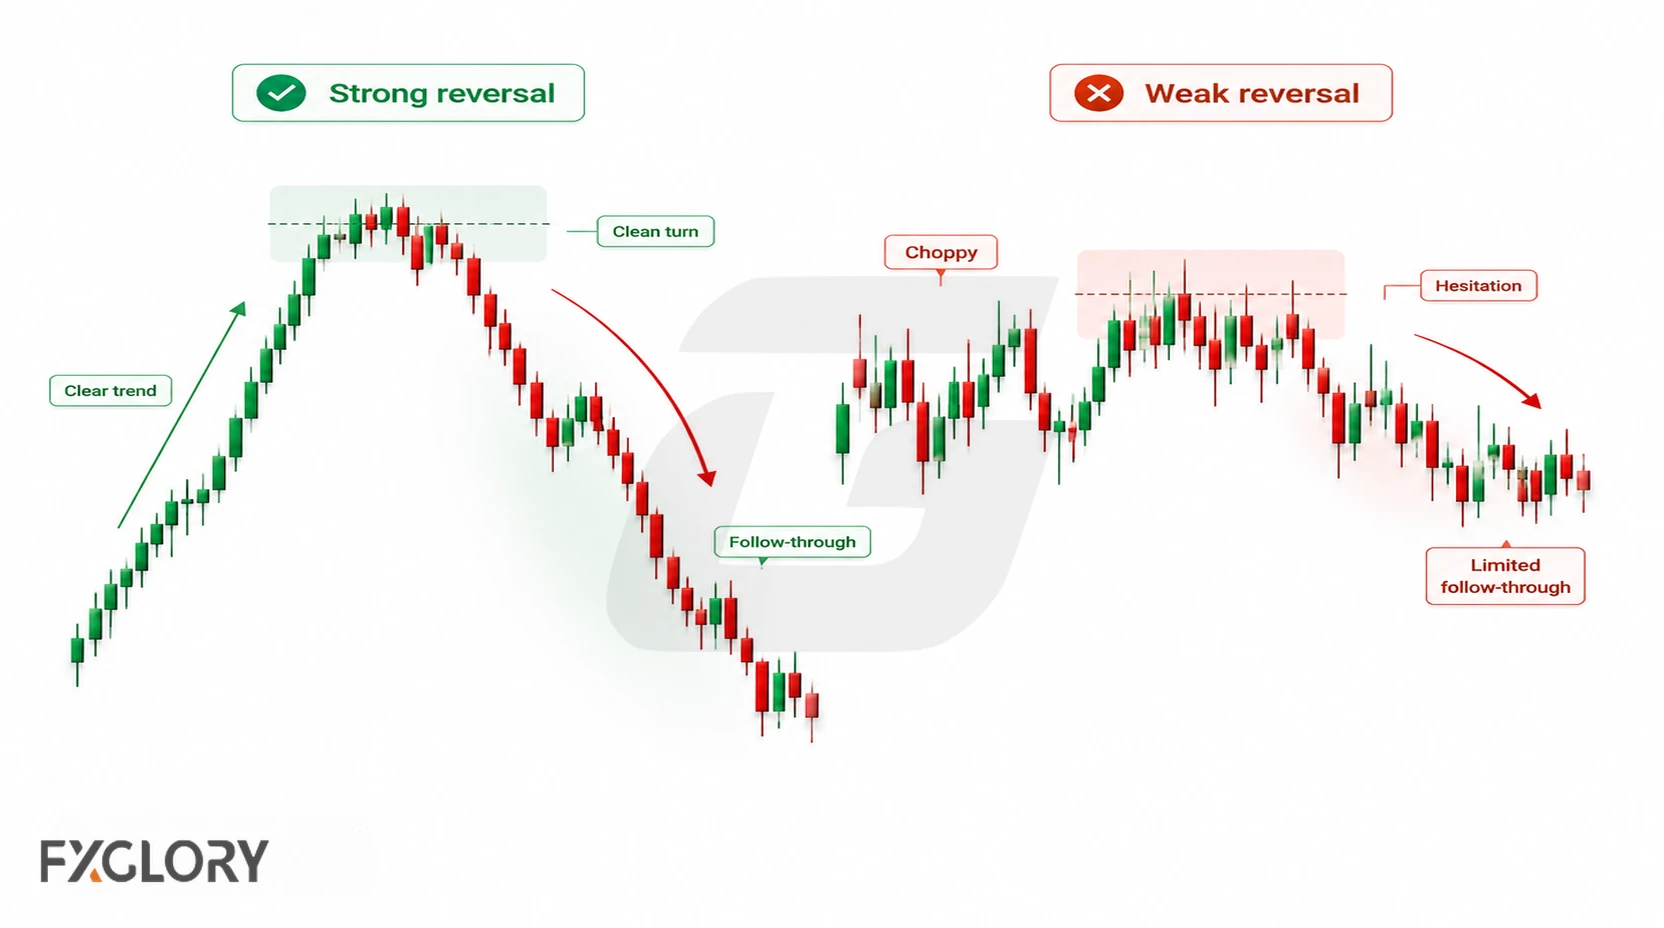
| Feature | Readable candidate | Questionable candidate |
|---|---|---|
| Earlier movement | An identifiable directional sequence precedes the pattern | Price was already moving sideways |
| Boundaries | Relevant swing levels can be marked consistently | Lines are repeatedly redrawn to fit the label |
| Swings | Separate peaks or troughs form the proposed structure | Isolated wicks or unrelated moves are grouped together |
| Location | The formation has a clear relationship to prior support or resistance | The claimed turning zone has no identifiable chart basis |
Clear geometry does not guarantee a successful reversal. Confirmation, timeframe context and execution risk are separate evaluations.
How to Confirm a Forex Reversal Pattern
Confirmation is pattern-specific. A double-top method commonly watches for a downside break of intervening support; an inverse head-and-shoulders method watches for an upside neckline break. A candlestick rejection alone may be an early clue rather than confirmation of a multi-swing chart pattern.
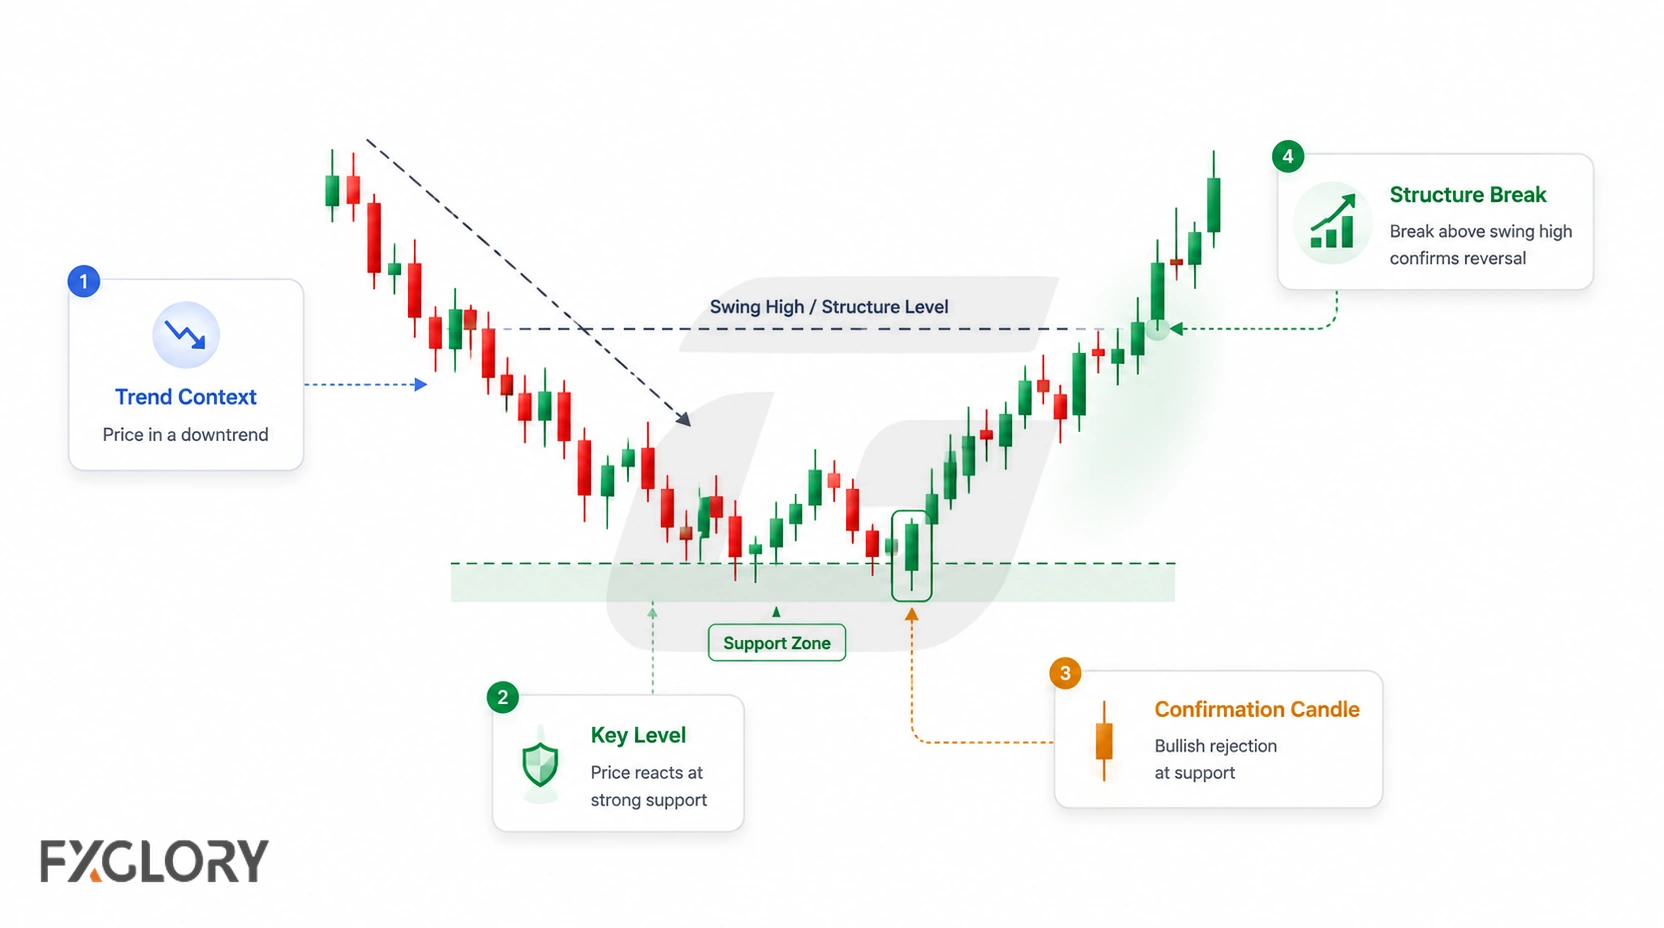
- Identify the existing trend: Mark the relevant swing sequence and analysis timeframe.
- Select a recognizable pattern: Note its support, resistance or neckline without altering levels retrospectively.
- State the trigger: Decide whether an intrabar break or candle close beyond the chosen boundary is required.
- Evaluate the actual break: Check whether price satisfies that rule; a later retest cannot replace a required initial break.
- Observe subsequent structure: Follow-through or opposite-direction swing formation may add evidence, while a return inside may weaken the thesis.
- State invalidation and account risk: Separate the structural wrong point from entry price, stop placement, position size and trading costs.
Meeting a chart-pattern confirmation rule does not prove that a sustained new trend has begun. A strict closing-price rule can reduce some intrabar signals but can also recognize a move later.
Unconfirmed, Failed and Invalidated Reversals
| Observed behavior | Appropriate description |
|---|---|
| Pattern forms, but its required neckline or structural level never breaks | Unconfirmed candidate |
| Boundary break meets the chosen rule, then price reclaims the broken level and holds | Possible failed confirmation |
| Price sustains a move beyond the level designated to cancel the directional thesis | Invalidated reversal thesis under that rule |
| Price moves sideways without a new swing sequence | Unresolved consolidation, not necessarily invalidation |
| Market news raises volatility or a higher-timeframe level lies nearby | Context or trading risk, not an automatic structural failure |
The price level that invalidates a specific trade setup may differ from the structural level that negates a broader reversal interpretation. Pattern-height projections, where used, are scenario measurements rather than guaranteed targets.
Forex Context: Sessions, News and Trading Costs
A lower-timeframe reversal can be a temporary countertrend move within a larger trend. Check nearby higher-timeframe swing points and scheduled announcements before interpreting a structural break. Fast market conditions can widen spreads or create slippage, changing actual fills even if a chart level is crossed.
Spot forex has no single centralized exchange-wide transaction-volume figure. A broker's tick activity reflects updates in its feed rather than total market turnover; consult the tick-volume guide for detail.
Indicators and Candles as Supporting Evidence
Momentum indicators can show divergence, trend indicators can describe an existing trend, and volatility tools can measure the size of movement. None independently establishes a chart reversal. An overbought or oversold reading may persist while the trend continues.
For specialist explanations, see MACD, RSI and reversal candlesticks. The last describe shorter formations than multi-swing chart patterns.
Hypothetical GBP/USD Reversal vs Pullback
Imagine GBP/USD advancing with a visible swing high at 1.3400 and a relevant higher low at 1.3320. These are illustrative prices, not observed market data. A dip to 1.3340 that holds above 1.3320 may still be a retracement within the uptrend.
Suppose a later candle closes below 1.3320 under a predefined close-based structural-break rule. That indicates damage to the selected uptrend structure and supports a bearish reversal candidate; it does not by itself prove a new downtrend. A subsequent lower high and lower low would add evidence. Conversely, a sustained recovery above 1.3400 would contradict a bearish thesis using that high as its invalidation level. Continued movement between the levels remains unresolved.
The appropriate level and stop for any actual setup depend on the specific trading method, not merely on these illustrative numbers.
Common Reversal-Pattern Mistakes
- Moving the confirmation threshold after the fact: Switching between wick and close-based rules retrospectively makes results impossible to assess consistently.
- Calling a broken minor swing a full trend change: Structural significance depends on the selected timeframe and swing level.
- Confusing a chart signal with a fill: Spread and slippage can make execution differ from the marked price.
- Using a measured projection as a forecast: Geometric targets do not establish reversal probabilities or live performance.
Reversal Patterns in Forex: Conclusion
Reversal structures help distinguish a candidate turning formation from a confirmed pattern and, later, a developing opposite trend. Define each stage through observable price levels and keep confirmation, invalidation and execution risk separate.