
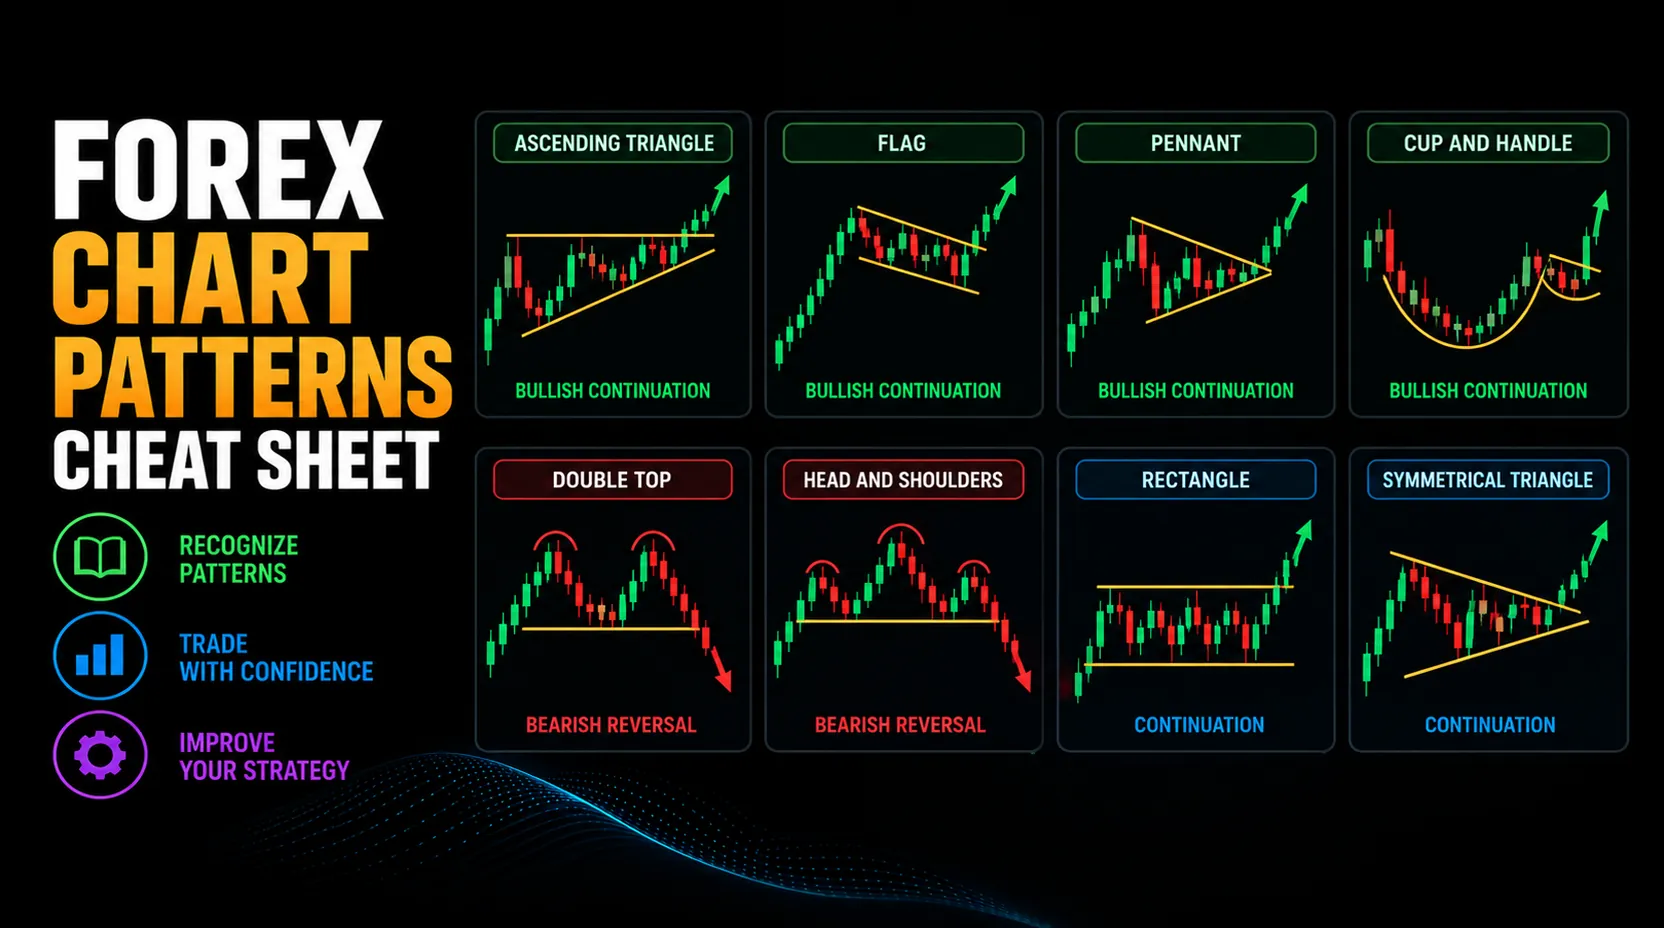
What Is a Forex Chart Patterns Cheat Sheet?
A forex chart patterns cheat sheet is a quick reference for comparing common price structures on currency-pair charts. It helps traders recognize whether a pattern may belong to a reversal, continuation, neutral, or ratio-based group.
The cheat sheet is useful because real-time charts can become crowded. A reference table keeps the main questions visible: What type of pattern is forming? What market condition came before it? Where is the boundary? What would confirm the idea? Where would the idea fail?
A cheat sheet helps identify chart structures; later price behavior determines whether a breakout or reversal scenario gains support. Trade exits require separate planning. For the broader framework behind pattern reading, start with the main forex chart-pattern guide.
How to Use This Forex Patterns Cheat Sheet
Start with the market condition before looking for a pattern name. A clear structure in the wrong context can be less useful than a simple level that price keeps respecting.
- Choose the pair and timeframe: Avoid jumping between charts until the current structure is understood.
- Read the market condition: Decide whether price is trending, ranging, compressing, or unclear.
- Find the boundary: Mark the visible support, resistance, neckline, trendline, or range edge.
- Use the cheat sheet: Compare the structure with the pattern group that fits best.
- Check confirmation: Look for breakout, rejection, retest, close behavior, or supporting context.
- Separate scenarios: Distinguish a recognizable structure from the breakout or reversal behavior you would need before considering a trade.
- Check trading conditions: Consider spread, slippage, news, volatility, and account risk.
The pattern name should come after the structure is visible. If the chart needs too much imagination, the better reading may be no pattern.
Fast Forex Pattern Map
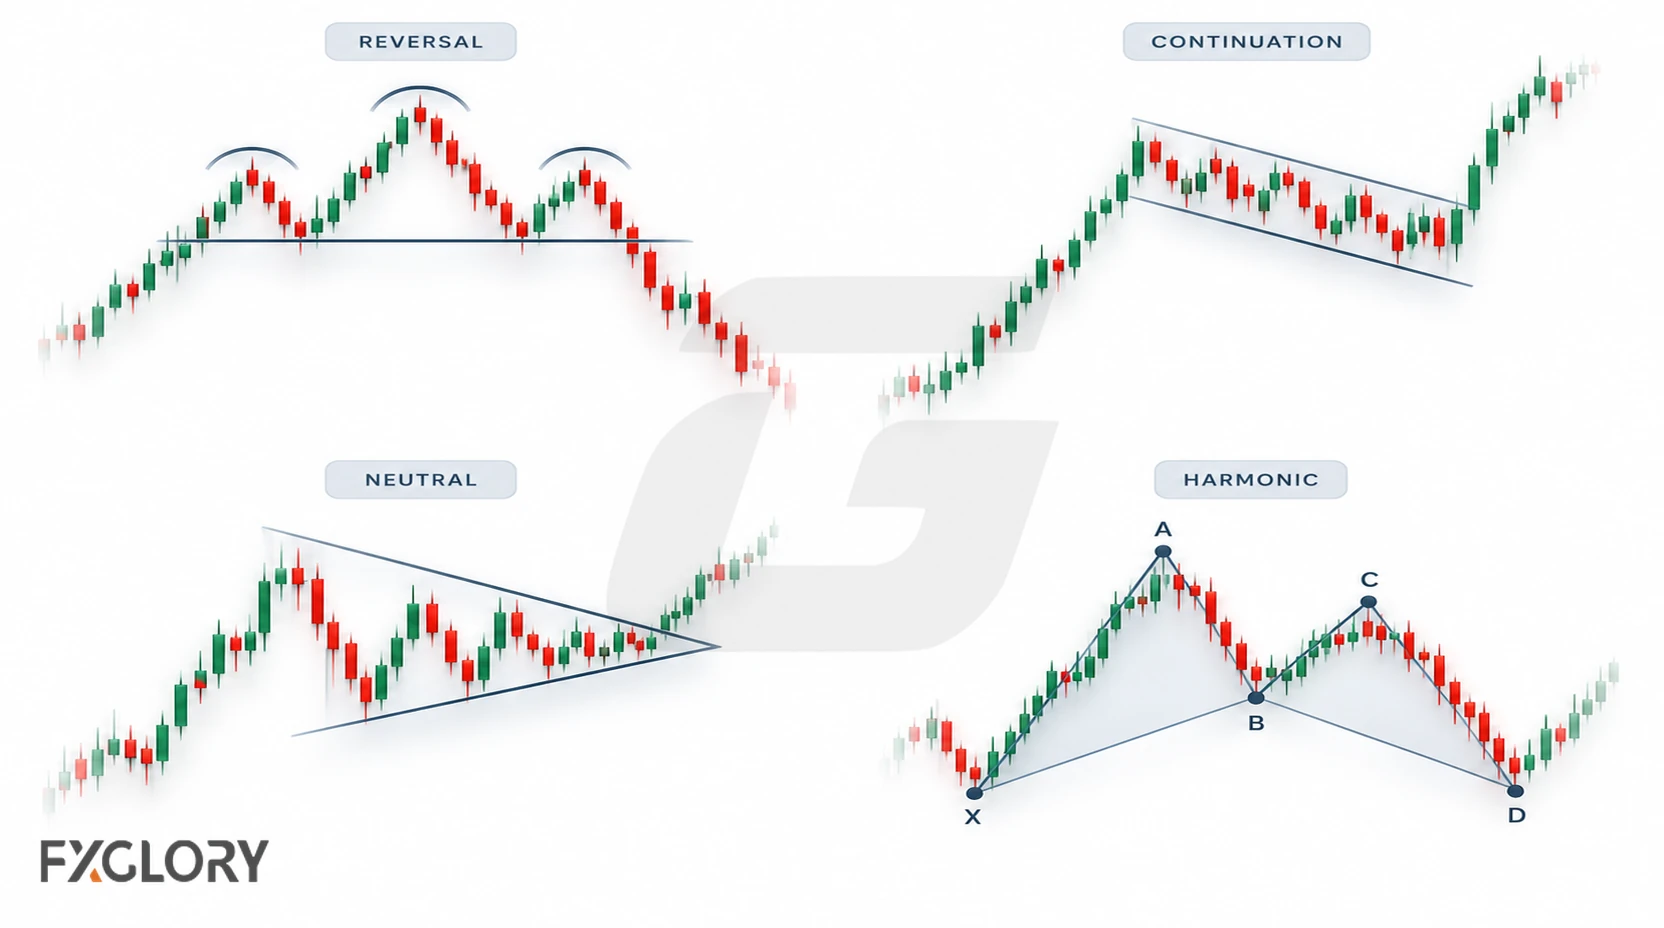
Use the quick map below as a fast reference before the larger table.
| Group | Fast Clue | Common Examples | Do Not Assume |
|---|---|---|---|
| Reversal | A prior move may be weakening | Double top, W pattern, head and shoulders | That the trend has already changed |
| Continuation | A trend may be pausing | Pennant, flag, rectangle, channel | That the next move must follow the trend |
| Neutral | Price is compressing or undecided | Symmetrical triangle, consolidation | That the breakout direction is known early |
| Harmonic | Swings are measured by ratios | Harmonic patterns, butterfly pattern | That unclear swing points are reliable |
Forex Chart Patterns Cheat Sheet
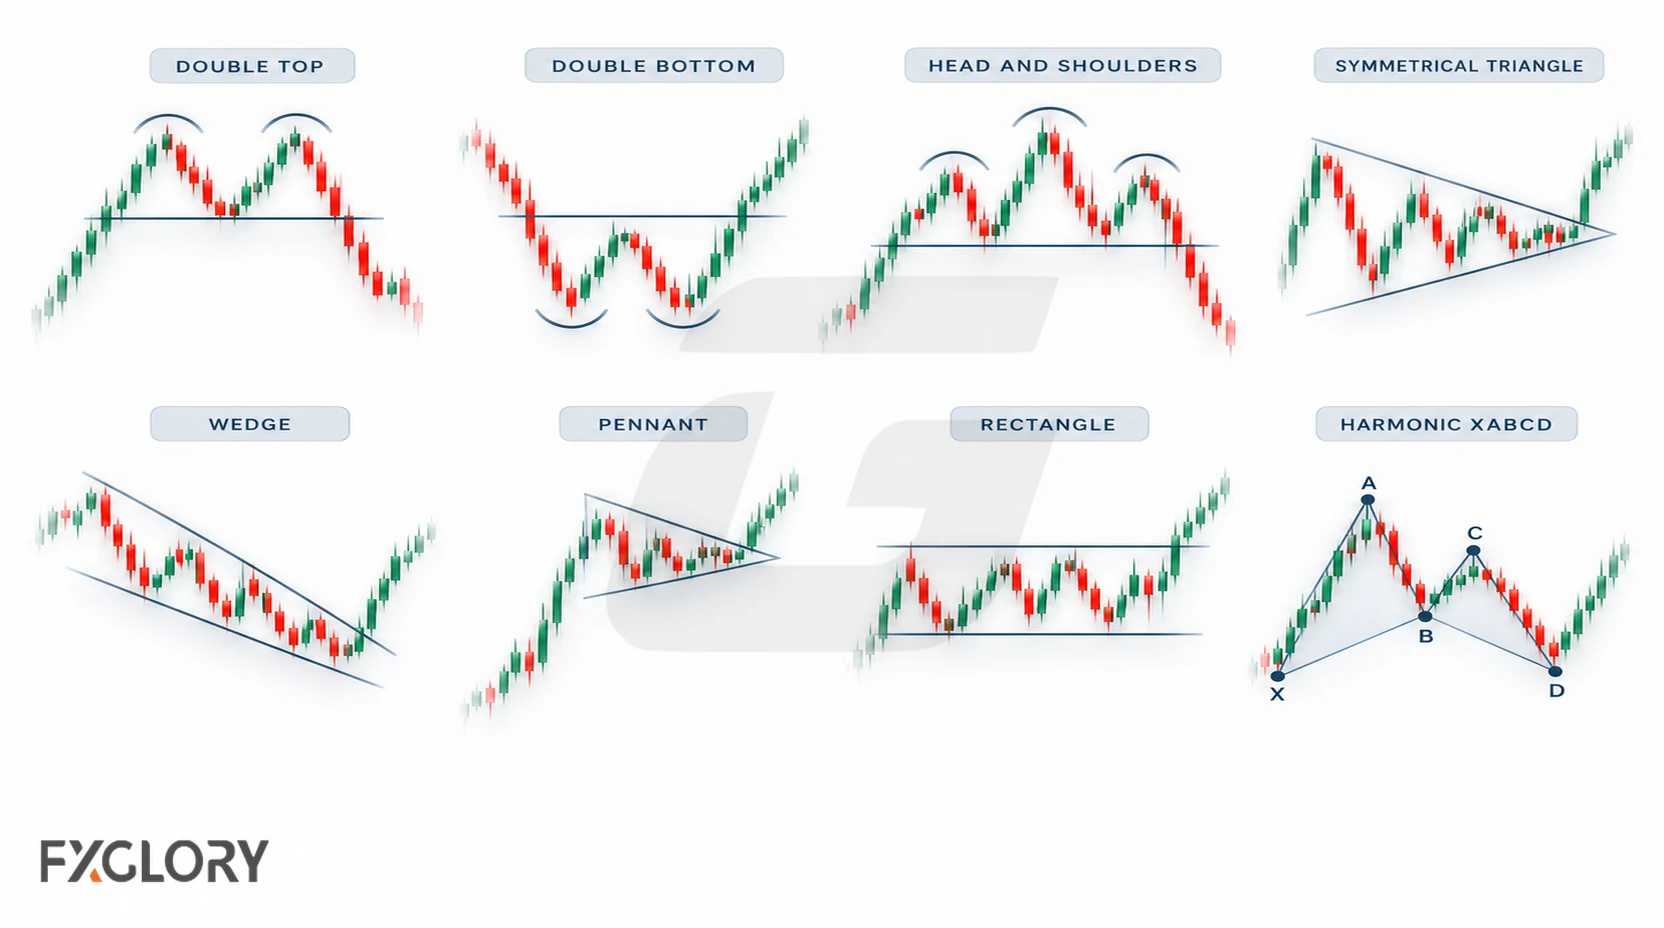
The table below separates observable pattern characteristics from the price behavior that could support or weaken a proposed breakout or reversal. Failure clues refer to scenarios, not necessarily to whether the original shape existed.
| Pattern | Type | Context | Check | Failure Clue |
|---|---|---|---|---|
| Double top | Reversal | After a prior rise | A downside neckline break supports the bearish scenario | After a downside break, price sustains a recovery above the neckline; a move above the tops challenges the bearish structure |
| W pattern / double bottom | Reversal | After a prior decline | An upside neckline break supports the bullish scenario | After an upside break, price sustains a move below the neckline; a move below the lows challenges the bullish structure |
| Head and shoulders | Reversal | After a prior upward move | A downside neckline break supports the bearish scenario | After a downside break, price reclaims the neckline and holds above it; a brief retest alone need not mean failure |
| Inverse head and shoulders | Reversal | After a prior downward move | An upside neckline break supports the bullish scenario | After an upside break, price falls back below the neckline and holds there |
| Rising wedge | Reversal or continuation | Inside or after upward movement | Watch for a break of the relevant boundary, often the lower edge in a bearish reading | A proposed downside break fails and price sustains a recovery inside or above the wedge |
| Falling wedge | Reversal or continuation | Inside or after downward movement | Watch for a break of the relevant boundary, often the upper edge in a bullish reading | A proposed upside break fails and price sustains a return inside or below the wedge |
| Symmetrical triangle | Neutral or continuation | Compression after movement or in a range | Watch which converging boundary breaks, then assess follow-through | A breakout loses its holding condition and price sustains a return inside |
| Ascending triangle | Neutral or continuation | Flat upper area with rising lows | An upside resistance break supports a bullish case; direction is not guaranteed | A proposed upside breakout fails; a lower-boundary break can favor a different scenario |
| Descending triangle | Neutral or continuation | Flat lower area with falling highs | A downside support break supports a bearish case; direction is not guaranteed | A proposed downside breakout fails; an upper-boundary break can favor a different scenario |
| Pennant | Continuation | After a sharp directional move | A break in the prior move’s direction provides initial continuation evidence | Price breaks the opposite way or a continuation breakout fails to hold |
| Flag | Continuation | After a sharp directional move | A break in the flagpole direction provides initial continuation evidence | Price breaks the opposite side or a continuation breakout fails to hold |
| Rectangle | Continuation or range | Sideways movement between levels | Watch the breakout direction and whether price holds beyond the range | A proposed range breakout fails and price sustains a return inside |
| Harmonic patterns | Ratio-based | Measured swing structure | Validate pattern-specific ratios and completion near the projected D area; reaction is subsequent evidence | Ratios do not fit the named structure, or the anticipated reversal at D fails |
| Butterfly pattern | Harmonic | Extended measured swing structure | Check Butterfly-specific ratios and whether price reaches the projected D area | Measurements do not fit the Butterfly, or a completed pattern fails to reverse |
Reversal Pattern Cheat Sheet
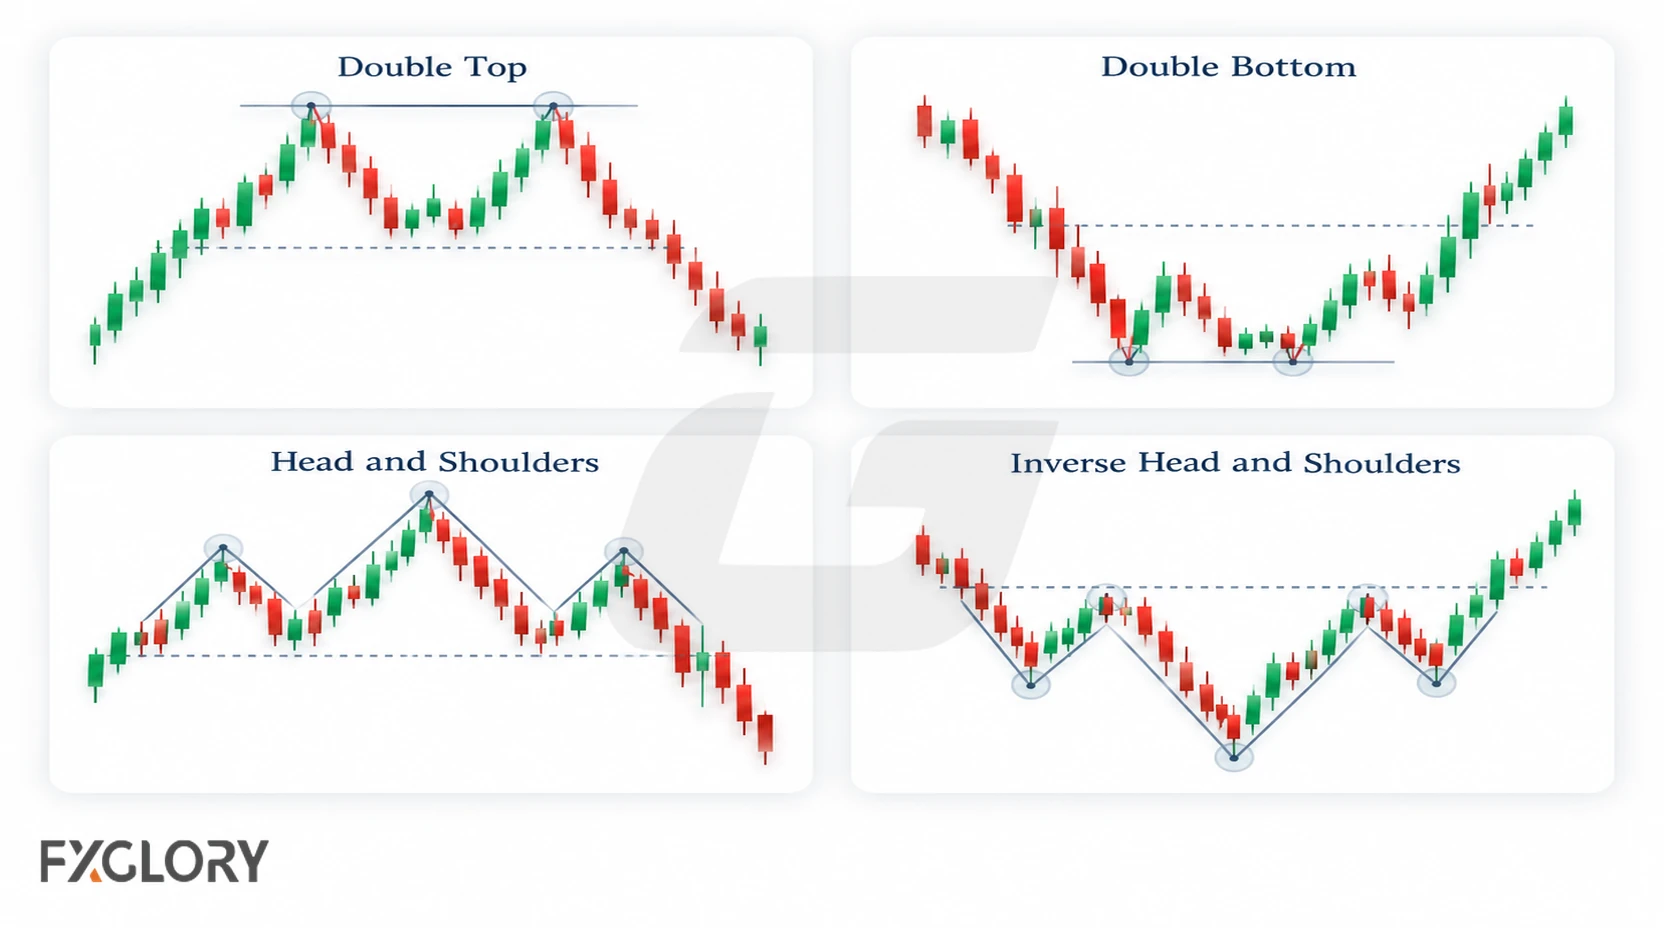
Reversal patterns may suggest that a prior move is losing strength. A clear prior move and observable neckline or boundary help distinguish a possible reversal from an ordinary range.
| Structure | Quick Clue | Next Check |
|---|---|---|
| Double top | Two reactions near a similar high | Middle support behavior |
| W pattern / double bottom | Two reactions near a similar low | Middle resistance behavior |
| Head and shoulders | Three swings around a neckline | Neckline behavior |
| Inverse head and shoulders | Three swings after a decline | Whether price holds above the neckline |
When the chart question is mainly about failed continuation after a prior move, use the reversal-pattern framework. For specific structures, compare the second test of resistance, the W-shaped support reaction, and the neckline-based swing structure.
Continuation Pattern Cheat Sheet
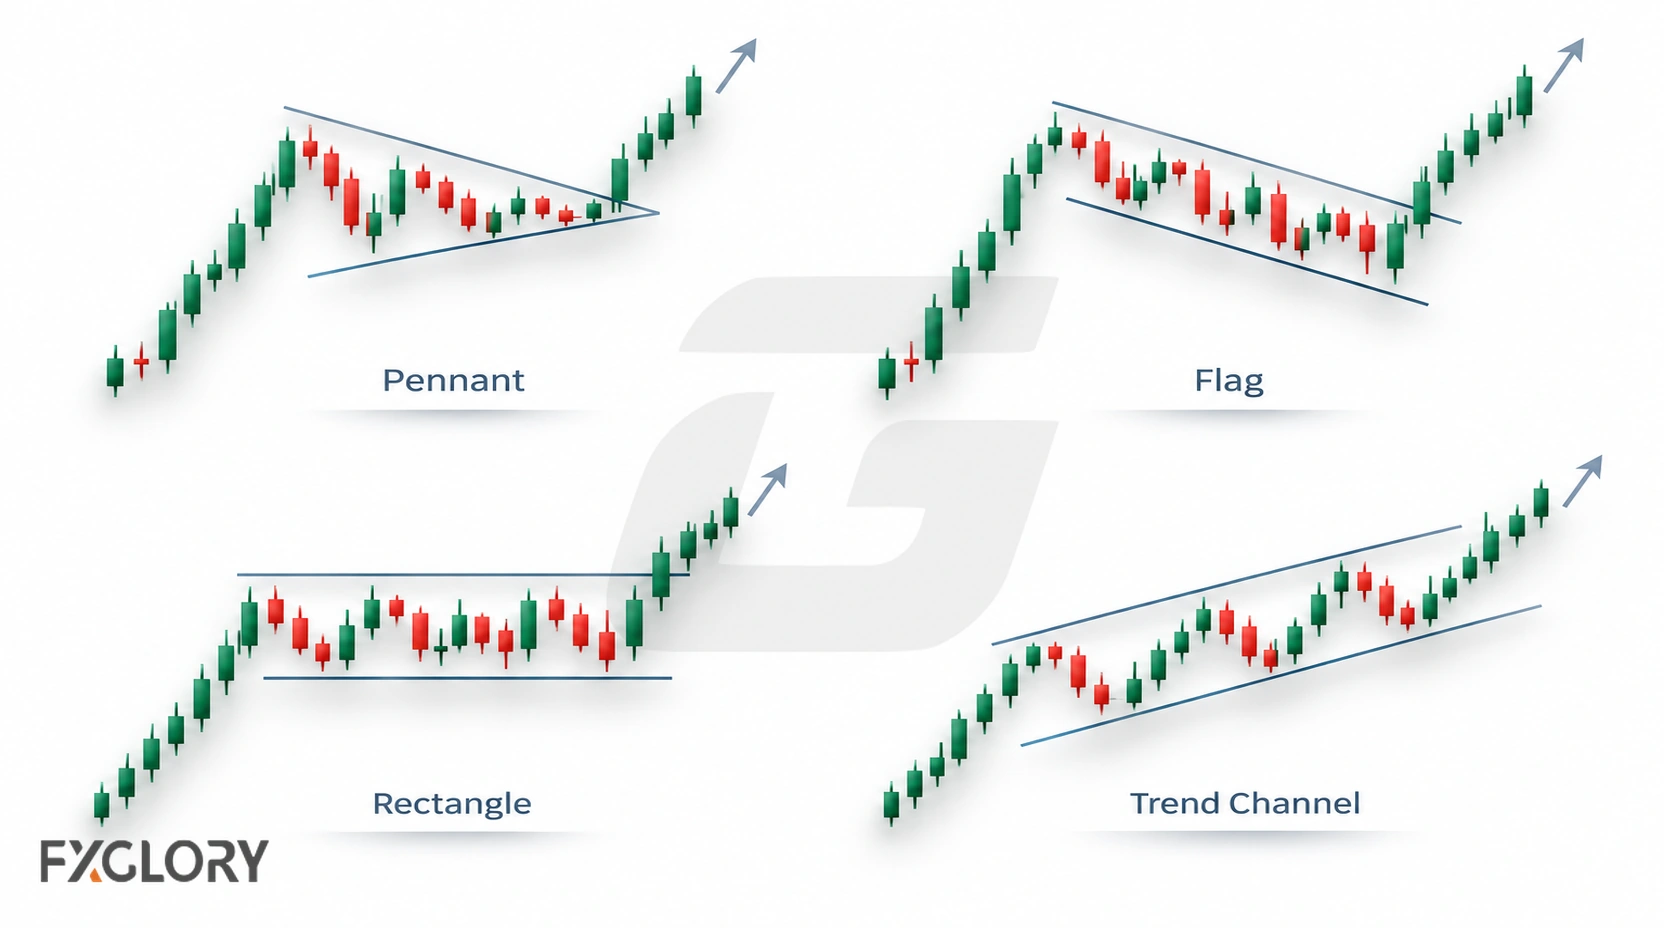
Continuation patterns may describe a pause inside a broader trend. The important question is whether the pause is orderly enough to keep the original trend scenario alive.
| Structure | Quick Clue | Next Check |
|---|---|---|
| Pennant | Small compression after a sharp move | Break from compression in trend context |
| Flag | Short channel-like pause after a sharp move | Whether the channel break supports continuation |
| Rectangle | Sideways pause between repeated levels | Whether price breaks and holds beyond the range |
| Trend channel | Movement between repeated angled boundaries | Whether channel behavior still supports the trend |
When the chart mainly shows a pause instead of a possible trend change, trend-pause pattern context gives that structure more room. For compact compression after a sharp move, use the pennant pattern guide. For a parallel countertrend pause, see bullish and bearish flag patterns.
Neutral and Bilateral Pattern Cheat Sheet
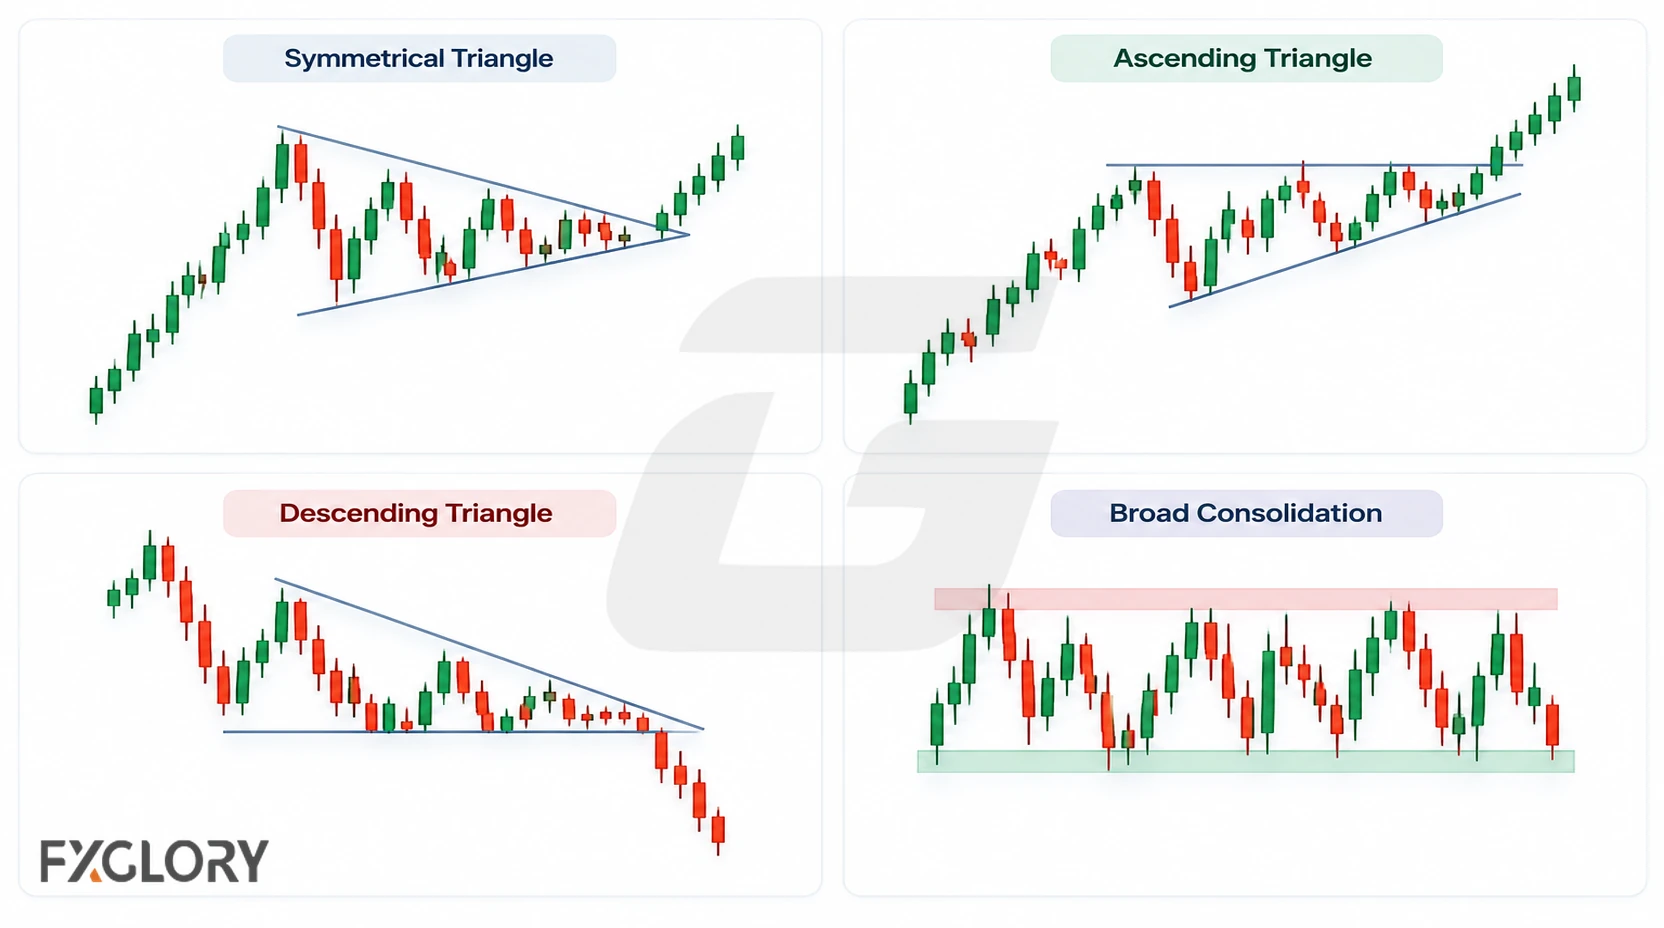
Neutral and bilateral patterns show pressure building without confirmed direction. These structures are watch areas, not directional answers before price confirms one side.
| Structure | Quick Clue | Next Check |
|---|---|---|
| Symmetrical triangle | Lower highs and higher lows compress together | Which boundary breaks and whether price holds |
| Ascending triangle | Flat upper area with rising lows | Whether resistance breaks or price rejects lower |
| Descending triangle | Flat lower area with falling highs | Whether support breaks or price rejects higher |
| Broad consolidation | Repeated reactions without clean trend direction | Whether price leaves the range or keeps rotating |
When narrowing price action is the main feature, triangle compression in forex helps separate symmetrical, ascending, and descending structures. When the narrowing structure slopes upward or downward, wedge behavior around angled boundaries may be the closer match.
Harmonic Pattern Cheat Sheet
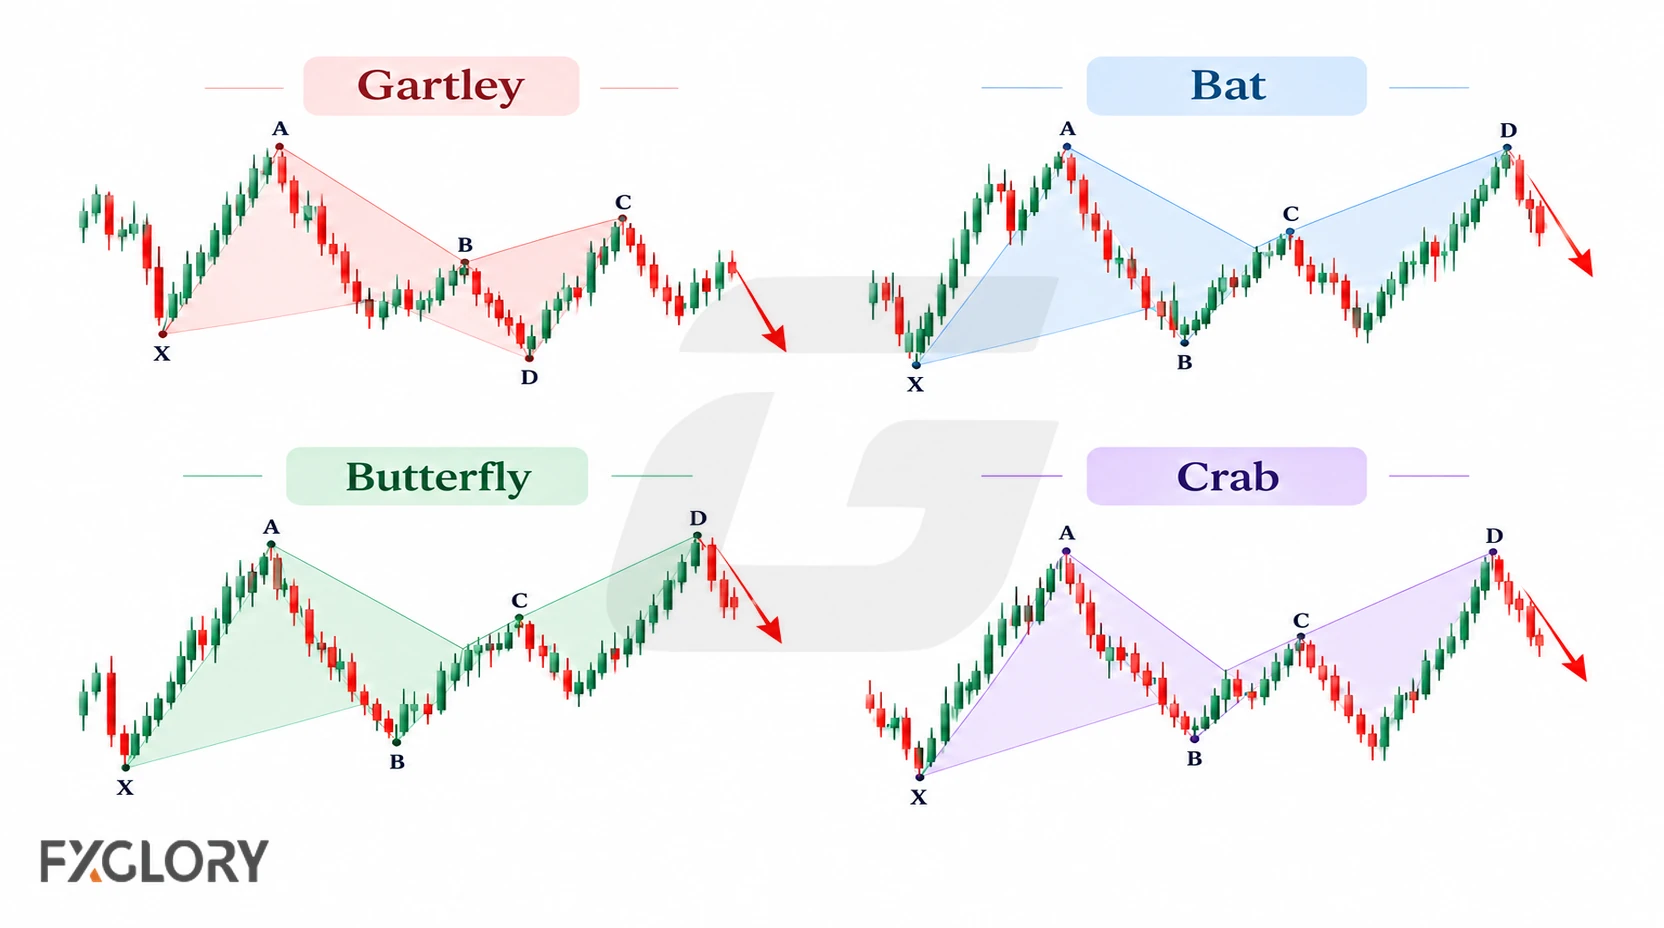
Harmonic patterns are ratio-based chart structures. They require more precise swing measurement than classic chart patterns, so they are easier to misuse when the swings are unclear.
| Structure | Quick Clue | Next Check |
|---|---|---|
| General harmonic pattern | Measured swings with specific relationships | Whether ratios and completion area are clear |
| Butterfly pattern | Extended swing structure with a projected area | Whether price reacts near the measured zone |
When the chart depends on measured swing relationships rather than a simple boundary, review ratio-based chart structures. When the measured move extends into a butterfly-style completion area, use the butterfly pattern reference.
Other Chart Structures You May See
Some cheat sheets include additional names such as triple top, triple bottom, rounding top, rounding bottom, cup and handle, broadening formation, diamond, or megaphone structure. These can help describe price behavior, but they should not be forced onto a chart.
| Structure Type | Basic Idea | Careful Reading |
|---|---|---|
| Triple top / triple bottom | Repeated reactions from a similar area | Check whether it is reversal pressure or ordinary range behavior |
| Rounding structures | Slow curved change in pressure | Harder to define cleanly, so confirmation matters |
| Cup and handle | Rounded recovery followed by a smaller pause | Needs clean structure and context, not just a curved shape |
| Broadening or diamond structures | Expanding or unusual swing behavior | Often messy; avoid forcing exact labels when boundaries are unclear |
Chart Pattern Confirmation Map
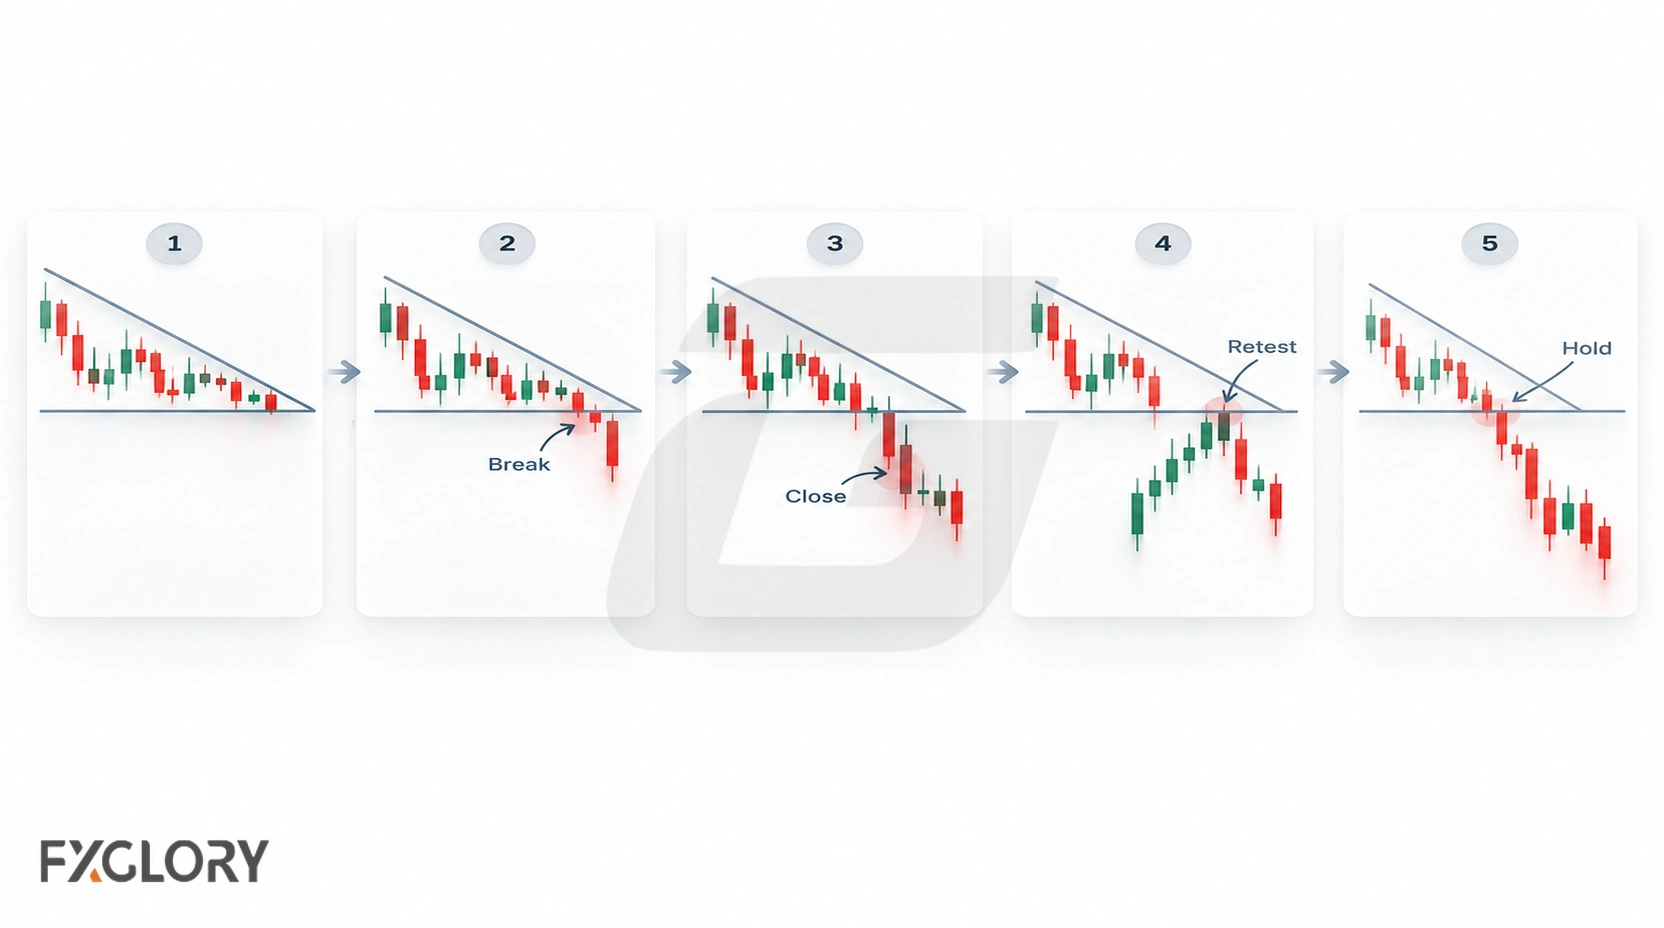
A visible shape can exist before a breakout. Different forms of breakout evidence can strengthen a scenario, without guaranteeing the outcome.
| Confirmation Type | What It Looks Like | Why It Matters |
|---|---|---|
| Boundary break | Price moves beyond support, resistance, neckline, trendline, or range edge | Shows that price has tested the visible structure |
| Close beyond boundary | A candle closes outside the pattern area | Helps filter brief spikes, though false breaks can still happen |
| Retest reaction | Price returns to the broken area and reacts | Shows whether the old boundary may still matter |
| Candle reaction | Price shows rejection or hesitation near the boundary | Adds short-term detail around the broader structure |
| Momentum context | Momentum supports or weakens the pattern scenario | Helps judge whether pressure is increasing or fading |
| Volatility context | Price movement expands, contracts, or becomes unstable | Helps judge whether execution risk is changing |
When candle-level reaction matters near a boundary, candlestick context around key areas can add detail. When momentum, trend, or volatility needs extra structure, indicator-based context may help organize the reading.
Invalidation Clues on a Forex Pattern Cheat Sheet
Separate three questions: whether the geometry still fits the named pattern, whether a specific breakout or reversal scenario has failed, and where an actual trade would be exited. These need not share the same level.
- Failed breakout: Price breaks the pattern boundary, then returns inside and holds there.
- Failed reversal scenario: Price sustains movement against the expected reversal, such as a failed neckline break followed by renewed movement with the earlier trend.
- Failed continuation idea: Price breaks against the trend instead of resuming the trend.
- Unclear identification: The swing points or boundaries do not adequately support the pattern label.
- Timeframe conflict: A higher-timeframe level may weaken the scenario without undoing the lower-timeframe structure.
- Market-condition change: News, volatility, or liquidity can change the usefulness and execution risk of a setup without necessarily invalidating its shape.
What Cheat-Sheet Arrows Do Not Mean
Many chart pattern cheat sheets use arrows to show possible movement after a pattern. The arrow is only a simplified visual reminder. It does not mean price must move in that direction.
- An arrow is not confirmation: Confirmation comes from price behavior around the pattern boundary.
- An arrow is not a target guarantee: Price may move partly, stall, reverse, or fail immediately.
- An arrow is not a stop-loss plan: Risk still needs a defined invalidation point and position-size logic.
- An arrow is not market context: Trend, range, timeframe, news, and volatility still matter.
- An arrow is not execution quality: Spread and slippage can affect the result around breakouts and fast moves.
A cheat sheet is most useful when it keeps the pattern category visible while the trader still reads the actual chart.
Forex Context for Chart Pattern Cheat Sheets
Forex patterns should be read with market conditions because currency pairs trade across global sessions. A structure may behave differently during active session overlap, quiet liquidity, or major news events.
- Sessions: Breakouts during active sessions may behave differently from moves during thin liquidity.
- News: Economic releases and central-bank events can overpower technical structure quickly.
- Spread and slippage: Fast movement near a breakout or retest can affect execution.
- Timeframes: A clean lower-timeframe pattern can still conflict with a higher-timeframe level.
- Pair behavior: Some pairs may move more sharply or react differently around key levels.
- Volume limits: Spot forex does not have one centralized exchange volume figure, so volume-style readings need careful interpretation.
Some traders use tick activity as one supporting clue instead of treating it as complete market volume. When volume-style context matters, tick-volume reading in forex should stay secondary to structure, confirmation, and risk. When the main concern is how far price is moving, ATR-based volatility context can help frame changing movement conditions.
Common Mistakes With Forex Chart Pattern Cheat Sheets
Cheat sheets become risky when they make trading look cleaner than live charts actually are.
- Matching the picture too quickly: The trader labels a weak structure because it resembles a diagram.
- Ignoring context: The pattern name replaces trend, range, support, resistance, and timeframe reading.
- Guessing the breakout: The trader chooses a direction before price confirms the boundary.
- Confusing identification with risk planning: The trader recognizes a valid structure but acts without a separately defined trade exit.
- Mixing every pattern type together: Chart patterns, candlestick patterns, and indicators are treated as the same thing.
- Overtrusting arrows: The visual direction on the sheet is treated as if it were a forecast.
- Ignoring execution conditions: Spread, slippage, and fast volatility are left out of the decision.
Practice Workflow for Using the Cheat Sheet
A simple review process can keep the cheat sheet useful without turning it into a signal list.
- Label the formation: Record the category and boundary that best match the chart without forcing a pattern name.
- State the evidence: Note whether the pattern is still forming, has broken a level, or has shown additional follow-through.
- Check the alternative: Describe what price behavior would weaken the proposed direction or change the pattern classification.
- Review trading separately: If acting, specify entry, cancellation, position size, and execution costs.
- Compare the outcome: Record whether the original pattern label was sound separately from whether the trade succeeded.
For example, if EUR/GBP compresses between lower highs and higher lows, the cheat sheet may point to a triangle-style structure. The next question is not which way price must go. The next question is which boundary matters, what confirmation would look like, and where the idea would fail.