Forex Triangle Patterns: Ascending, Descending and Symmetrical

Learn how forex triangle patterns form as price compression, how ascending, descending, and symmetrical triangles are read, and why breakout confirmation, invalidation, timeframe, news, spread, slippage, and risk control matter before assuming direction.
 
Written byHenry Green
Published
Last updated

Key Takeaways

  • Forex triangle patterns are compression structures where price movement narrows between converging or partly converging boundaries.
  • The three common triangle types are symmetrical, ascending, and descending triangles.
  • Ascending triangles often show pressure near resistance, descending triangles often show pressure near support, and symmetrical triangles usually show more neutral compression, but none of them guarantee direction.
  • A triangle pattern needs visible boundaries, enough structure, confirmation behavior, and a clear invalidation point before it becomes useful.
  • False breakouts, stale apex movement, weak boundaries, news volatility, spread, slippage, and timeframe conflict can make triangle patterns fail.
Risk note: Forex trading involves risk of loss. Triangle patterns can help organize compression and breakout scenarios, but they do not guarantee direction, continuation, reversal, or a target.

What Are Forex Triangle Patterns?

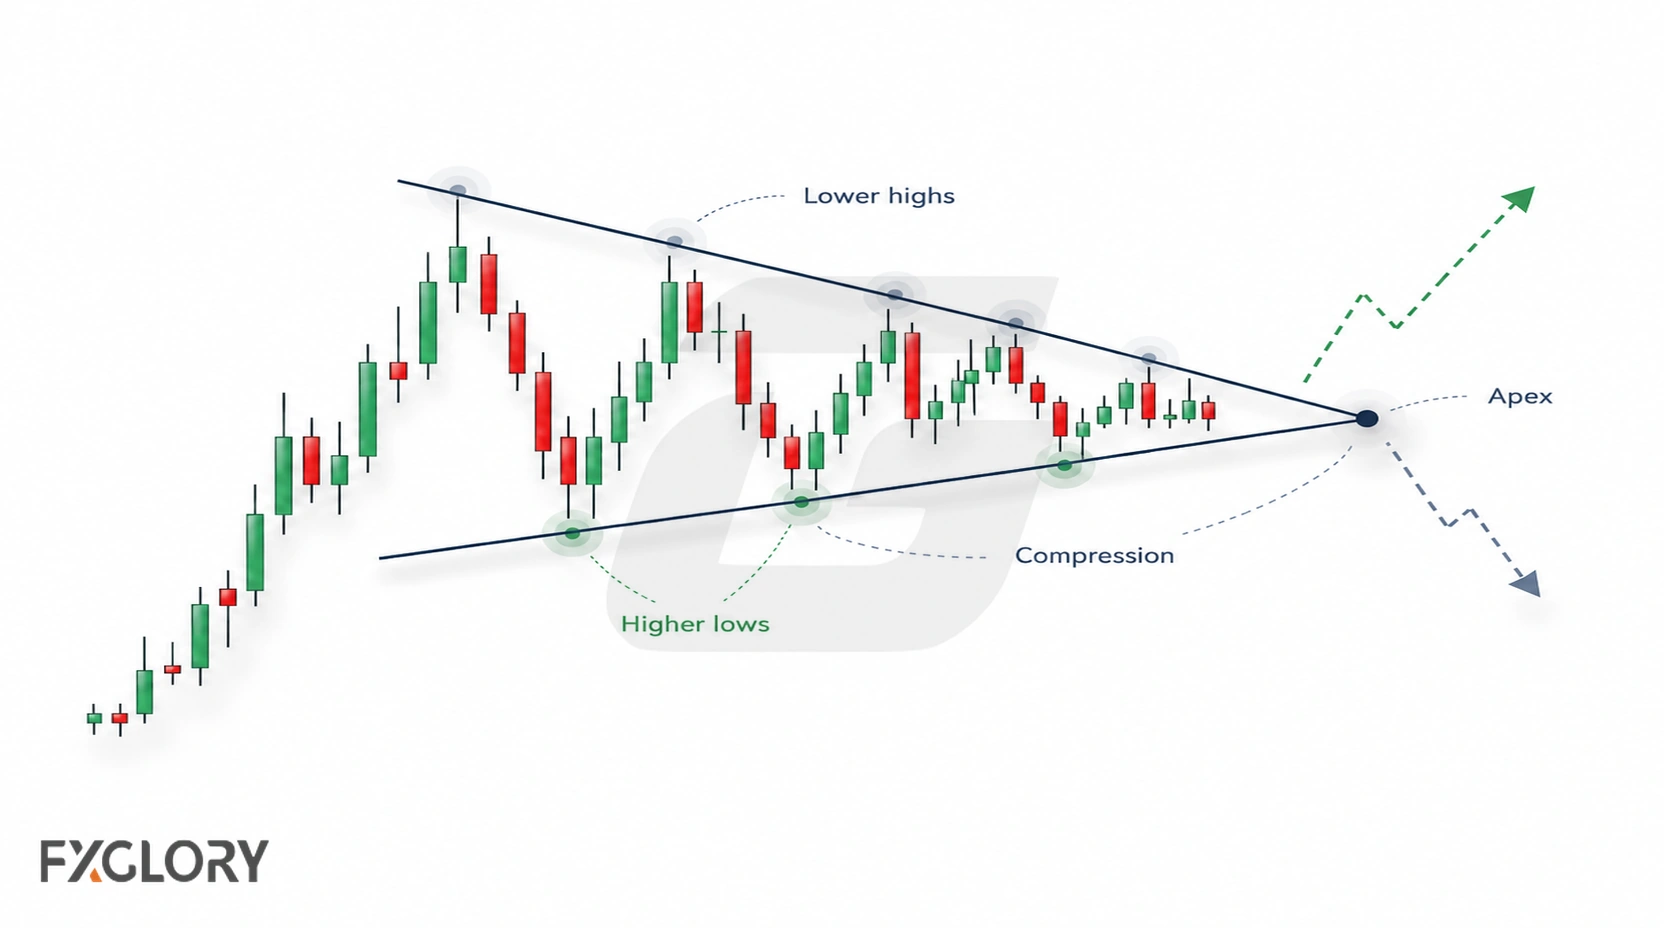
Forex triangle patterns are chart structures where price movement narrows between boundaries. The structure may form when buyers and sellers push price into a tighter range, creating compression before a possible breakout attempt.

A triangle pattern does not tell traders what price must do next. It shows that price is narrowing, reacting from boundaries, and building a decision area. Direction still depends on context, confirmation, invalidation, and risk.

Triangles can appear inside trends, after strong moves, or during sideways markets. That is why they should be read as compression structures first, not automatic bullish or bearish signals. For the broader chart-pattern framework, start with the full chart-pattern map.

Plain-English idea: A triangle pattern shows price getting squeezed. It does not decide the breakout direction by itself.

How Triangle Patterns Form in Forex

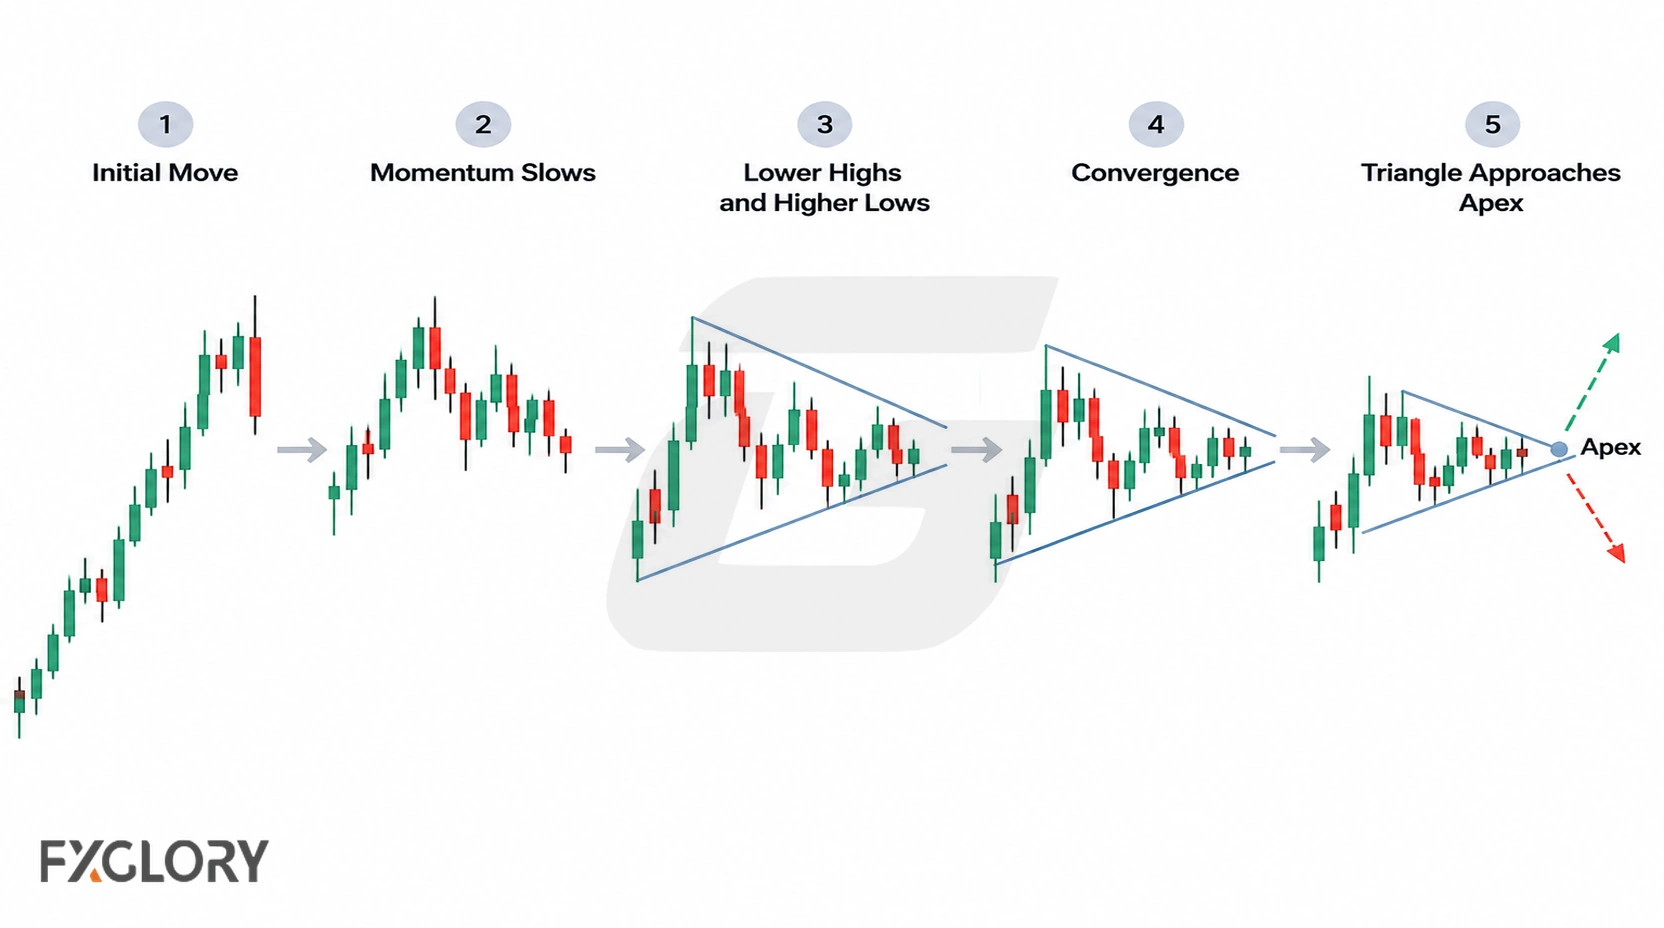
Triangle patterns form when price starts moving through smaller swings. The highs, lows, or both begin to narrow, and the chart creates a visible area of compression.

In forex, this compression may happen because the market is waiting for more information, reacting around support or resistance, pausing inside a trend, or becoming cautious before a session change or news event. The pattern becomes easier to read when the boundaries are visible and the structure is not forced.

  • Prior movement: Price may enter the triangle after a trend, a breakout attempt, or a range rotation.
  • Compression: Highs, lows, or both begin to narrow.
  • Boundaries: Price reacts around an upper line, lower line, or a flat support or resistance area.
  • Apex area: If price drifts too far into the apex, the structure may lose clarity.
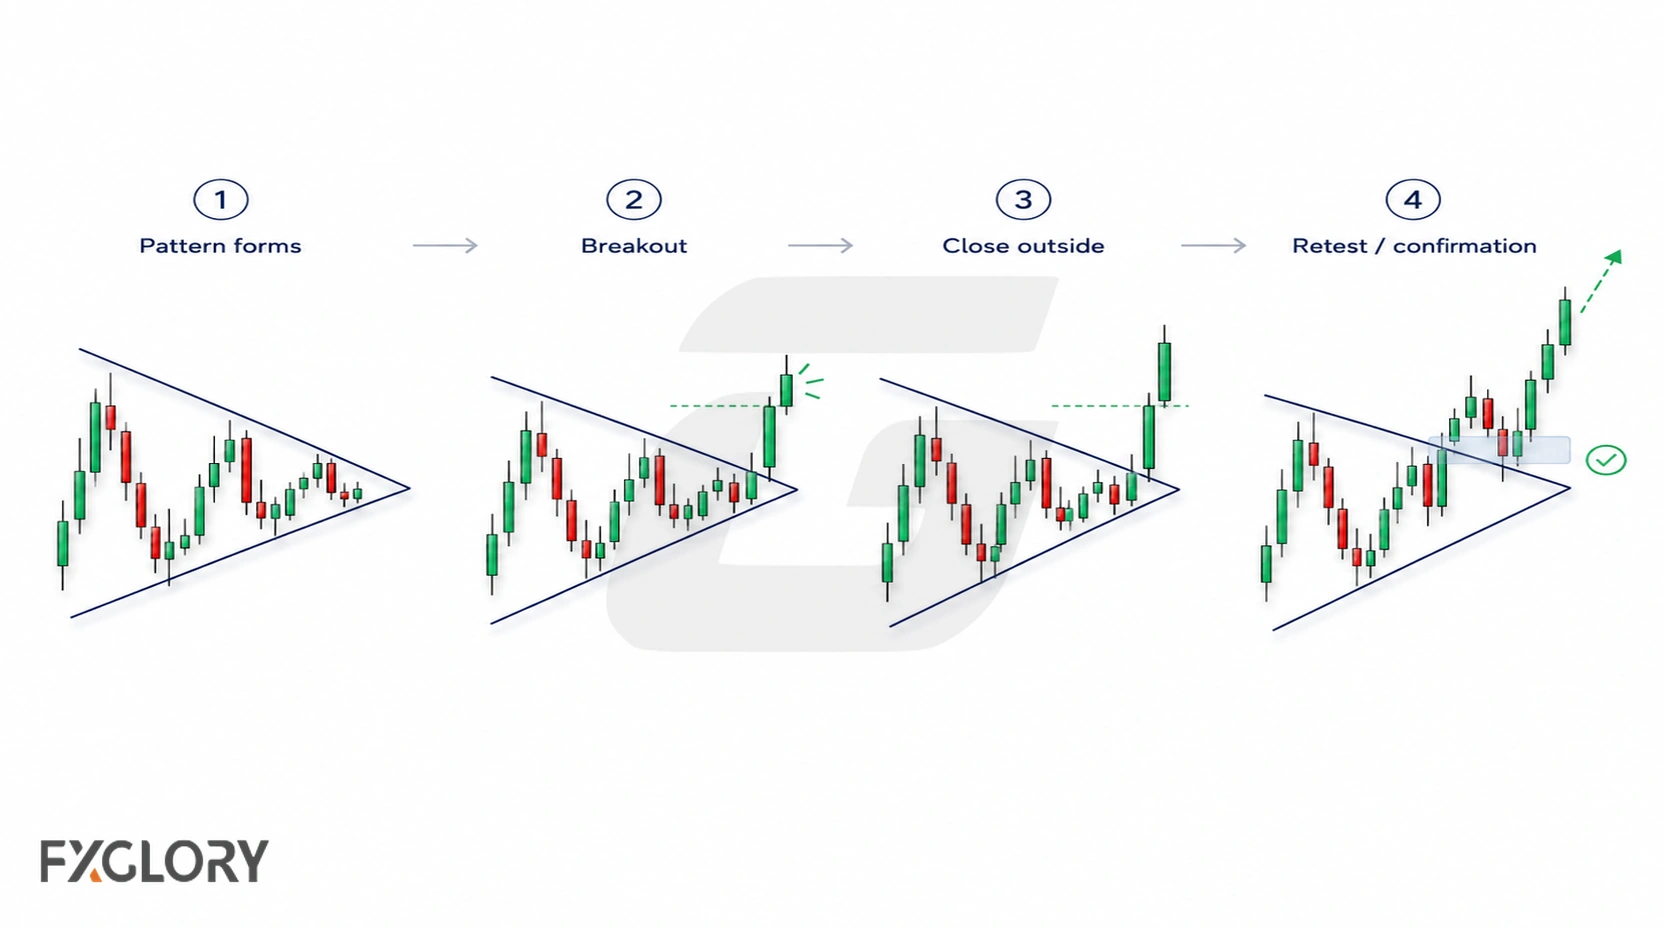
  • Breakout attempt: Price tests one side of the triangle and either holds outside or returns inside.

A triangle with unclear boundaries may only be ordinary choppy movement. One reaction on each side is usually not enough to make a meaningful triangle; the structure needs enough visible reactions to make both boundaries easy to explain.

Triangle Pattern Anatomy

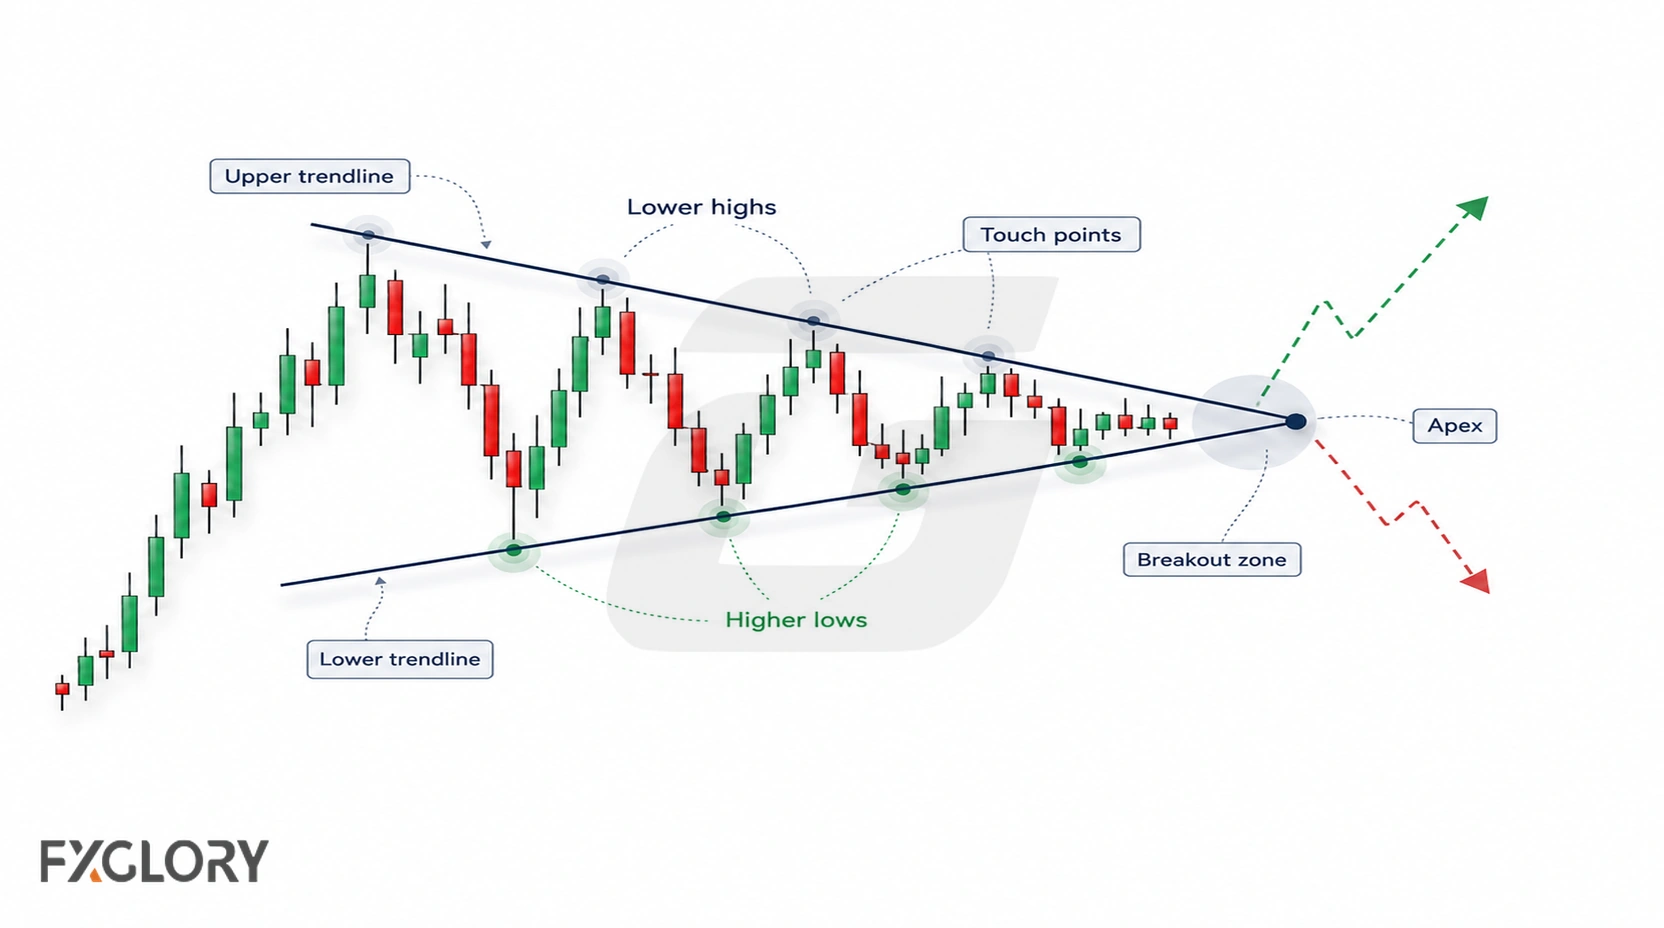
A forex triangle pattern is easier to read when the trader can explain its parts. The cleaner the parts, the less imagination the pattern needs.

PartWhat It MeansWhy It Matters
Upper boundaryThe area where price reactions form the top side of the triangleIt helps define possible upside breakout or rejection behavior
Lower boundaryThe area where price reactions form the bottom side of the triangleIt helps define possible downside breakout or rejection behavior
CompressionPrice movement narrows as the structure developsIt shows pressure building, but not guaranteed direction
TouchesRepeated reactions around the boundariesThey make the structure easier to see, but forced touches can mislead
ApexThe area where boundaries move closer togetherPrice drifting too far into the apex can weaken the breakout idea
Breakout areaThe side where price attempts to leave the structureIt needs confirmation and invalidation before the scenario is useful
Stale apex warning: A triangle that spends too long near the apex can lose clean breakout value. When compression becomes stale, the pattern may turn into ordinary sideways movement.
Structure rule: A triangle should be visible without forcing the lines. If the boundaries need too much adjustment, the pattern may not be clear enough.

Types of Forex Triangle Patterns

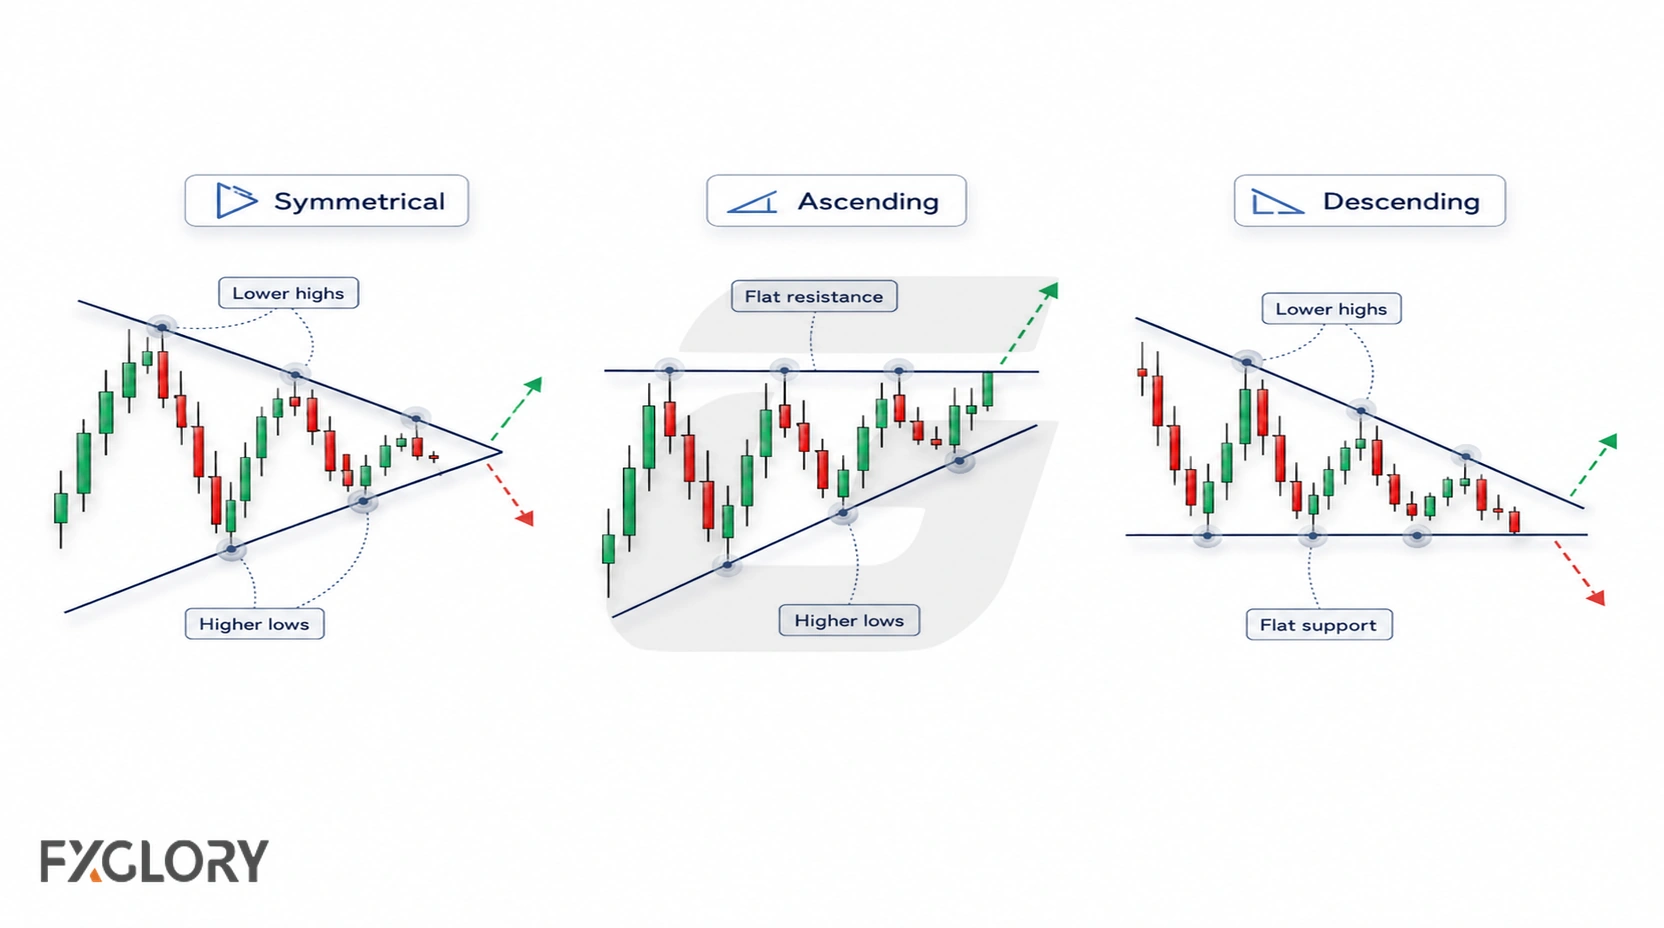
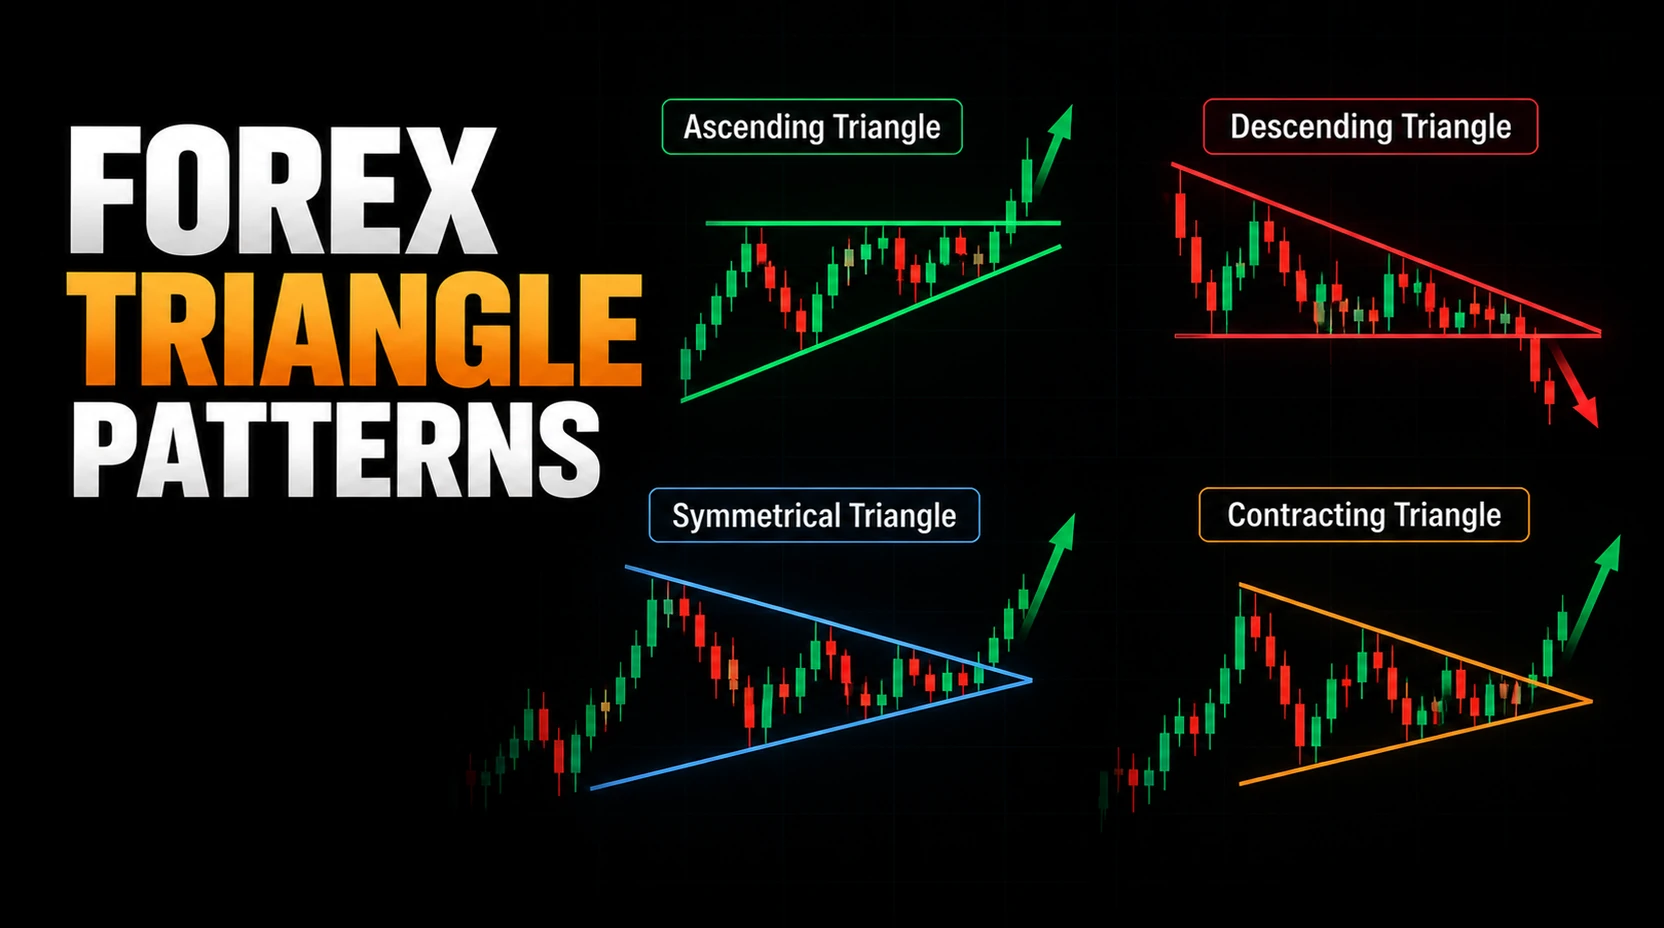
The three common triangle patterns in forex are symmetrical, ascending, and descending triangles. They share the idea of compression, but the boundary shape is different.

Triangle TypeBasic ShapeCommon ReadingCareful Use
Symmetrical triangleLower highs and higher lows compress toward each otherPressure is narrowing from both sidesDirection should not be assumed before confirmation
Ascending triangleA flatter upper area with rising lowsPrice may be pressing toward resistanceIt is not automatically bullish; resistance can still hold or reject
Descending triangleA flatter lower area with falling highsPrice may be pressing toward supportIt is not automatically bearish; support can still hold or reject

Triangles may appear in continuation, neutral, or reversal-like contexts. The same triangle name can mean different things depending on the prior move, location, timeframe, and breakout behavior.

Triangle Bias vs Confirmation

Some triangle patterns have a common directional bias. Bias is only a starting idea, not a trading answer.

PatternCommon BiasWhat Must Still HappenMain Risk
Ascending triangleOften watched for upside pressurePrice needs to break, hold, or react clearly around the upper boundaryResistance holds and price breaks lower
Descending triangleOften watched for downside pressurePrice needs to break, hold, or react clearly around the lower boundarySupport holds and price breaks higher
Symmetrical triangleOften treated as neutral until one side breaksPrice needs to confirm which boundary mattersGuessing the breakout side too early
Bias rule: A triangle can lean one way, but price still has to confirm the side that matters.

Strong vs Weak Forex Triangle Patterns

A strong triangle pattern is not just two lines meeting on a chart. It has visible compression, explainable boundaries, and a defined point where the idea becomes wrong.

Chart FactorStronger Triangle ConditionWeaker Triangle Condition
BoundariesThe upper and lower areas are visible without forcing linesThe lines depend on one isolated wick or adjusted drawing
CompressionPrice movement becomes clearly narrowerPrice swings stay wide, messy, or random
TouchesSeveral reactions help define the structureThe pattern relies on too few reactions or after-the-fact drawing
ContextThe triangle forms in a market condition that is easy to describeThe surrounding chart is unclear or already noisy
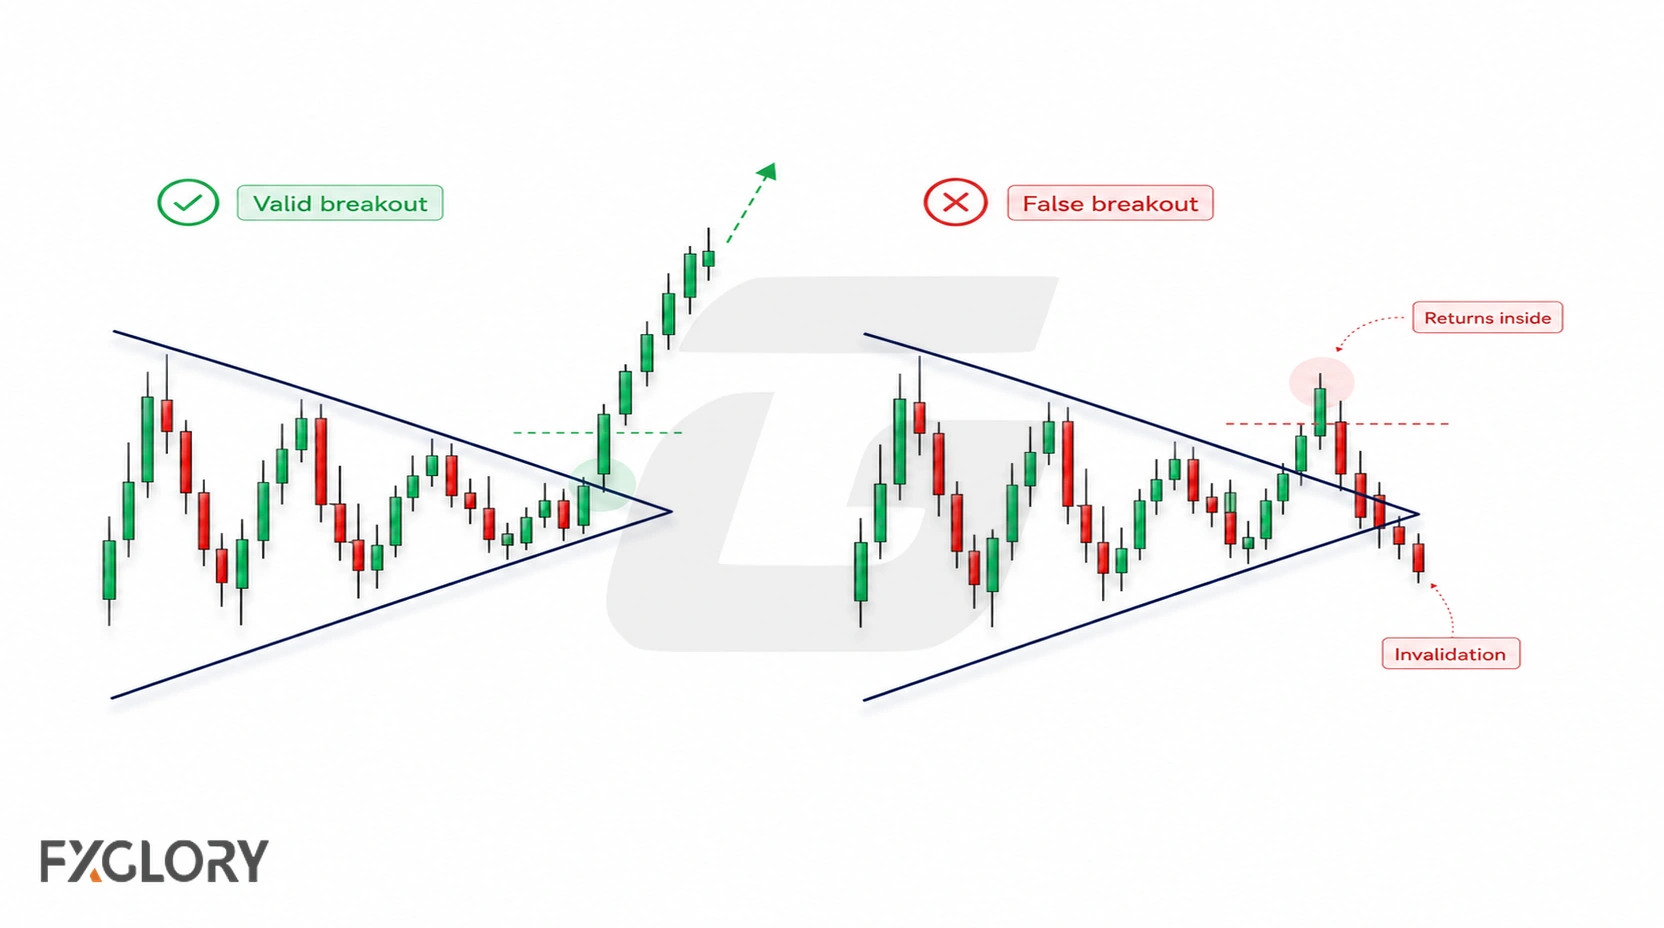
Breakout behaviorPrice breaks, closes, retests, or holds outside the structurePrice spikes briefly and returns inside the triangle
Risk planInvalidation is defined before actingThe trader sees a target but not the wrong point
Quality rule: A weak triangle is not improved by choosing a stronger label. If the compression is unclear, the triangle is unclear.

How to Confirm a Forex Triangle Pattern

Confirmation helps separate a visible triangle shape from a more developed breakout scenario. It does not remove uncertainty, but it can reduce early guessing.

  1. Start with context: Is price trending, ranging, compressing, or unclear before the triangle?
  2. Mark the boundaries: Draw only the upper and lower areas that are visible without forcing them.
  3. Check compression: Is price actually narrowing, or is the chart just messy?
  4. Watch the breakout attempt: Does price move beyond one boundary?
  5. Check the close: Does price hold outside the structure or only spike briefly?
  6. Watch the retest: If price returns to the broken boundary, does the area still matter?
  7. Use supporting context: Candle reaction, momentum, volatility, or tick activity may support or weaken the scenario.
  8. Define invalidation: Decide what price behavior cancels the triangle idea.

A triangle pattern becomes more useful when the trader can explain the boundary, breakout behavior, confirmation, invalidation, and risk without forcing direction.

Invalidation: When the Triangle Idea Fails

Invalidation is the condition that shows the triangle idea is no longer useful. It should be defined before the trader focuses on any possible breakout target.

  • False breakout: Price breaks a boundary, then returns inside the triangle and holds there.
  • Boundary failure: The support, resistance, or trendline area is too unclear to explain.
  • Apex drift: Price moves too far into the apex without a clean decision and the structure loses value.
  • Opposite break: Price breaks the side opposite the original scenario and holds.
  • Higher-timeframe conflict: The breakout pushes into a stronger higher-timeframe level.
  • News-driven shift: A high-impact event changes volatility and overwhelms the pattern.
  • No clear wrong point: The trader cannot explain where the triangle idea becomes invalid.

Some triangle methods use the height of the pattern to estimate possible target zones. This can help organize a scenario, but target planning should come after invalidation, not before it. Price may move only part of the way, retest the triangle, range, reverse, or fail immediately.

Wrong-point rule: A triangle pattern is incomplete if the trader can name the pattern but cannot name the invalidation point.

Triangle vs Wedge vs Pennant

Triangles, wedges, and pennants can look similar because they all involve narrowing movement. The difference is usually in size, slope, location, and the move that came before the structure.

StructureQuick ClueCareful Reading
TrianglePrice compresses between converging or partly converging boundariesCan be continuation, neutral, or reversal-like depending on context
WedgeThe narrowing structure usually slopes upward or downwardRead slope, location, trend context, and boundary behavior together
PennantA compact compression often forms after a sharp directional moveUsually smaller and more closely tied to a prior impulse move

When the structure slopes clearly upward or downward, angled compression behavior may be the closer match. When the structure is compact and follows a sharp move, the compact pennant structure may be more relevant. When the triangle appears as a pause inside an existing trend, compare it with trend-pause pattern context.

Forex Context: Sessions, News, Spread, Slippage, and Volume

Forex triangle patterns should be read with market conditions because currency pairs trade across global sessions. A triangle that looks clean during quiet movement may behave differently during a session overlap, economic release, or fast volatility shift.

  • Session behavior: Breakout attempts during active sessions may behave differently from moves during thin liquidity.
  • News events: Economic releases and central-bank comments can overpower technical compression quickly.
  • Spread and slippage: Fast movement around triangle breakouts or retests can affect execution and risk.
  • Pair behavior: Different currency pairs may compress, break, or retest in different ways.
  • Timeframes: A lower-timeframe triangle can conflict with a stronger higher-timeframe support or resistance area.
  • Volume limits: Spot forex does not have one centralized exchange volume figure, so volume-style readings need careful interpretation.

Some traders use tick activity as one supporting clue rather than a complete market-volume answer. When volume-style context matters, tick-volume reading in forex should stay secondary to structure, confirmation, and risk.

Using Indicators and Candles With Triangle Patterns

Indicators and candlestick reactions can support triangle-pattern analysis, but they should not replace price structure. The triangle still needs visible compression, boundaries, confirmation, and invalidation.

Tool TypeWhat It Can Help ReadCareful Use
Momentum indicatorsWhether pressure is building, fading, or divergingMomentum can shift before or after the breakout and still needs context
Trend indicatorsWhether the broader trend supports a continuation readingThey may lag during compression
Volatility indicatorsWhether movement is contracting or expandingHigh volatility can increase execution risk around breakouts
Candlestick reactionsShort-term rejection or hesitation near a triangle boundaryOne candle is not the same as a full triangle structure
Tick activityActivity around a boundary break or retestIt is supporting context, not centralized market volume

When momentum or trend strength needs extra context, indicator-based chart context may help organize the reading. When the main question is how much price is moving before or after compression, ATR-based volatility context may be useful. When candle reaction matters near a triangle boundary, candlestick behavior around key areas can add short-term detail.

Example: Reading a Triangle Pattern on NZD/USD

Suppose NZD/USD has been moving sideways after a directional move, then price starts forming lower highs and higher lows. A trader may first describe the market as compression, without assuming the breakout direction.

If price breaks above the upper boundary and holds, that may create one scenario. If price breaks below the lower boundary and holds, that may create another. If price breaks one side and returns inside the triangle, the move may be a false breakout. If neither side breaks and holds, the triangle may remain a range rather than become a breakout scenario.

The useful questions are simple: Are the boundaries clear? Is price actually compressing? Which side breaks? Does price hold outside the structure? Where is the triangle idea wrong?

Example note: This is not a trade recommendation or signal. It shows how a triangle pattern can be organized into possible scenarios before any trading decision.

Common Mistakes With Forex Triangle Patterns

Triangle-pattern mistakes often happen when traders treat compression as a prediction instead of a structure to study.

  • Guessing the breakout direction: The trader assumes the triangle must break one way before price confirms it.
  • Forcing the boundaries: Trendlines are adjusted until the chart resembles a triangle.
  • Ignoring false breakouts: Price leaves the structure briefly and then returns inside.
  • Waiting too deep into the apex: The structure loses clarity as price drifts too far into the narrowing point.
  • Ignoring higher-timeframe levels: A triangle breakout pushes into stronger support or resistance.
  • Overusing volume assumptions: Volume-style clues are treated as if spot forex had one centralized exchange volume figure.
  • Confusing triangles with wedges or pennants: Similar shapes are labeled without checking slope, size, and context.
  • No invalidation: The trader knows the expected break but not the point where the idea is wrong.

Beginner Workflow for Forex Triangle Patterns

A clear process helps keep triangle patterns from becoming guesswork.

  1. Start with context: Decide whether price is trending, ranging, compressing, or unclear.
  2. Find the boundaries: Mark the upper and lower areas that are visible without forcing them.
  3. Check compression: Confirm whether price movement is actually narrowing.
  4. Name the type: Decide whether the structure is symmetrical, ascending, or descending.
  5. Separate bias from confirmation: Avoid assuming direction before price breaks and holds.
  6. Watch the breakout attempt: Check whether price leaves the structure or returns inside.
  7. Define invalidation: Mark where the triangle idea becomes wrong.
  8. Check forex conditions: Consider session, news, spread, slippage, volatility, and pair behavior.
  9. Review the outcome: Whether the idea works or fails, check if the triangle reading was actually clear.

This process keeps the focus on compression, confirmation, invalidation, and risk instead of treating triangle patterns as automatic breakout signals.

A Safer Way to Read Forex Triangle Patterns

Forex triangle patterns help traders organize price compression. They can appear as continuation, neutral, or reversal-like structures depending on the market context.

The strongest triangle ideas begin with visible boundaries, clear compression, confirmation behavior, and a defined invalidation point. If these parts are missing, the pattern may not be ready for a trading decision.

Triangle analysis becomes more useful when it is read with context. Session behavior, news, spread, slippage, volatility, timeframe alignment, pair behavior, position size, and account risk still matter.

Final risk reminder: A forex triangle pattern is only one part of a trading decision. Compression does not guarantee breakout direction, and every scenario needs confirmation, invalidation, and risk control.

Frequently Asked Questions

What are forex triangle patterns?

Forex triangle patterns are chart structures where price movement narrows between boundaries. They often show compression, hesitation, or pressure building before price attempts to break from the structure.

What are the main types of triangle patterns in forex?

The main types are symmetrical triangles, ascending triangles, and descending triangles. Symmetrical triangles usually show narrowing pressure from both sides, ascending triangles have a flatter upper area with rising lows, and descending triangles have a flatter lower area with falling highs.

Are triangle patterns continuation patterns?

Triangle patterns can act as continuation structures in some trend contexts, but they are not always continuation patterns. A triangle can also behave as a neutral compression pattern or fail in the opposite direction.

Is an ascending triangle always bullish in forex?

No. An ascending triangle may show pressure toward resistance, but it is not automatically bullish. Direction depends on context, confirmation, boundary behavior, and invalidation.

Is a descending triangle always bearish in forex?

No. A descending triangle may show pressure toward support, but it is not automatically bearish. Price can break down, break up, range, or create a false breakout.

What confirms a forex triangle pattern?

Confirmation may include a breakout beyond a triangle boundary, a close outside the structure, a retest reaction, or price holding outside the pattern. Confirmation reduces guesswork, but it does not remove risk.

Why do forex triangle patterns fail?

Triangle patterns can fail because of false breakouts, weak boundaries, news volatility, spread and slippage, timeframe conflict, unclear structure, or price drifting too far into the apex without a clean decision.

What is the difference between a triangle and a wedge?

A triangle usually focuses on compression between converging or partly converging boundaries, while a wedge usually slopes upward or downward as a narrowing structure. Some structures can look similar, so context and slope matter.

What is the difference between a triangle and a pennant?

A pennant is usually a smaller, compact compression structure after a sharp move, while a triangle can be broader and may form in continuation, neutral, or reversal-like contexts.

Should beginners trade triangle patterns alone?

Beginners should not treat triangle patterns as complete trade signals. A triangle idea should be connected to market context, confirmation, invalidation, position size, and risk control.

Related Contents

Forex Chart PatternsReturn to the broader chart-pattern guide for reversal, continuation, neutral, and harmonic pattern context.
Forex Chart Patterns Cheat SheetUse the reference sheet to compare triangles with other chart-pattern groups.
Forex Continuation PatternsUnderstand when triangle compression may behave like a pause inside a broader trend.
Wedge Pattern ForexCompare triangle compression with rising and falling wedge structures.
Pennant Pattern ForexReview compact compression structures that may appear after sharp movement.
Forex Technical IndicatorsUse indicator concepts to think about momentum, trend strength, volatility, and confirmation context.
Forex CandlestickCompare broad triangle structures with candle-level reactions around boundaries.
ATR Indicator ForexUse volatility context to understand how price movement changes around compression and breakouts.

Practice Reading Triangle Compression Before Trading Live

Use an FXGlory demo account to practice identifying triangle patterns, testing market scenarios, placing demo orders, and reviewing decisions before using real money.

Open a Demo Account