

What Is a Wedge Pattern in Forex?
A wedge pattern is a narrowing, angled price structure between two converging trendlines. In a rising wedge, both boundaries slope upward; in a falling wedge, both slope downward. The structure describes compression, not a guaranteed breakout direction.
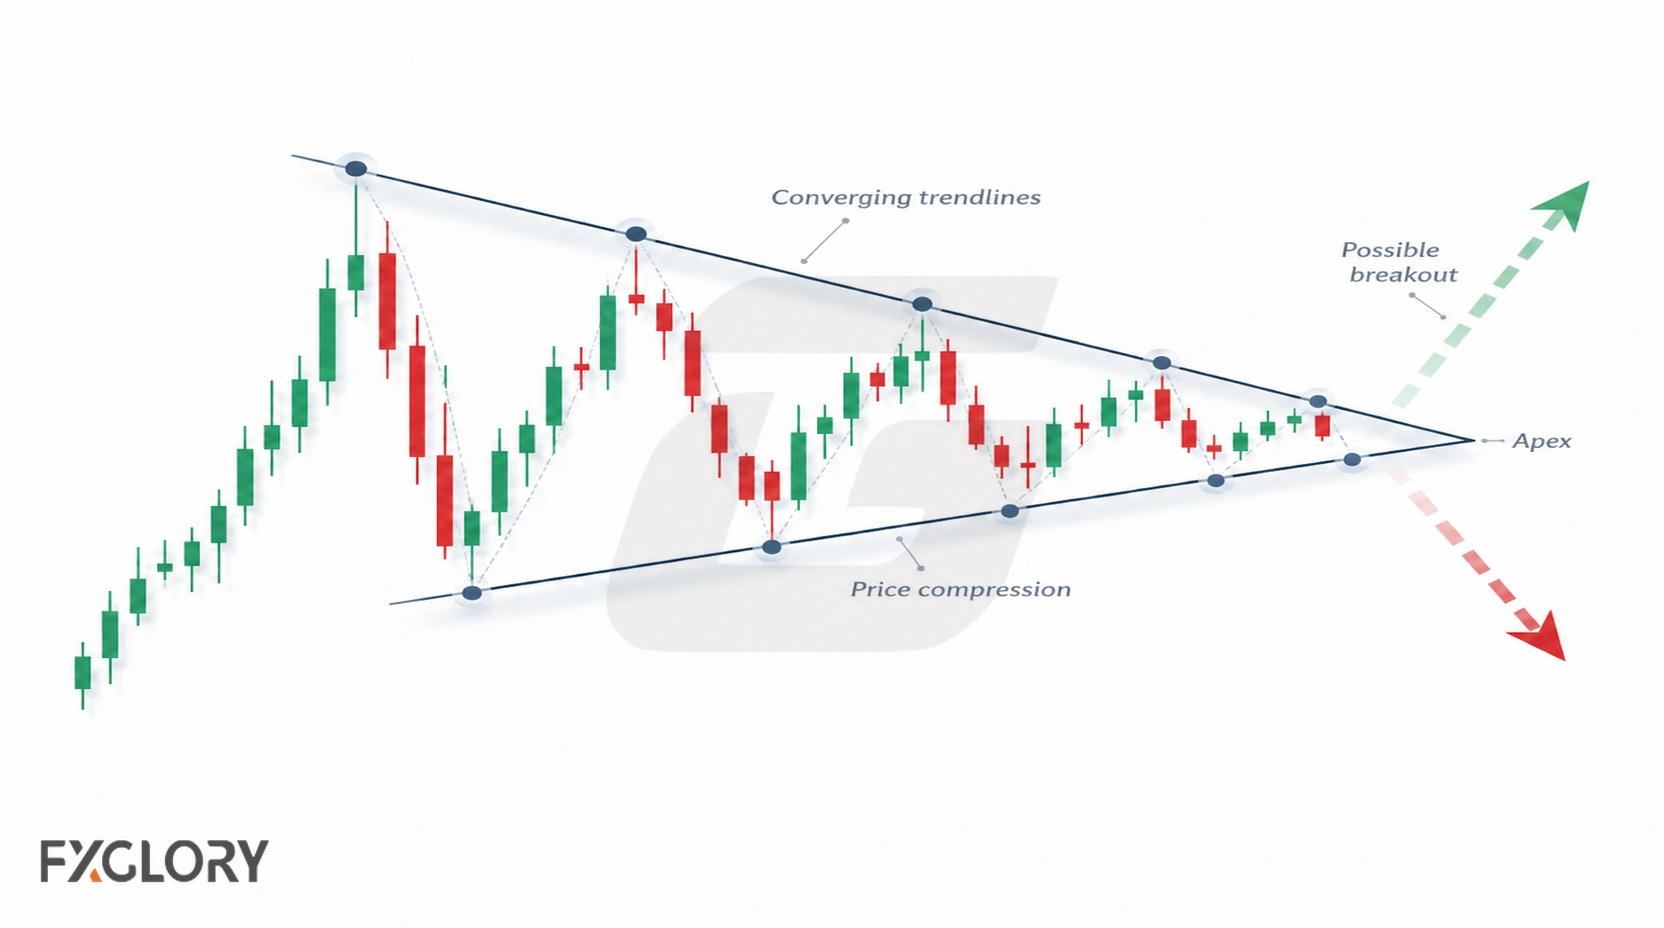
Use its location within the broader trend to distinguish a possible reversal from a pullback that could lead to continuation. For an overview of other structures, see the full chart-pattern map.
How Wedge Patterns Form in Forex
Wedges develop as successive swings continue in a broadly upward or downward direction while the distance between their upper and lower boundaries contracts. Reduced progress across several reactions can create a recognizable pattern, whether after a sustained move or during a countertrend pullback.
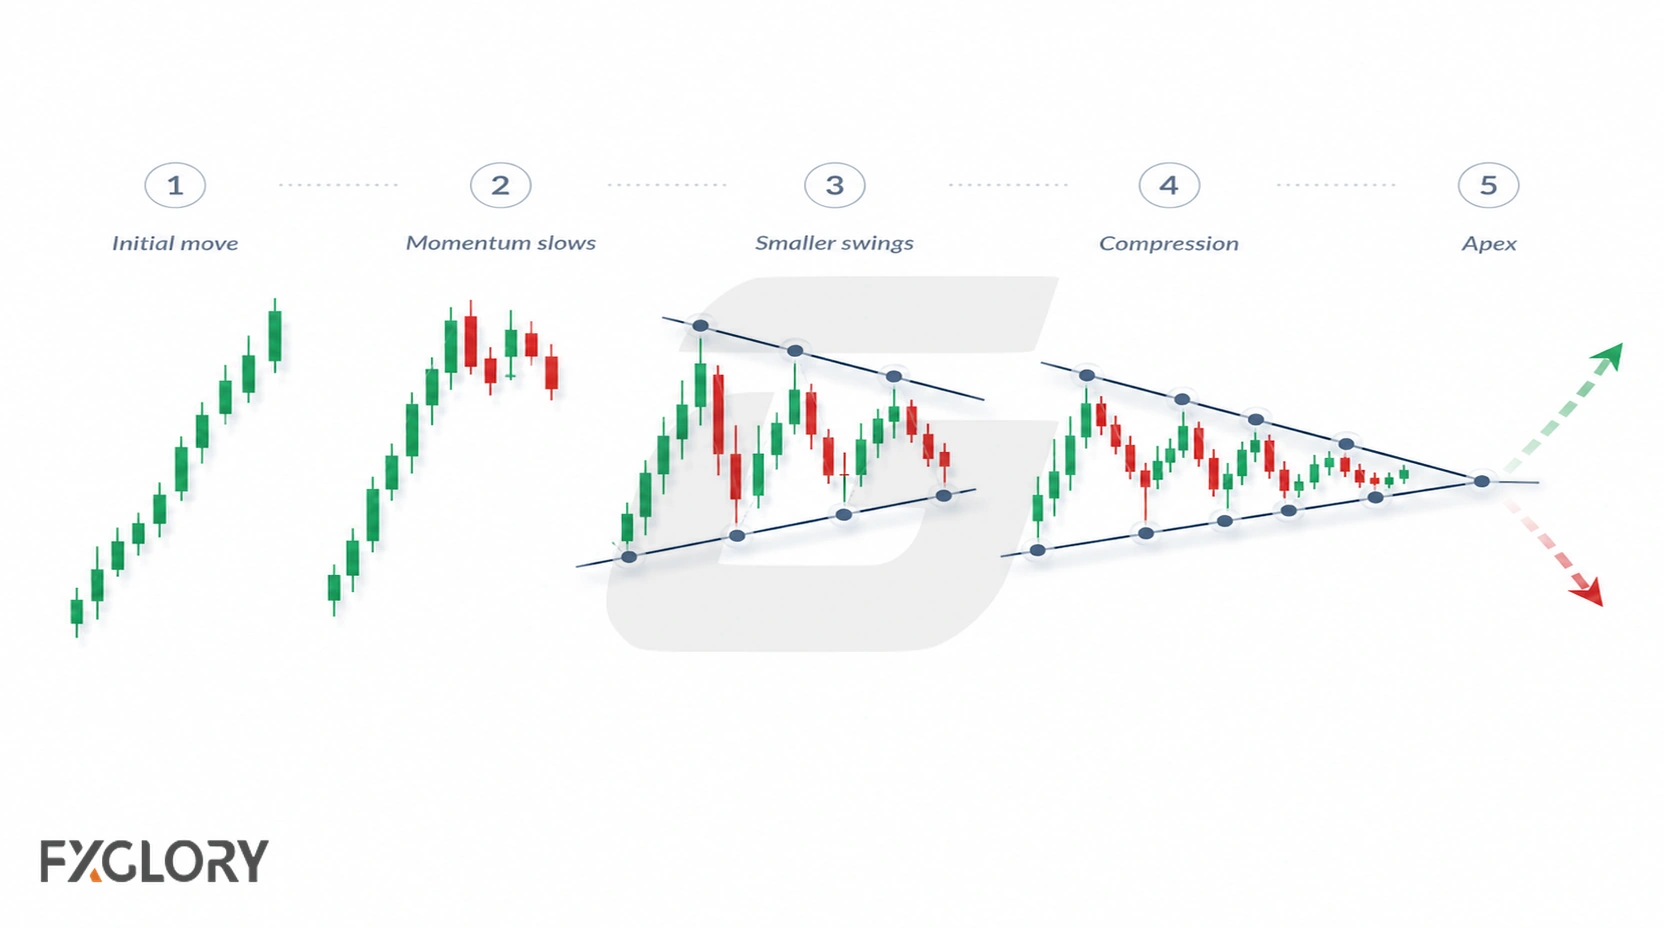
Formation is gradual: an initial move gives way to overlapping swings, identifiable reactions along both boundaries and progressively less space between the lines. A boundary test or departure may then occur, but it is not part of the definition of a completed geometric shape.
Wedge Pattern Anatomy
The chart below labels the geometric parts used to identify the structure. These are descriptive features, not entry requirements.
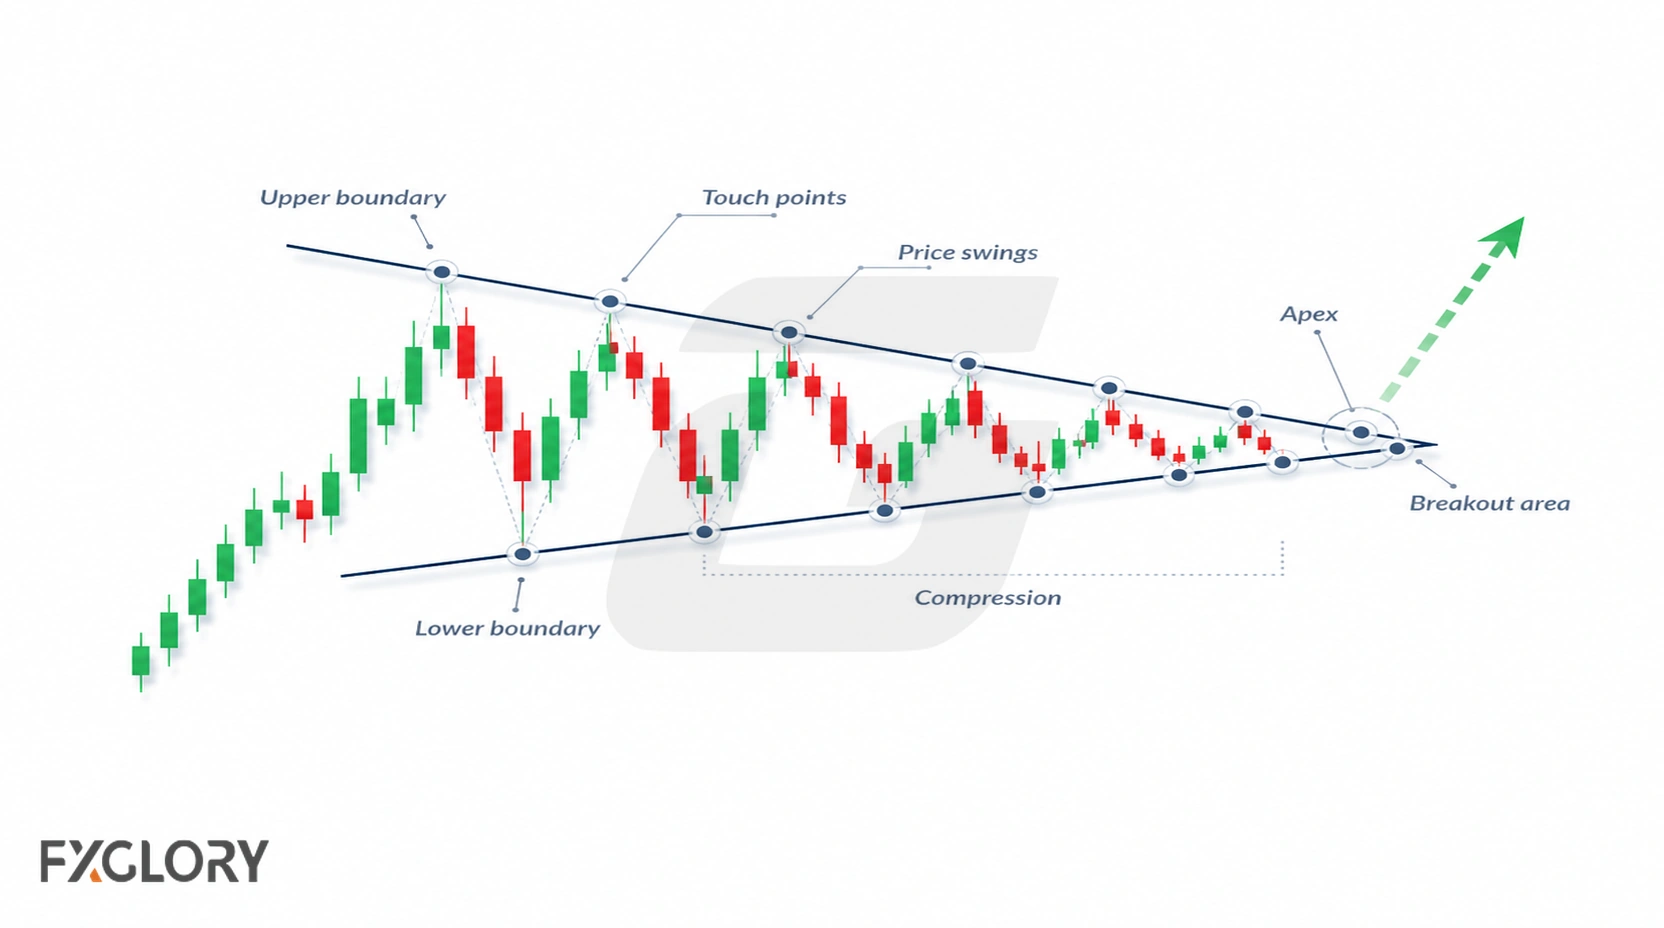
| Part | What It Means | Why It Matters |
|---|---|---|
| Upper boundary | The trendline connecting reactions on the upper side of the wedge | It helps define breakout, rejection, and invalidation behavior |
| Lower boundary | The trendline connecting reactions on the lower side of the wedge | It helps define whether the structure is still holding |
| Slope | The whole structure leans upward or downward | Slope helps separate wedges from broader triangles |
| Compression | The distance between boundaries becomes smaller | It shows pressure tightening, but not guaranteed direction |
| Touches | Repeated reactions around both boundaries | They make the structure easier to see, but forced touches can mislead |
| Apex | The area where the two boundaries move closer together | Too much drift into the apex can weaken the wedge idea |
| Breakout area | The side where price attempts to leave the wedge | It needs confirmation and invalidation before the scenario is useful |
Trendlines should reflect observable swings. If repeated redrawing is needed to accommodate price, treat the classification as uncertain.
Rising Wedge Pattern in Forex
A rising wedge has two upward-sloping boundaries that converge as swings narrow. The steeper boundary approaches the shallower one, creating an angled squeeze.
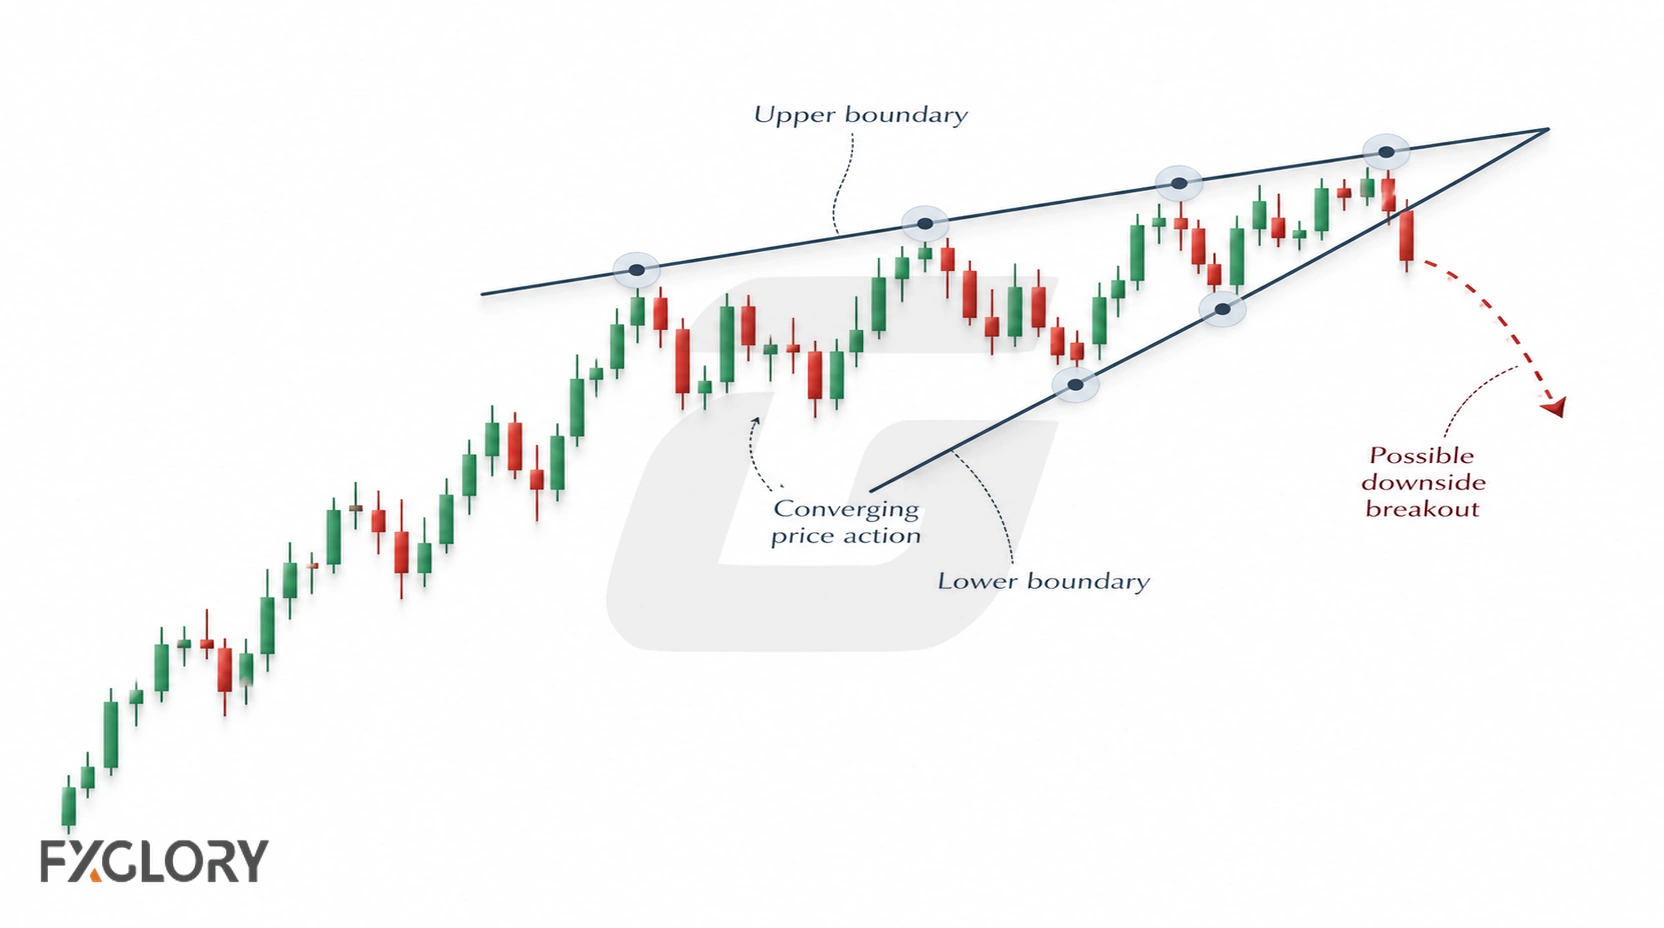
The conventional bearish interpretation is a bias, not a direction forecast. Its significance differs when the wedge ends an extended move versus when it forms as a pullback inside a broader downtrend.
| Feature | Rising Wedge Reading | Careful Use |
|---|---|---|
| Shape | Upward-sloping narrowing structure | Both boundaries should be visible without forcing them |
| Common bias | Often watched for bearish pressure | Bias is not confirmation |
| Possible reversal context | May appear after a mature upward move | Needs evidence that upward pressure is weakening |
| Possible continuation context | May appear as a pullback inside a broader downtrend | Needs broader trend context and confirmation |
| Main failure risk | Price holds inside or breaks above the wedge instead | Invalidation should be defined before focusing on direction |
Falling Wedge Pattern in Forex
A falling wedge has two downward-sloping boundaries that converge as swings narrow. The steeper boundary approaches the shallower one, creating an angled squeeze.
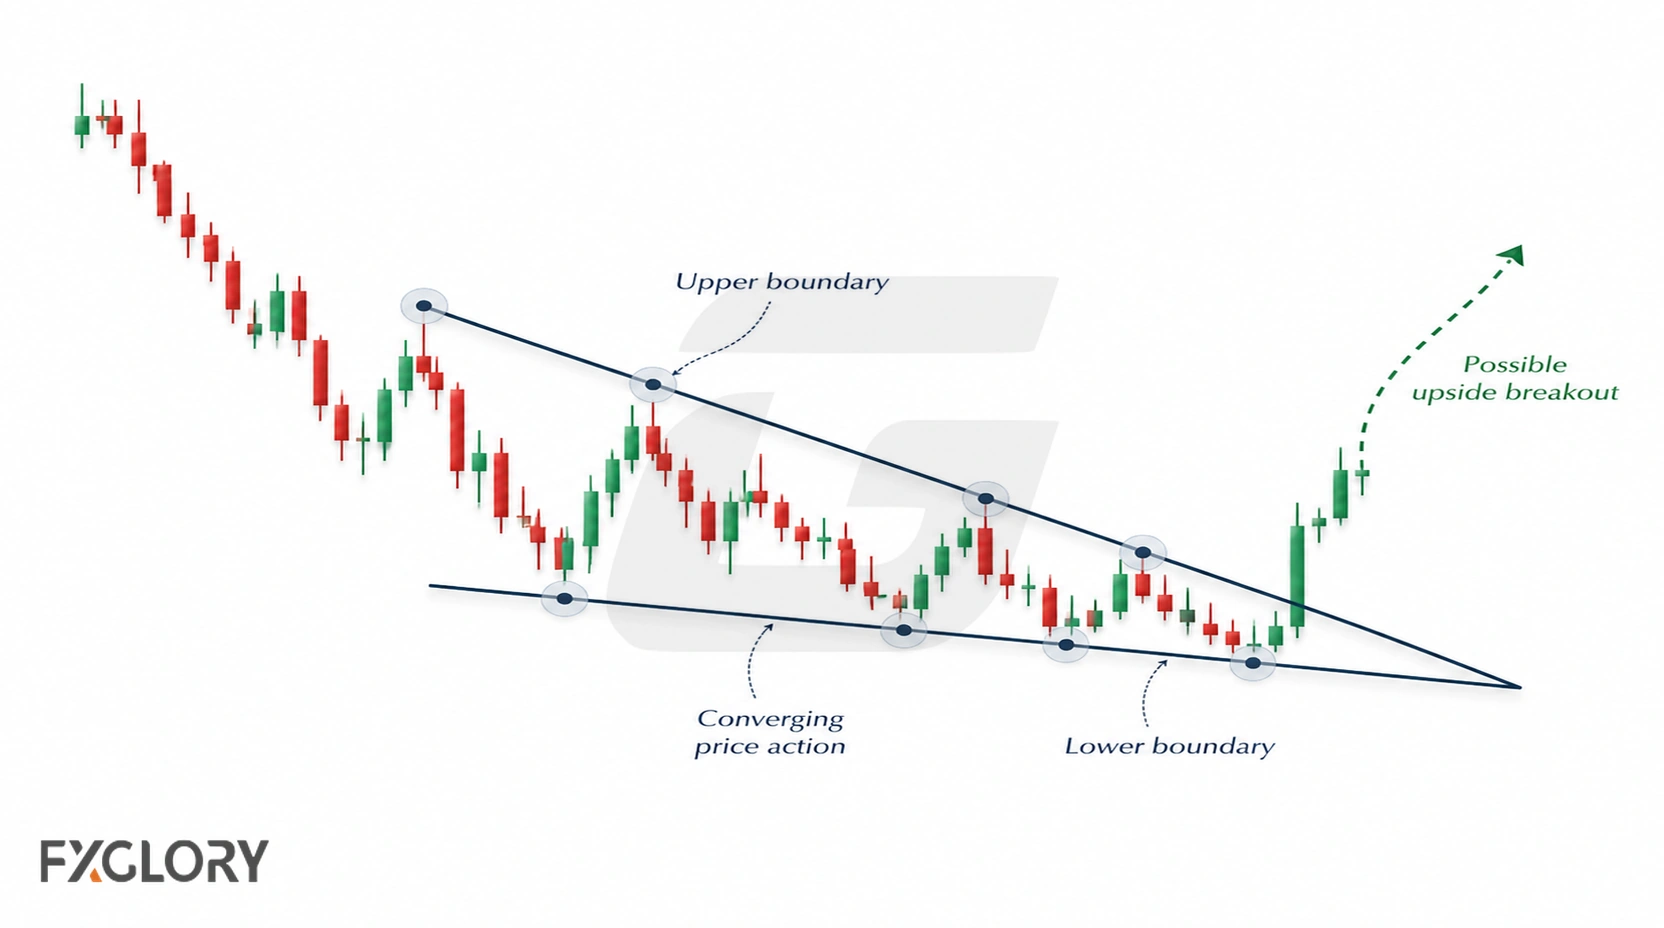
The conventional bullish interpretation is a bias, not a direction forecast. Its significance differs when the wedge ends an extended move versus when it forms as a pullback inside a broader uptrend.
| Feature | Falling Wedge Reading | Careful Use |
|---|---|---|
| Shape | Downward-sloping narrowing structure | Both boundaries should be visible without forcing them |
| Common bias | Often watched for bullish pressure | Bias is not confirmation |
| Possible reversal context | May appear after a mature downward move | Needs evidence that downward pressure is weakening |
| Possible continuation context | May appear as a pullback inside a broader uptrend | Needs broader trend context and confirmation |
| Main failure risk | Price holds inside or breaks below the wedge instead | Invalidation should be defined before focusing on direction |
Wedge Reversal vs Wedge Continuation
Prior trend and pattern location determine the scenario. The same wedge orientation may signal potential exhaustion at the end of a move or a pause against the dominant trend. The table distinguishes these cases.
| Wedge Situation | Possible Reading | What to Check |
|---|---|---|
| Rising wedge after a mature upward move | Possible bearish reversal scenario | Whether upward pressure is weakening and the lower boundary fails |
| Rising wedge during a broader downtrend | Possible bearish continuation scenario | Whether the wedge acts as a pullback and price confirms lower |
| Falling wedge after a mature downward move | Possible bullish reversal scenario | Whether downward pressure is weakening and the upper boundary breaks |
| Falling wedge during a broader uptrend | Possible bullish continuation scenario | Whether the wedge acts as a pullback and price confirms higher |
| Wedge in unclear market structure | Neutral or messy compression | Whether the broader chart gives enough context to use the pattern |
For deeper treatment, see continuation patterns and reversal patterns.
Strong vs Weak Forex Wedge Patterns
Pattern quality concerns how reliably the boundaries and surrounding chart can be identified. It is separate from whether a later trade succeeds: even a clearly drawn wedge can break in the unexpected direction.
| Chart Factor | Stronger Wedge Condition | Weaker Wedge Condition |
|---|---|---|
| Slope | The whole structure clearly leans upward or downward | The shape looks more like random sideways movement |
| Boundaries | Both trendlines are visible without forcing them | The lines depend on one isolated wick or repeated adjustment |
| Compression | Price movement becomes clearly narrower | Price swings stay wide, messy, or inconsistent |
| Touches | Several reactions help define both sides of the wedge | The structure relies on too few reactions or after-the-fact drawing |
| Context | The wedge forms in a market condition that is easy to describe | The surrounding chart is unclear or already noisy |
| Breakout behavior | Price breaks, closes, retests, or holds outside the wedge | Price spikes briefly and returns inside the structure |
| Risk plan | Invalidation is defined before acting | The trader sees a target but not the wrong point |
Do not infer statistical reliability from the word “strong”; the table describes visual and planning quality, not verified win rates.
How to Confirm a Forex Wedge Pattern
Bias is an expectation based on pattern shape and trend context. Breakout evidence begins when price moves through a boundary; a candle close beyond it can be one confirmation rule. A successful retest or sustained movement outside provides later follow-through evidence. A rejection at an intact boundary can inform a pre-breakout setup, but does not confirm a breakout that has not occurred.
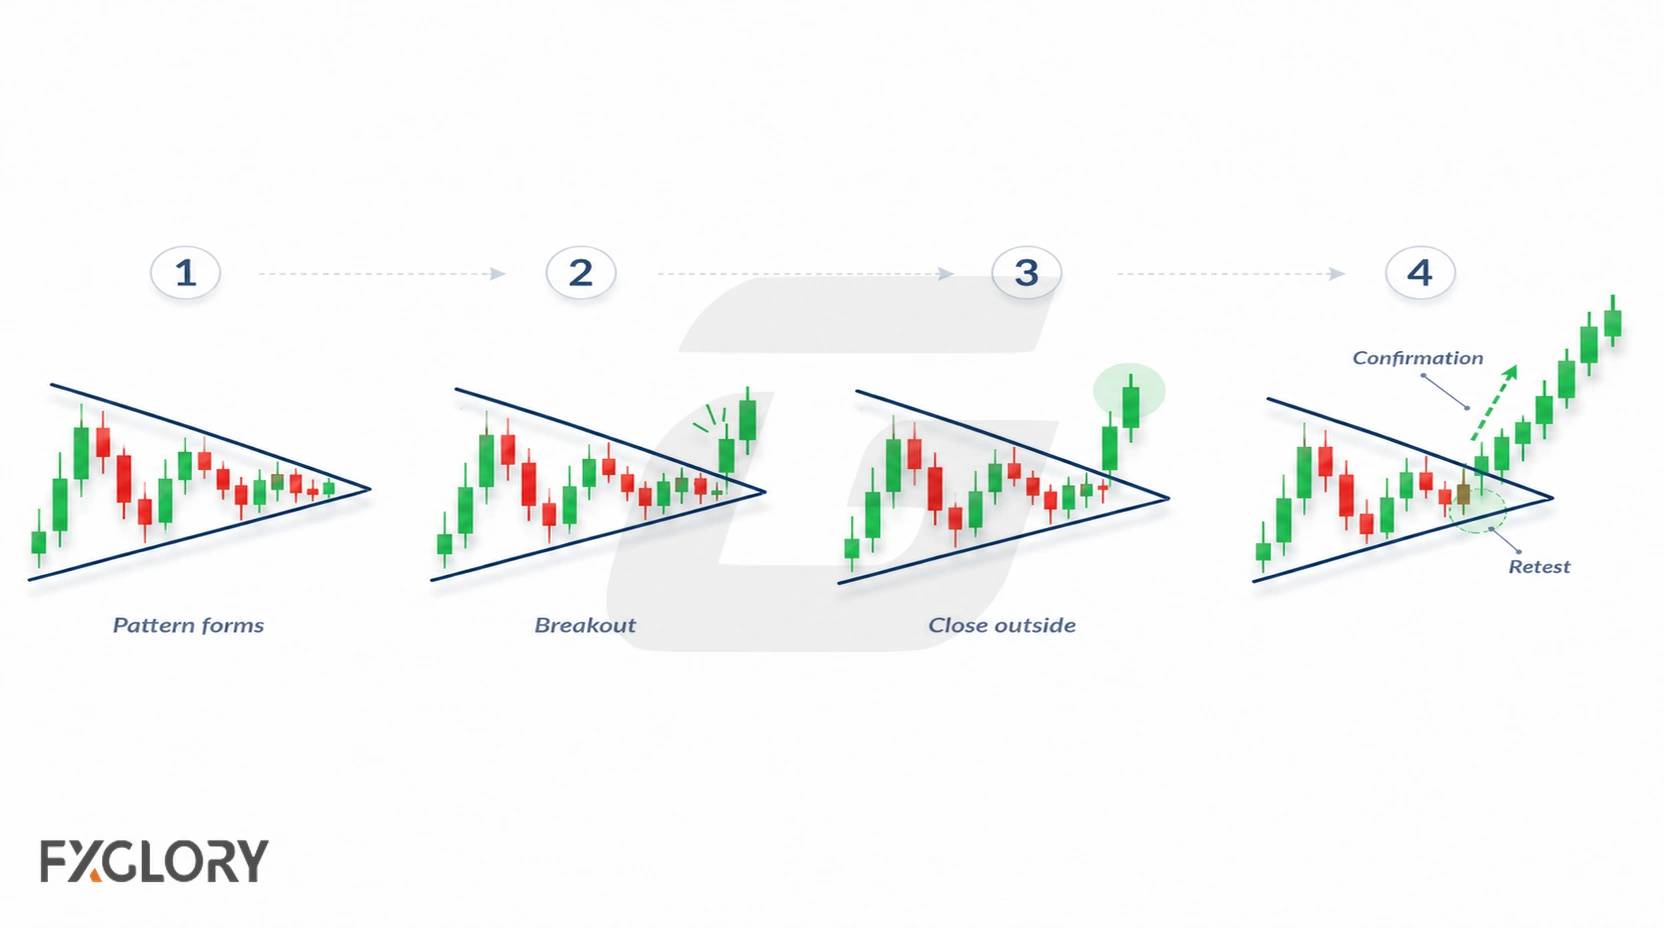
- Read the context: Identify the preceding trend and relevant support or resistance.
- Draw the shape: Use repeated visible reactions to mark converging boundaries and check the overall slope and narrowing width.
- Select the scenario: State which boundary or rejection is relevant and which candle-close or retest rule, if any, counts as evidence.
- Define invalidation: Specify a price level or event that contradicts the proposed entry; do not use the wedge name as a stop rule.
- Account for execution: Review the session, news risk, spread and potential slippage before choosing position size.
- Record the outcome: Evaluate the same predefined conditions across examples, including failed breaks.
For more detailed execution approaches beyond pattern recognition, see the forex breakout strategy.
Invalidation: When the Wedge Idea Fails
Distinguish a pattern that cannot be identified reliably from a valid pattern followed by a failed breakout. Neither guarantees that a particular stop has been reached; trade invalidation depends on the entry method.
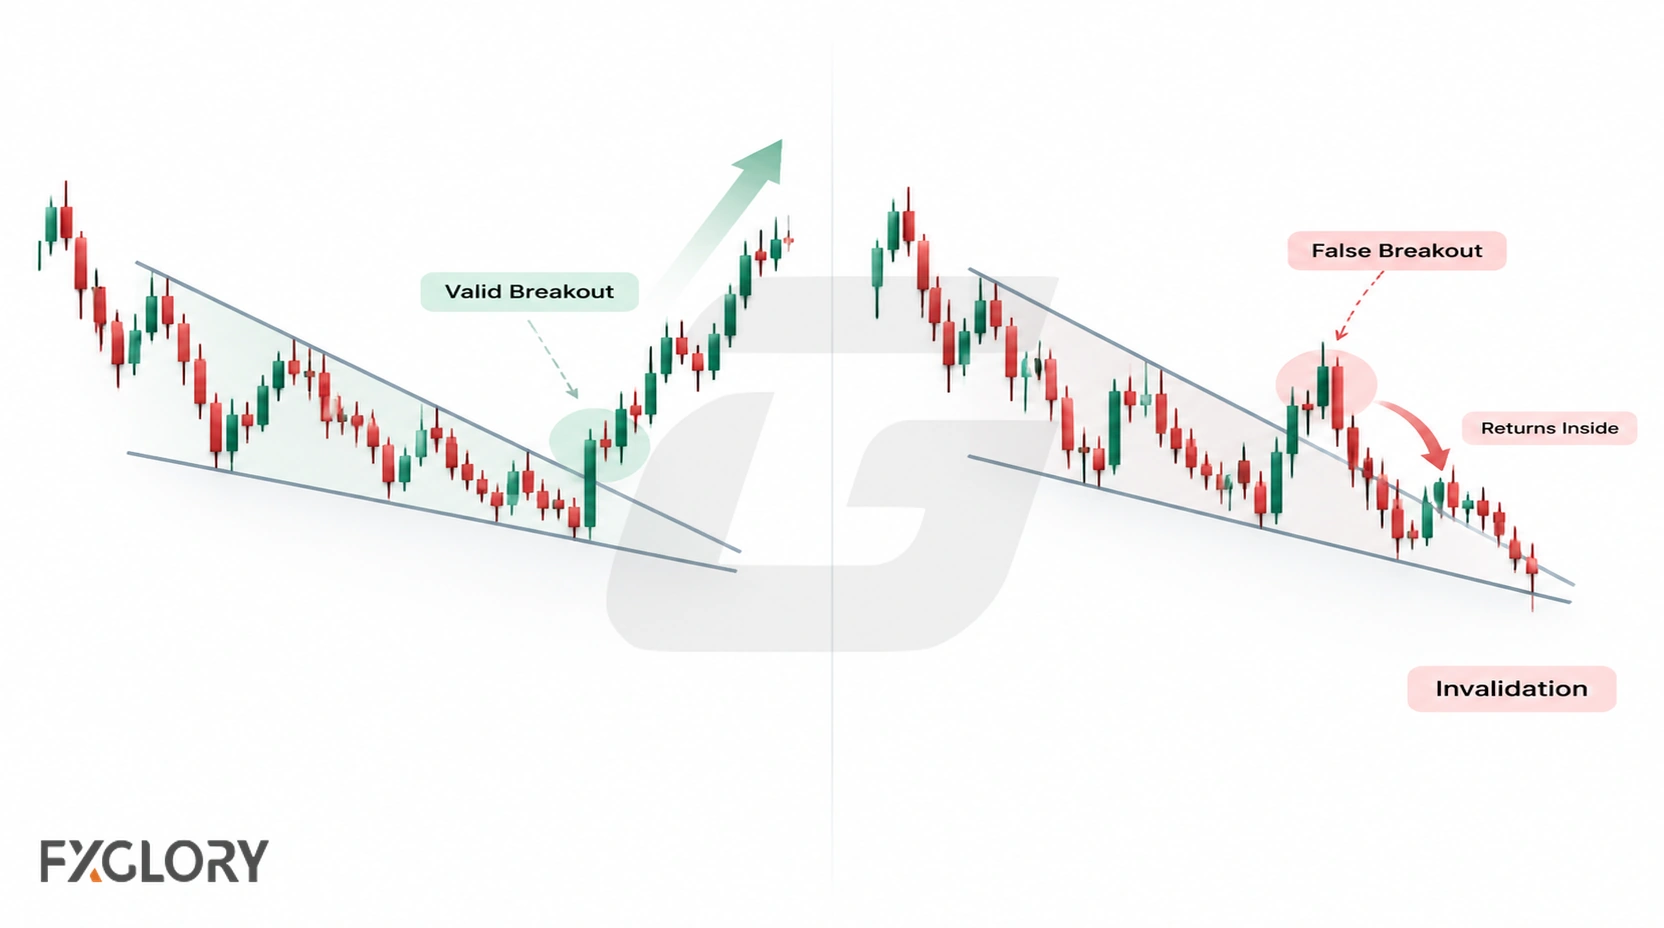
- Unreliable formation: Boundaries require constant adjustment or too few independent swing reactions to define a wedge.
- Loss of practical clarity: Price drifts close to the theoretical apex without a meaningful resolution, leaving little room for a clear boundary test. No universal apex cutoff applies.
- Failed breakout: Price moves beyond a boundary and returns inside; whether this cancels a trade depends on its rules and the subsequent price behaviour.
- Opposite-side resolution: Price moves through the other boundary, undermining the initial directional bias.
- Trade invalidation: The planned stop or structural level is reached under the specific setup's exit rule.
A projected objective based on wedge height or a previous swing is an estimate, not a guaranteed destination. Define the invalidation and cost assumptions before assessing potential reward.
Wedge vs Triangle vs Pennant
Wedges and symmetrical triangles both narrow, but a wedge's two boundaries generally slope the same way; a symmetrical triangle has a descending upper boundary and an ascending lower boundary. Ascending or descending triangles can have one approximately horizontal edge. Pennants are typically compact consolidations after a sharp move.
| Structure | Quick Clue | Careful Reading |
|---|---|---|
| Wedge | The narrowing structure usually slopes upward or downward | Read slope, location, trend context, and boundary behavior together |
| Triangle | Price compresses between converging or partly converging boundaries | Can be continuation, neutral, or reversal-like depending on context |
| Pennant | A compact compression often forms after a sharp directional move | Usually smaller and more closely tied to a prior impulse move |
See forex triangle patterns or pennant patterns for their distinct formation criteria.
Forex Context: Sessions, News, Spread, Slippage, and Volume
A wedge visible on a chart may still be difficult to trade in particular conditions. Spread, slippage and liquidity change the distance between a chart level and an executable fill, especially around scheduled economic announcements.
- Session behavior: Breakout attempts during active sessions may behave differently from moves during thin liquidity.
- News events: Economic releases and central-bank comments can overpower technical compression quickly.
- Spread and slippage: Fast movement around wedge breakouts or retests can affect execution and risk.
- Pair behavior: Different currency pairs may compress, break, or retest in different ways.
- Timeframes: A lower-timeframe wedge can conflict with a stronger higher-timeframe support, resistance, or trend area.
- Volume limits: Spot forex does not have one centralized exchange volume figure, so volume-style readings need careful interpretation.
Spot-forex tick activity is feed-dependent rather than consolidated global volume; for detail see tick-volume reading in forex.
Using Indicators and Candles With Wedge Patterns
Supporting tools should answer questions the wedge geometry alone cannot: momentum, broader trend, volatility, candle reactions or trading activity.
| Tool Type | What It Can Help Read | Careful Use |
|---|---|---|
| Momentum indicators | Whether pressure is building, fading, or diverging | Momentum can shift before or after the breakout and still needs context |
| Trend indicators | Whether the broader trend supports a continuation or reversal reading | They may lag during compression |
| Volatility indicators | Whether movement is contracting or expanding | High volatility can increase execution risk around breakouts |
| Candlestick reactions | Short-term rejection or hesitation near a wedge boundary | One candle is not the same as a full wedge structure |
| Tick activity | Activity around a boundary break or retest | It is supporting context, not centralized market volume |
MACD and RSI can describe momentum; ATR measures recent price-range variation; and candlestick behaviour shows shorter-term reaction around a boundary. None independently validates a wedge breakout.
Example: Reading a Wedge Pattern on EUR/GBP
Hypothetical scenario, not an observed EUR/GBP setup: Suppose EUR/GBP has risen into resistance while its successive swing highs advance less than its swing lows. The two upward-sloping boundaries converge, suggesting a rising wedge near a potential turning area.
A trader planning a bearish breakout might require a completed candle below the lower boundary, then place invalidation above a specified recent swing. An intrabar dip that closes back inside would not meet that particular entry rule. If the pair instead breaks and holds above the upper boundary, the expected bearish resolution is undermined.
This example illustrates how one fixed confirmation rule changes interpretation; it supplies no real-time price observation, entry price or tested performance result.
Common Mistakes With Forex Wedge Patterns
Beyond the formation and breakout issues described above, these operational mistakes can undermine a trading plan:
- Drawing with hindsight: Adjusting historical trendlines after seeing the outcome makes a wedge appear easier to recognize than it was in real time.
- Confusing chart levels with fills: Using idealized boundary prices without accounting for spread and slippage.
- Ignoring higher-timeframe levels: Overlooking nearby resistance or support that changes the interpretation of a breakout.
- Changing the signal rule mid-trade: Switching from a candle close to an intrabar touch or optional retest only after the initial plan fails.
A Safer Way to Read Forex Wedge Patterns
A wedge describes narrowing price movement, not the outcome of the next breakout. Its value is in making price structure and competing scenarios explicit. Once the formation is identified, use one consistent confirmation method and a separately defined trade plan rather than repeatedly redrawing the pattern to fit new candles.