
What Are Forex Technical Indicators?
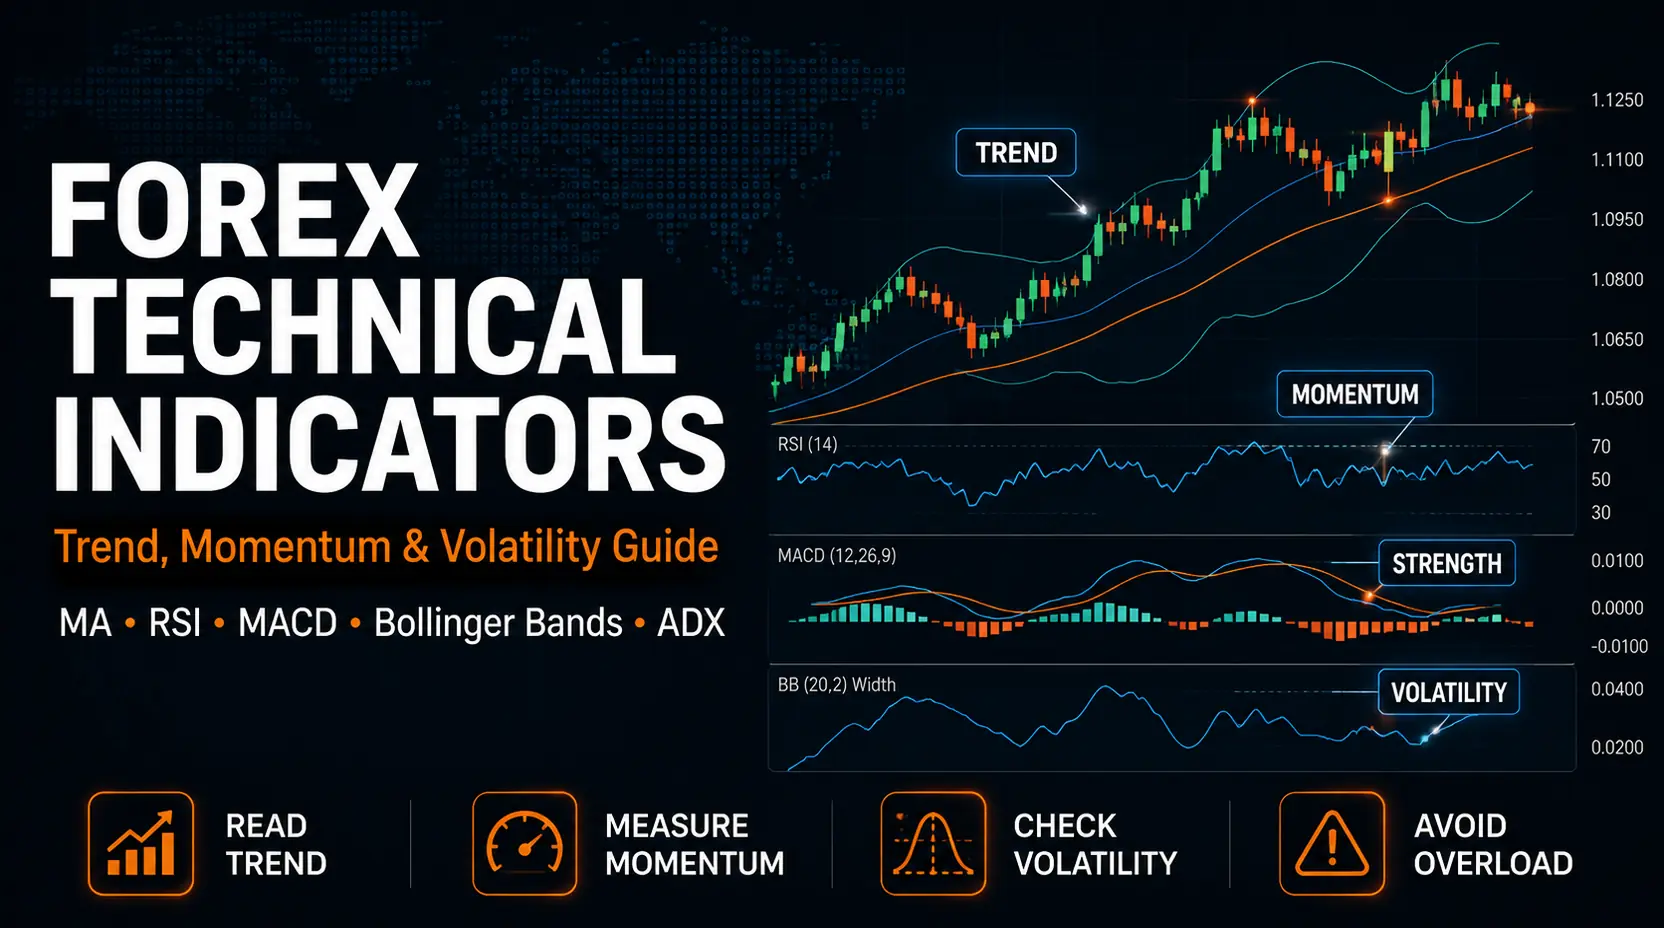
Forex technical indicators are chart tools calculated mainly from price data, and sometimes activity-style data, to help describe market conditions. Traders use them to study questions such as trend direction, momentum, volatility, trend strength, or whether recent movement is unusually extended.
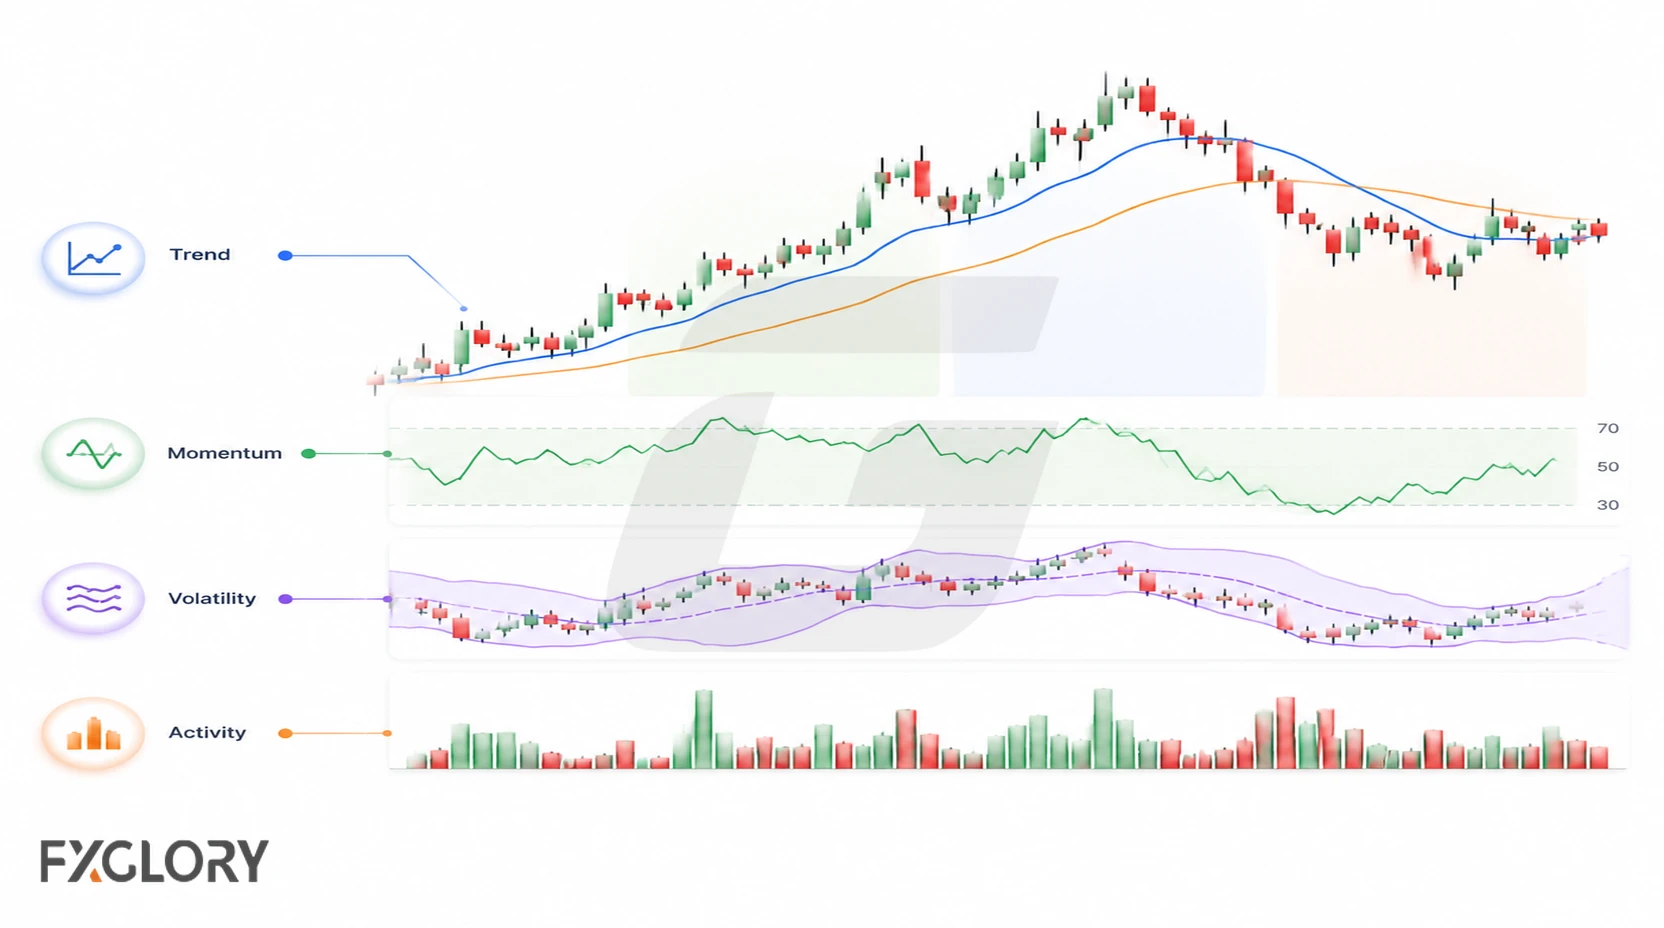
An indicator only displays what its formula calculates from the available data. It does not know the trader’s objectives, account size, risk limit, or whether the surrounding chart supports the same interpretation.
This guide focuses on technical indicators. For the broader chart-reading framework, start with technical analysis forex.
Is There a Best Forex Indicator?
There is no universal best or most accurate forex indicator for every pair, timeframe, trader, or market condition. Indicators are designed for different jobs, so the useful question is not “Which indicator is best?” but “What am I trying to measure?”
For example, a moving average may help describe trend direction, ATR may help describe recent volatility, and RSI may help describe momentum. Their usefulness depends on whether that information is relevant to the current chart and method.
Popularity, a high historical win rate, or labels such as “most accurate” and “non-repainting” do not prove that an indicator will work reliably in future conditions. A tool that appears useful in a strong trend may behave very differently in a choppy range, during a news event, or in thin liquidity.
Indicators Are Not Trading Strategies
An indicator and a trading strategy serve different purposes. The indicator produces a calculation or reading; a strategy defines how information is turned into decisions through rules for context, entry logic, invalidation, position size, risk, management, and when to stand aside.
A moving average crossover, an RSI reading, or a MACD signal may describe something happening on the chart. It does not create a complete trade plan by itself.
- Indicator: A tool that calculates and displays information from price or activity data.
- Signal: A condition a trader may watch, such as a cross, turn, level, band touch, or momentum shift.
- Strategy: A full set of rules for context, entry logic, invalidation, risk, management, and review.
This distinction matters because the same indicator reading can lead to different decisions under different strategy rules or market conditions.
Main Types of Forex Technical Indicators
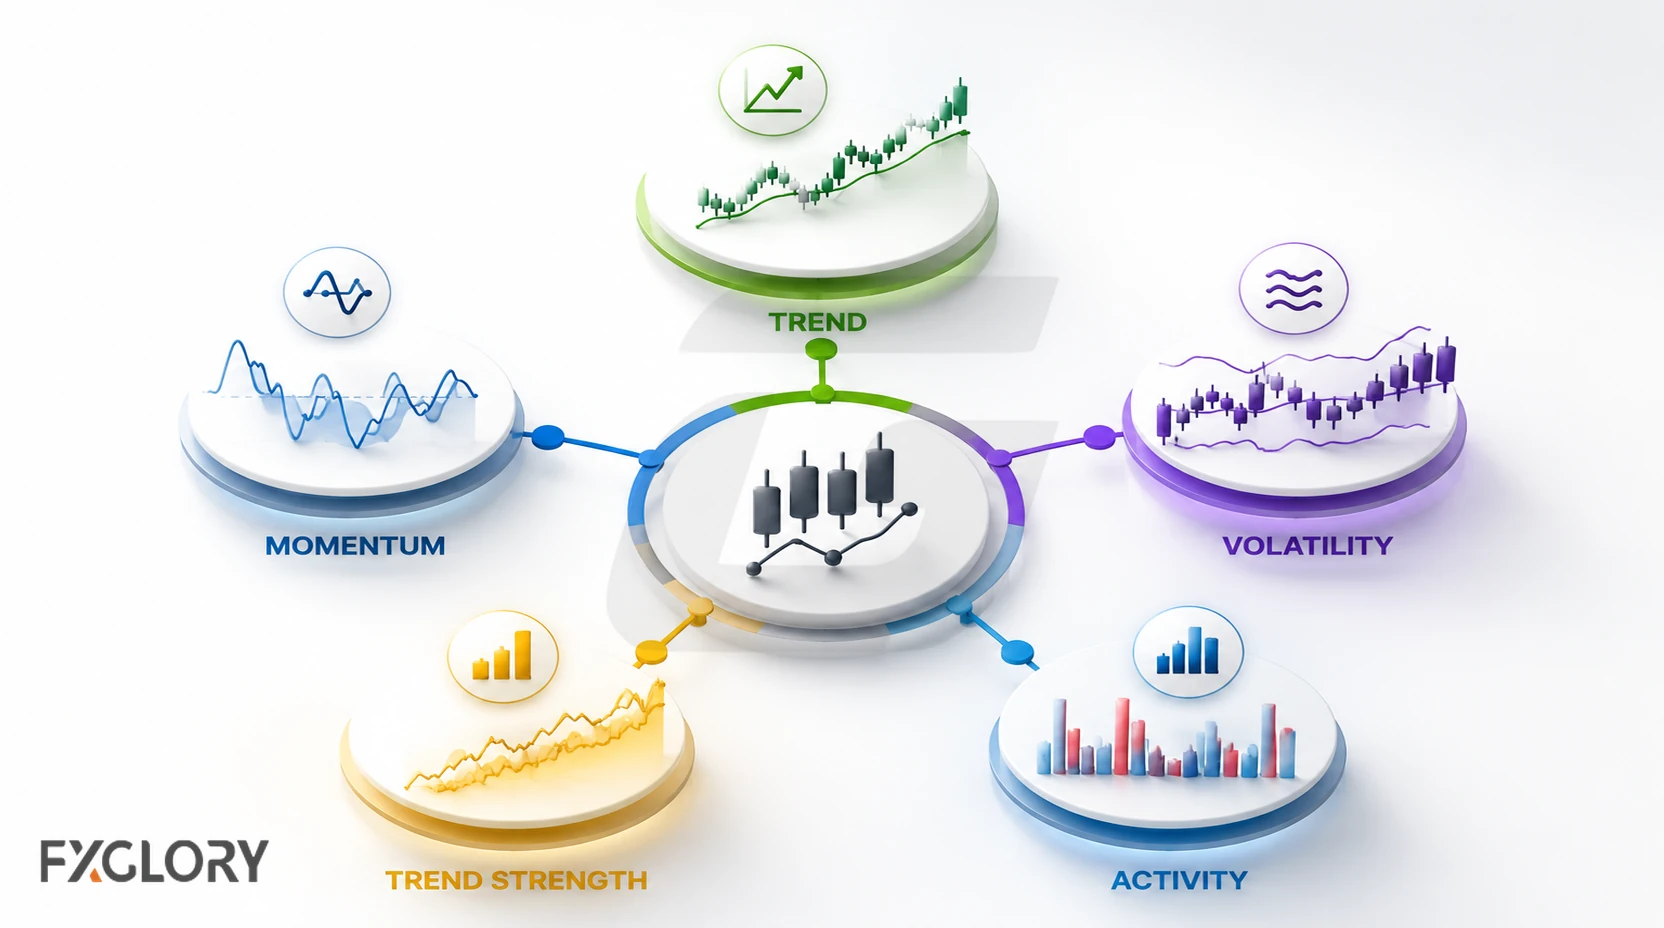
Forex indicators are easier to compare when they are grouped by the type of market information they describe. Grouping them by job also makes duplicated tools easier to spot.
| Indicator Type | What It Describes | Examples | Main Risk |
|---|---|---|---|
| Trend indicators | Direction or structure | Moving averages, Ichimoku, Parabolic SAR | Can lag after price has already moved |
| Momentum indicators | Speed or strength of price movement | RSI, MACD, stochastic oscillator | Can stay overbought or oversold in strong trends |
| Volatility indicators | Range expansion or contraction | Bollinger Bands, ATR | Do not show direction by themselves |
| Trend-strength indicators | Whether movement is strong or weak | ADX | Strength does not always identify direction |
| Activity or volume-style tools | Participation or activity context | Tick volume, OBV-style tools | Spot forex does not have one complete centralized volume feed |
The indicator type matters because a trader should know what question the tool is supposed to answer before using it.
Popular Forex Indicators by Job
The indicators below are widely used because they summarize different aspects of price behavior. Understanding each tool’s job is more useful than treating the list as a ranking.
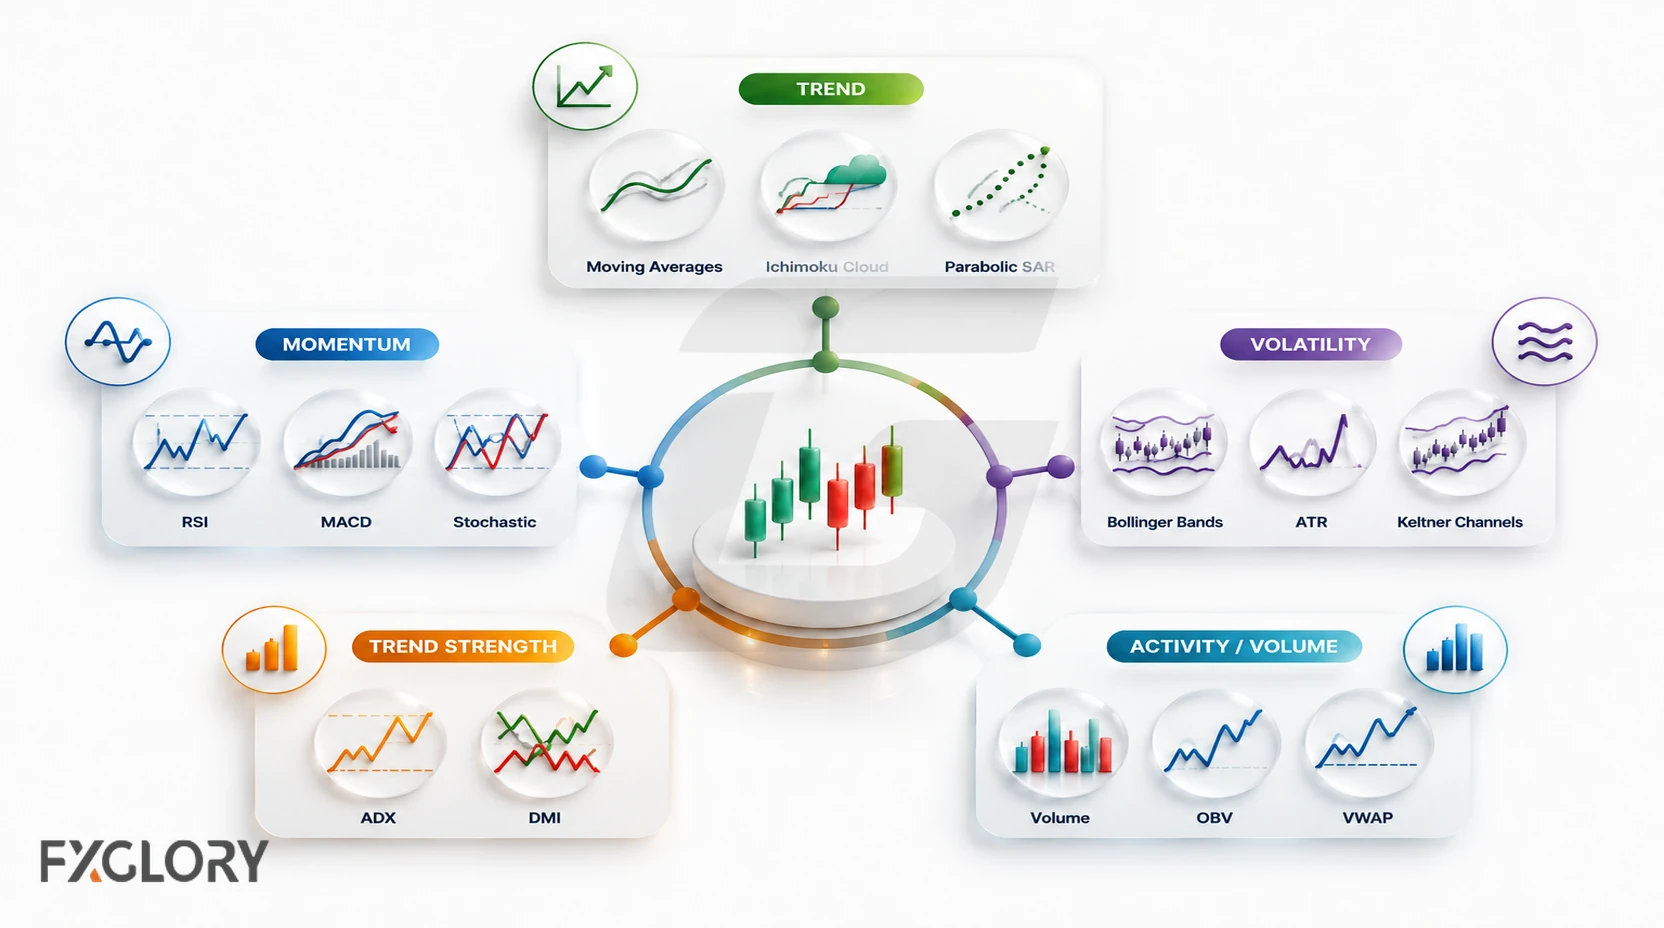
- Moving averages: Often used to smooth price movement and describe trend direction or dynamic reference areas.
- RSI: A momentum oscillator often used to describe overextended or shifting momentum conditions.
- MACD: A momentum and trend-following tool often used to compare moving-average relationships and momentum shifts.
- Stochastic oscillator: A momentum tool often used to compare closing price behavior within a recent range.
- Bollinger Bands: A volatility tool that shows price movement around a moving average and band expansion or contraction.
- ATR: A volatility tool that helps describe how much price has been moving over recent periods.
- ADX: A trend-strength tool that helps describe whether a market is showing stronger or weaker directional movement.
- Parabolic SAR: A trend-following tool that may help describe trend direction or possible trailing reference points.
- Ichimoku: A multi-part indicator that may describe trend, momentum, and support or resistance context.
Leading, Lagging, and Repainting Indicators
Many forex indicators are based on past price data, so they can lag. A lagging indicator may react after price has already moved. This does not make it useless, but the trader should understand what the indicator can and cannot show.
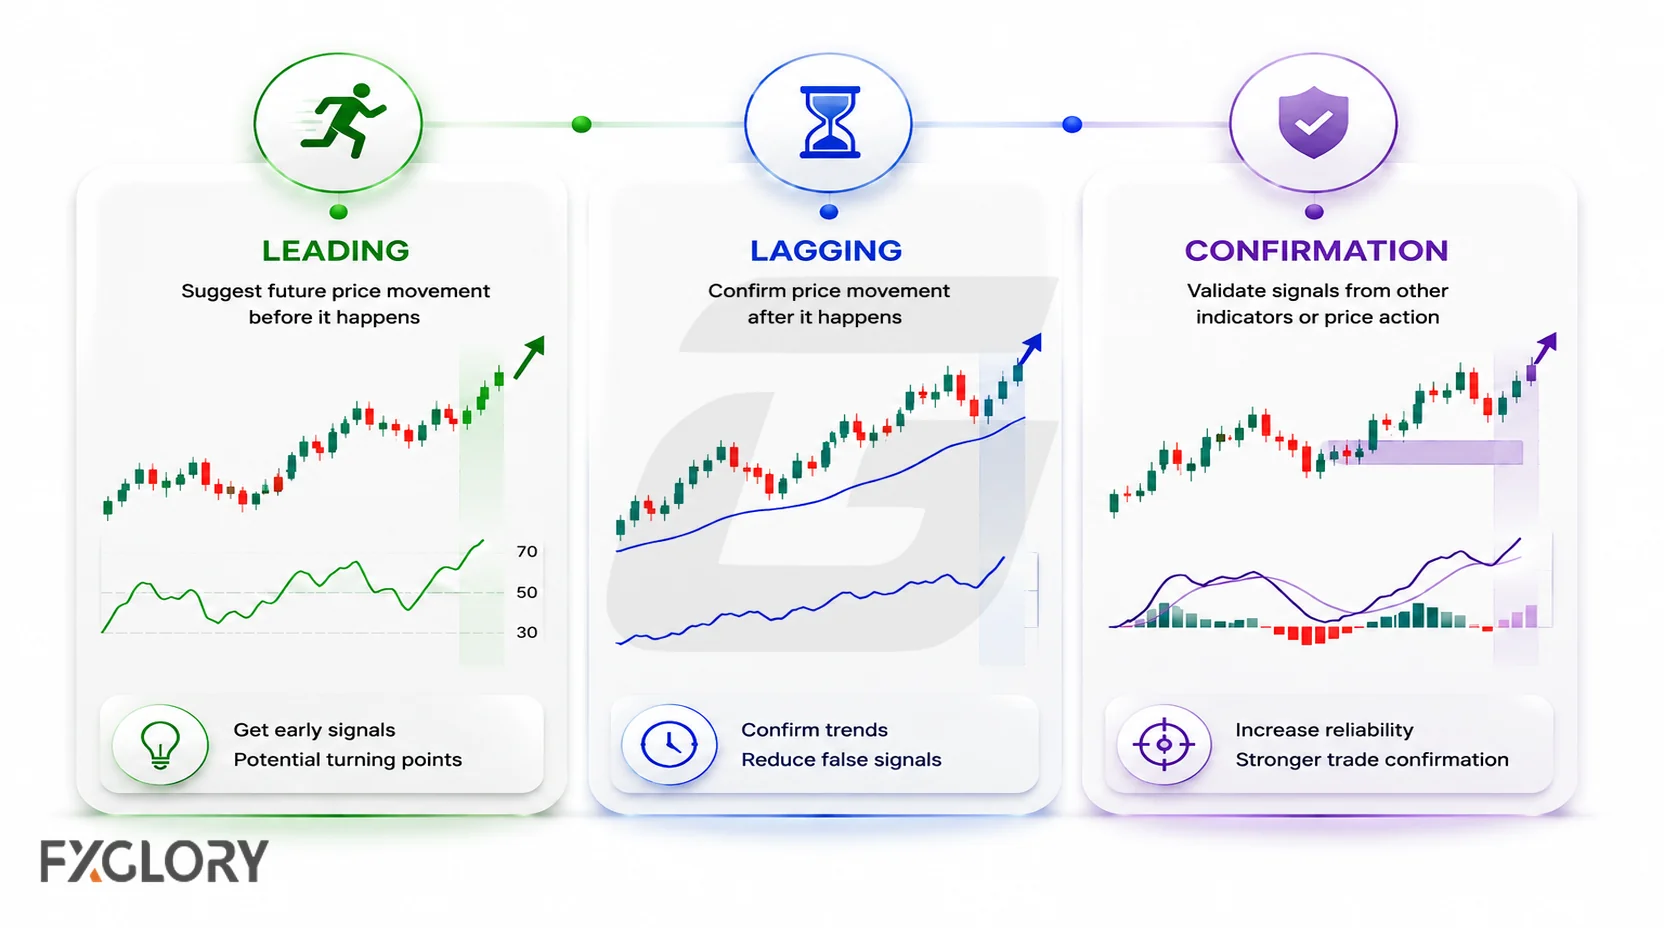
Momentum oscillators may appear to warn early, but they can also stay overbought or oversold during strong trends. A reading that looks stretched does not guarantee reversal.
Another distinction traders encounter is repainting. A repainting indicator may revise earlier plotted values or signals as new data arrives. A “non-repainting” indicator is generally intended to leave confirmed historical signals unchanged after the relevant bar closes, although behavior can depend on the indicator’s design and settings.
- Lagging behavior: The indicator reacts after price data has changed.
- Faster or leading-style behavior: The tool may respond earlier but can produce more false or premature signals.
- Repainting behavior: Earlier plotted information may change as new data arrives.
- Non-repainting behavior: Confirmed historical outputs are intended to remain fixed, but that does not guarantee accuracy or profitability.
Learning Indicators vs Following Live Indicator Summaries
A live indicator summary can show a current reading, but it does not know the trader’s timeframe, invalidation point, position size, or risk limit. It also does not know whether the trader is reading trend, momentum, volatility, or a broader chart structure.
Learning how an indicator works helps the trader decide whether a summary is relevant, incomplete, or unsuitable for the current chart. A rating or summary should not replace the trader’s own context check.
How to Combine Indicators Without Overload
Indicator overload happens when a trader adds too many tools to the same chart. More indicators do not automatically create better analysis.
Several indicators may measure similar information. For example, using multiple momentum tools can repeat the same message in different formats. That can create false confidence when they agree or confusion when they conflict.
- Use one tool per question: Choose indicators based on what they need to answer.
- Avoid duplicate signals: Do not stack several tools that measure the same condition.
- Keep price visible: Indicators should not hide the chart structure.
- Connect indicators to risk: A reading matters only if the trader can define invalidation and position size.
- Review results: If an indicator does not improve decision quality, remove it from the chart.
How to Choose a Forex Indicator
Start indicator selection with the information the analysis is missing. The same tool can be useful in one market condition and unhelpful in another, so its job should be clear before it is added to the chart.
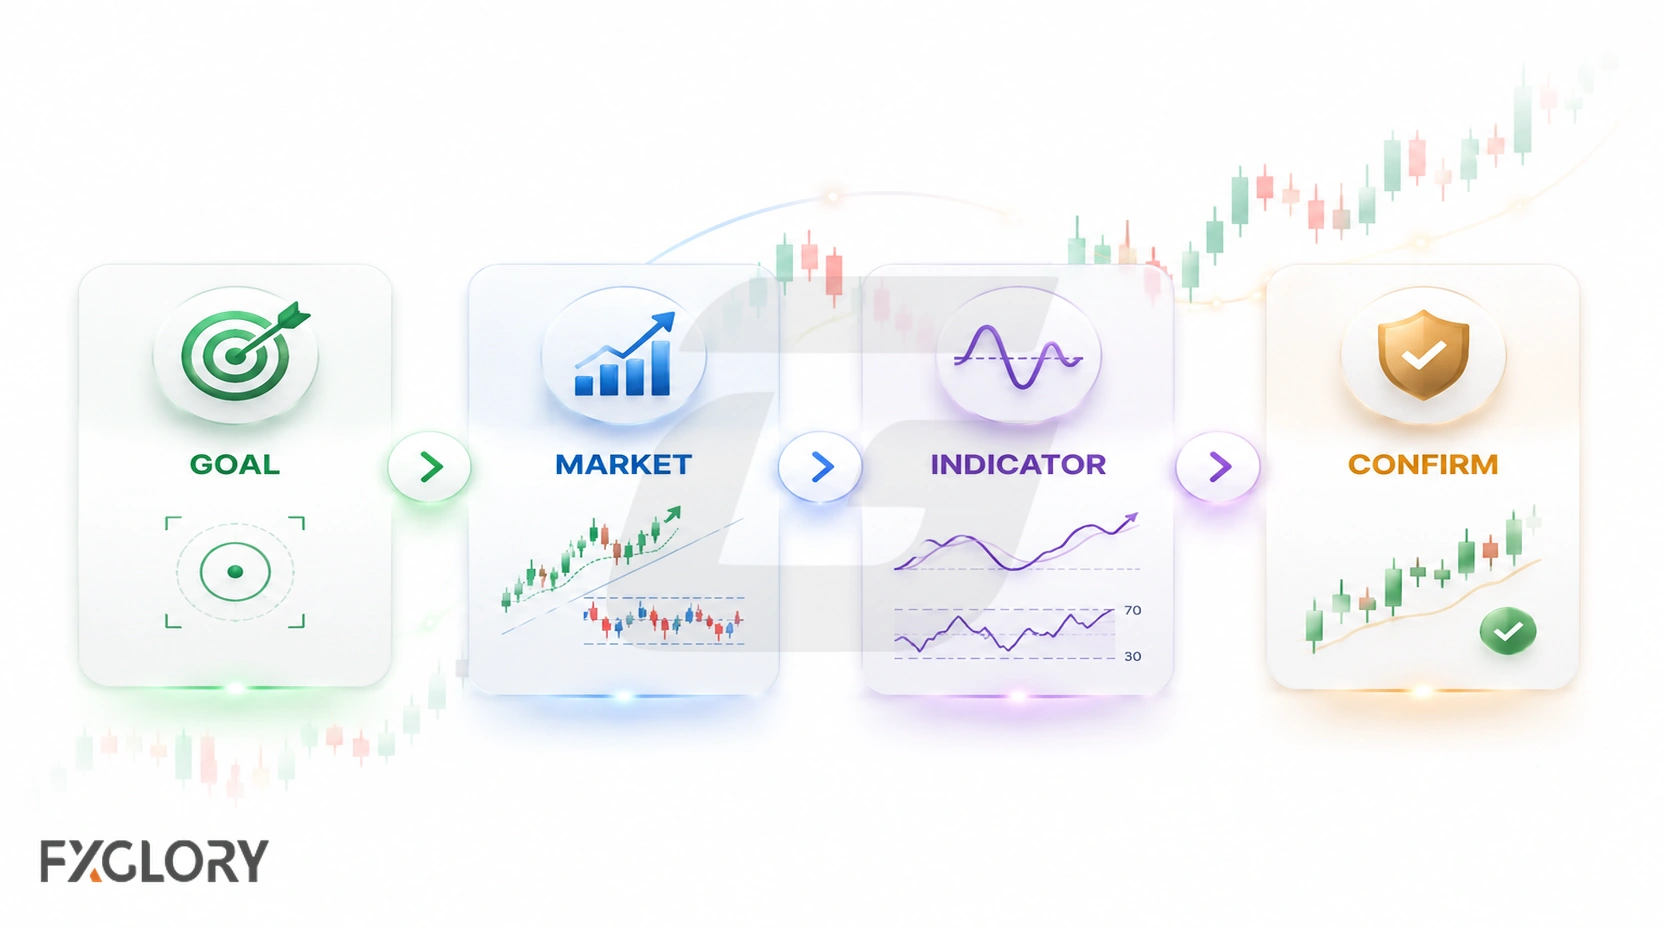
- Define the question: Is the trader trying to read trend, momentum, volatility, strength, or timing?
- Check market condition: Is price trending, ranging, compressing, or unclear?
- Avoid duplication: Does the indicator repeat another tool already on the chart?
- Match the timeframe: Does the indicator reading fit the timeframe being analyzed?
- Define invalidation: What would show that the indicator-supported idea is wrong?
- Check risk: Is the distance to invalidation acceptable for the account and plan?
- Review before live use: Practice in a demo environment before relying on the indicator with real money.
A forex indicator should make the scenario clearer, not add another layer of confusion.
Why Forex Indicators Fail
Forex indicators fail when the market does not behave in the way the indicator reading appears to suggest. This can happen even when the indicator is popular or commonly used.
- Changing market condition: A trend indicator may perform poorly in a choppy range.
- Strong trend pressure: Oscillators can stay stretched longer than expected.
- False confirmation: Multiple similar indicators can agree because they measure the same data.
- Late signal: A lagging indicator may react after the move has already happened.
- News volatility: Economic releases can overwhelm indicator readings quickly.
- Thin liquidity: Price movement can become sharper or less stable when fewer participants are active.
Common Mistakes With Forex Indicators
Indicator mistakes often come from treating a chart tool as a complete trading reason.
- Using too many indicators: A crowded chart can hide price structure instead of clarifying it.
- Stacking duplicate tools: Several momentum indicators may repeat the same message.
- Treating overbought or oversold as reversal: Momentum can stay stretched in strong trends.
- Ignoring market condition: An indicator that helps in a trend may behave poorly in a range.
- Changing settings after every loss: Constant adjustment can hide whether the tool is actually useful.
- Following summaries without a plan: A rating does not include the trader’s timeframe, invalidation, or risk limit.
- No invalidation rule: The trader uses an indicator signal without defining what price behavior would invalidate the underlying scenario.
Forex Context: Price, Volume, News, and Timeframes
Forex indicators should be read with market context because currency pairs trade across global sessions. Indicator behavior can change during active sessions, thin-liquidity periods, session overlaps, and high-impact news.
- Price-based calculations: Most indicators use past price data, so they describe what has already happened.
- Spot forex volume: Spot forex does not have one complete centralized exchange volume feed. Platform volume may reflect tick activity or broker/platform activity, not the full market.
- News events: Economic releases and central-bank events can invalidate indicator readings quickly.
- Timeframes: An indicator reading on a short timeframe may conflict with higher-timeframe structure.
- Pair behavior: Different currency pairs can show different volatility, trend behavior, and reaction patterns.
- Spread and slippage: Fast movement can affect entries, exits, and risk control around indicator signals.
The indicator reading only matters when the market condition, timeframe, and risk are clear.
Example: Using Forex Indicators on EUR/USD
Suppose EUR/USD is moving upward on the timeframe being studied. A trader may use a moving average to describe trend direction and a momentum indicator to observe whether momentum is strengthening, weakening, or stretched.
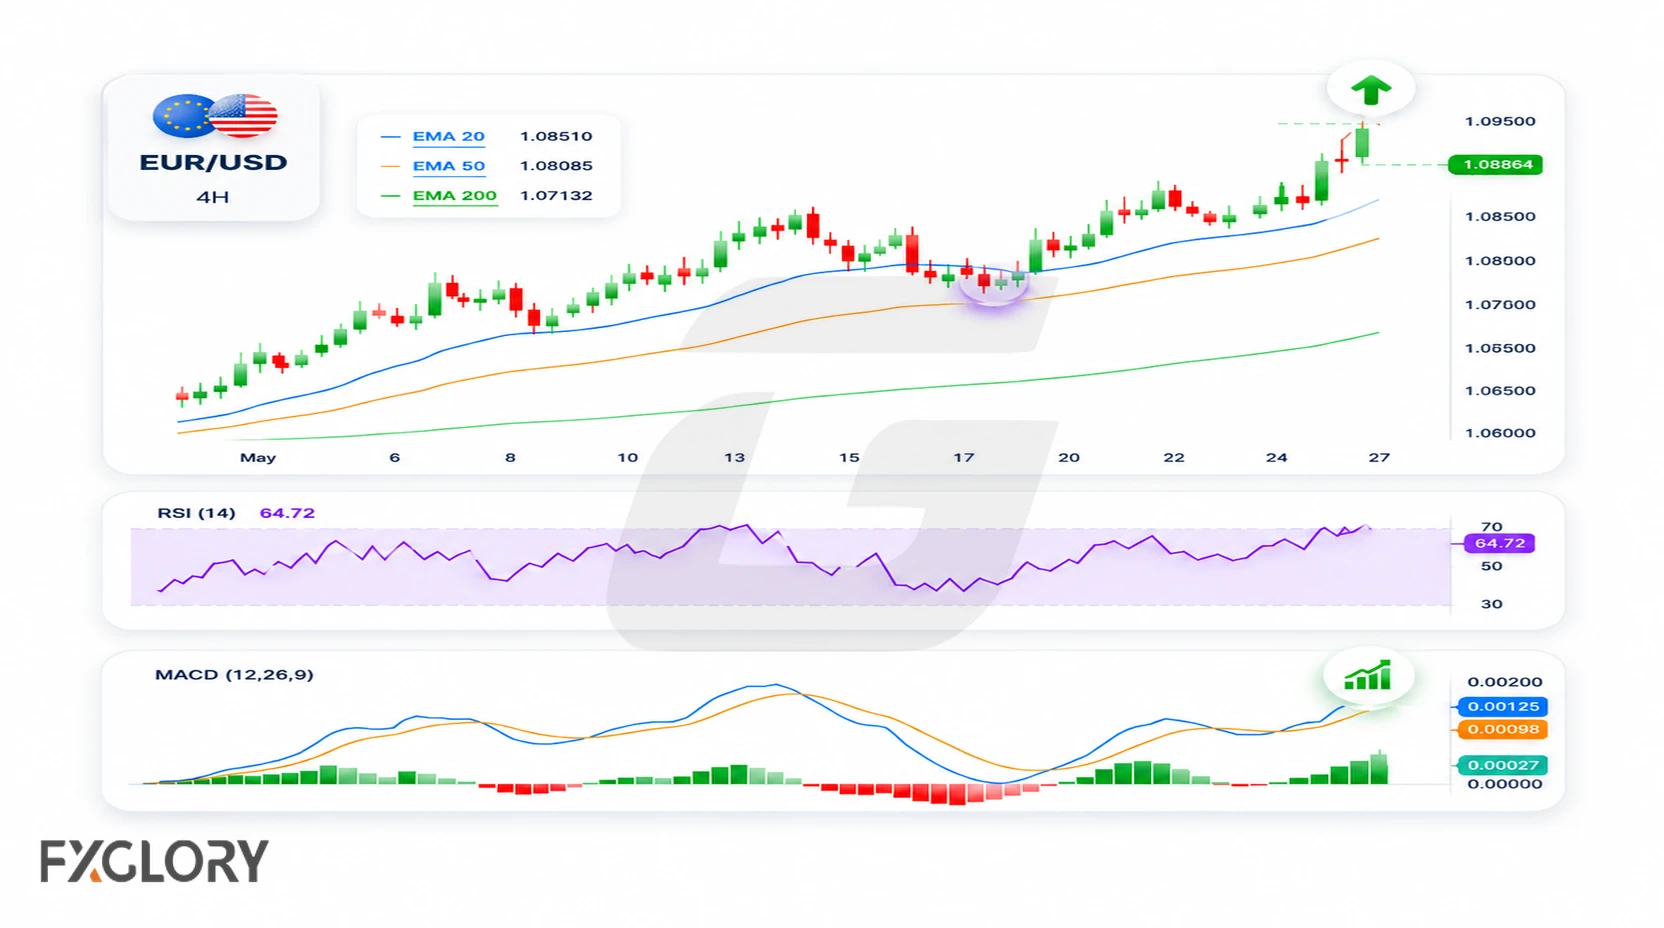
Those readings do not create a complete trade by themselves. If price is approaching a major reaction area, the trader should check the surrounding chart context. To understand how those areas work, see support and resistance in forex.
If high-impact news is near, or if the distance to invalidation is too large, the indicator reading may not be enough to support a live decision. The indicator-supported idea becomes more useful only when the trader can explain the market condition, the confirmation, the invalidation point, and the risk.
Without those parts, the indicator reading is not developed enough for a trading decision.
A Safer Way to Use Forex Technical Indicators
Forex technical indicators can make specific aspects of price behavior easier to measure and compare. The main task is to understand what each tool calculates, what type of market information it describes, and where its limitations appear.
For beginners, a small set of complementary indicators is usually easier to evaluate than a crowded chart. Use each tool for a defined purpose, compare its reading with price and timeframe context, and review whether it actually improves the consistency of the analysis.