

What Are Support and Resistance in Forex?
Support and resistance in forex are price areas where a currency pair has reacted before or where traders may watch for possible reaction. Support is usually an area below current price where buying interest may appear. Resistance is usually an area above current price where selling pressure may appear.
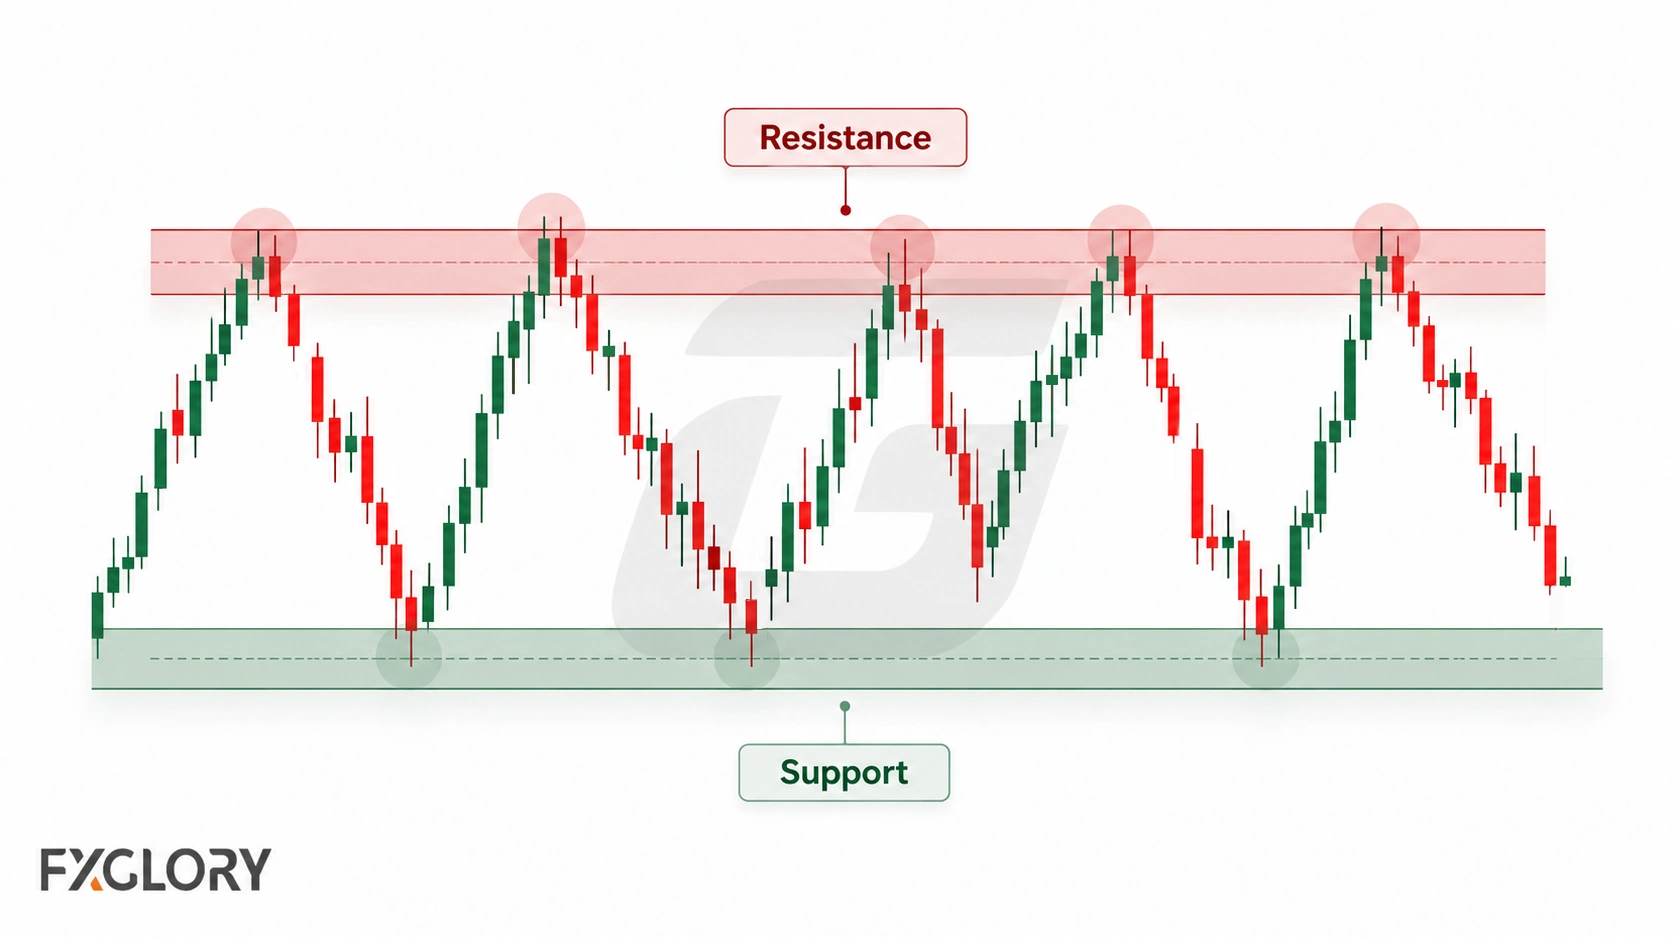
A support or resistance area marks where a reaction may occur, but price can also move through it. The useful question is how price behaves when it reaches the area.
This guide focuses on support and resistance levels. For the broader chart-reading framework, start with technical analysis forex.
Support and Resistance Are Zones, Not Exact Lines
Beginners often draw support and resistance as thin horizontal lines. A line can help mark the chart, but price rarely respects a level to the exact pip. In forex, it is usually safer to think in zones.
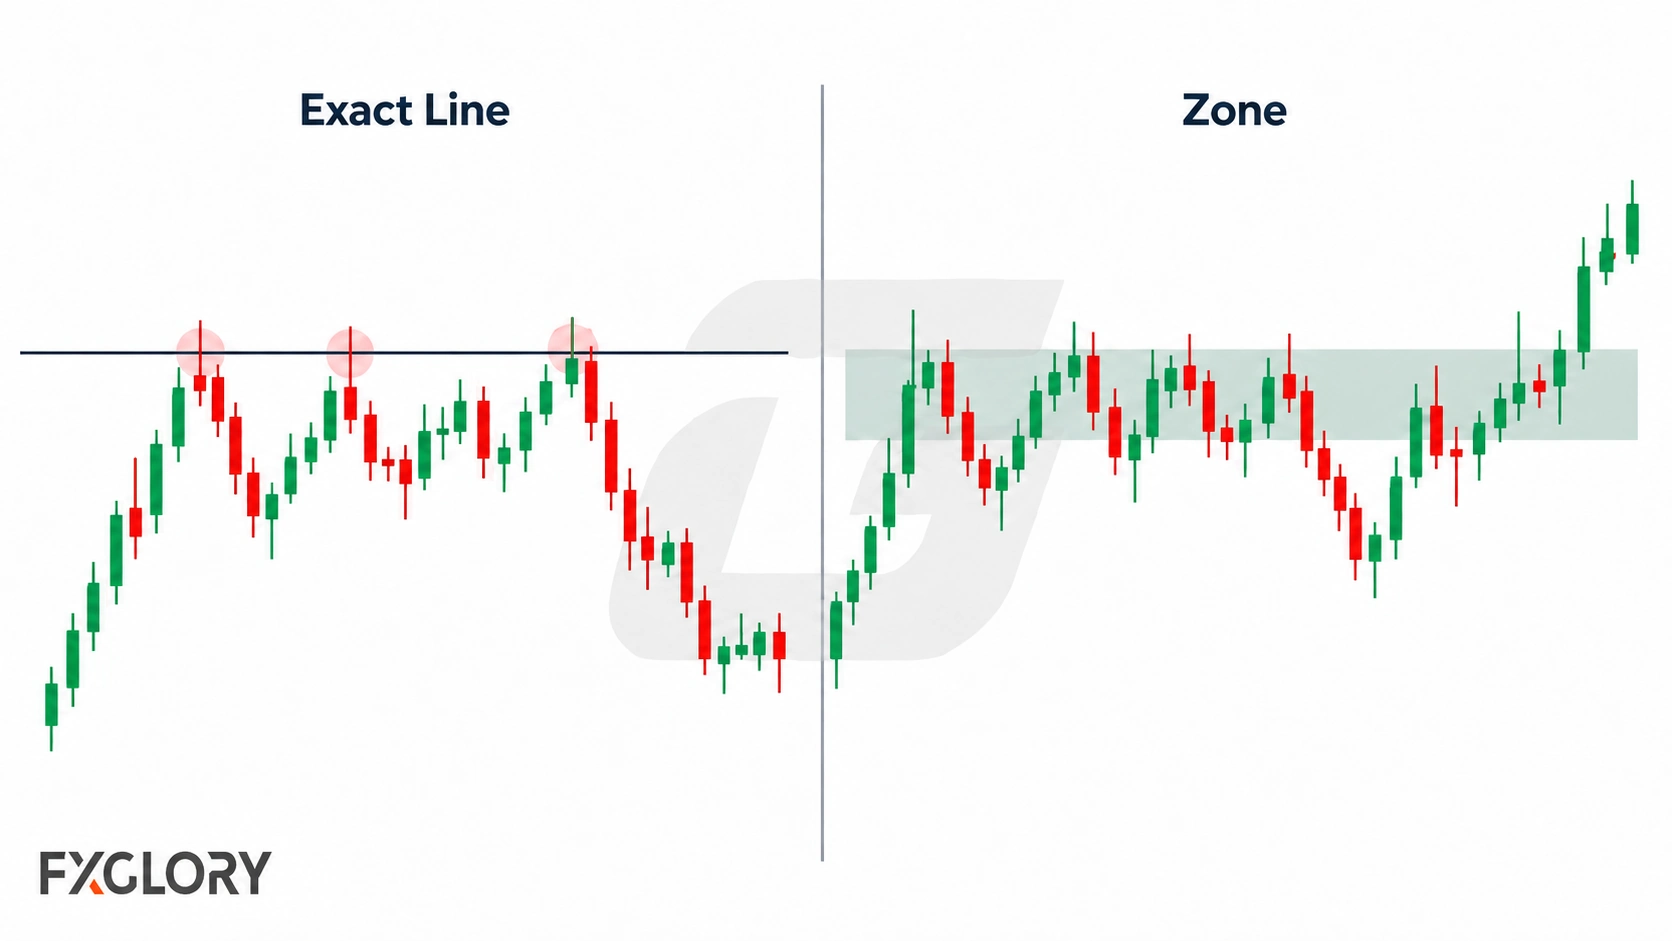
A support zone may include the area around a previous low, nearby candle wicks, and the range where price previously slowed or reacted. A resistance zone may include the area around a previous high, rejection wicks, and nearby closes that showed selling pressure.
Thinking in zones helps avoid overreacting when price moves slightly beyond a marked level. A small break may be noise, a test, a false break, or the start of a genuine breakout.
Why Support and Resistance Levels Form
Previous highs, lows, round numbers, and strong reaction areas can become widely watched chart references. Price may react around them for different reasons, including order placement, position adjustment, liquidity, or changing market expectations.
- Previous reactions: Price has already paused, rejected, or reversed near the area.
- Visible price structure: Prior highs, lows, and breakout areas are easy to identify on the chart.
- Round numbers: Clean price levels can attract attention because they are easy to recognize.
- Order and position management: Entries, exits, stops, or position adjustments may cluster around watched areas.
No single mechanism explains every reaction, so the level should be judged by current price behavior rather than by its label alone.
Types of Forex Support and Resistance Levels
Support and resistance can appear in different forms. Beginners should learn the main types without turning the chart into a crowded map of every small high and low.
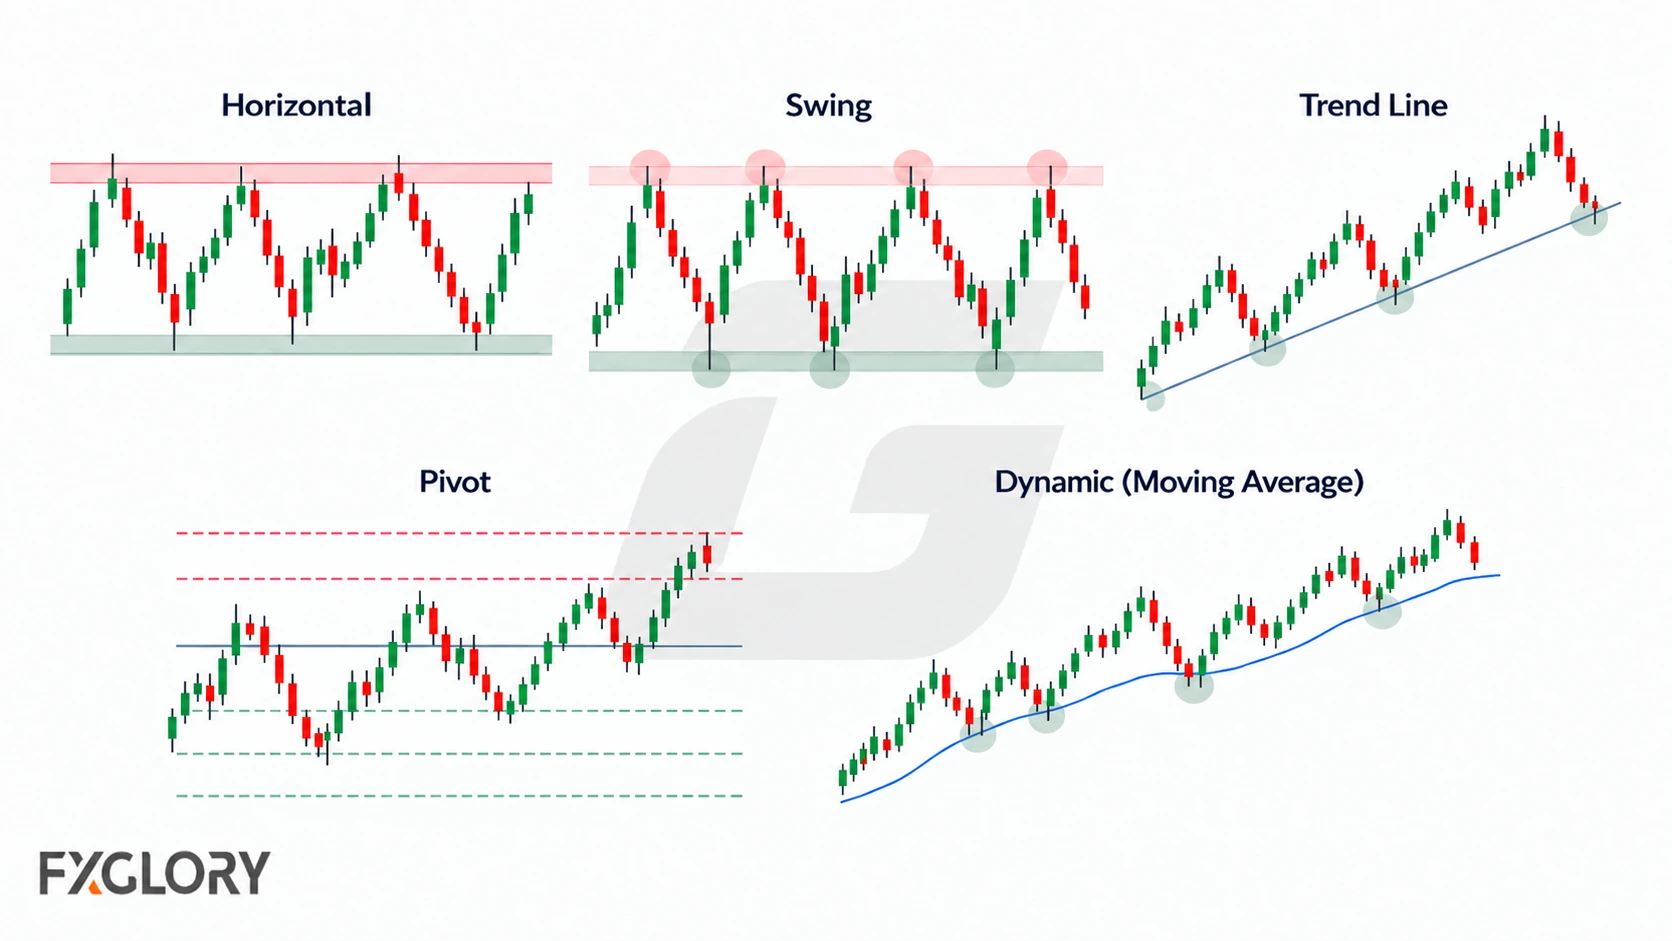
- Horizontal zones: Areas near previous highs, lows, closes, or repeated reactions.
- Swing highs and swing lows: Turning points where price previously changed direction.
- Round numbers: Clean price levels that traders may watch, such as prices ending in repeated zeros.
- Trend lines as diagonal support and resistance: Sloping areas drawn across rising lows or falling highs.
- Calculated forex pivot points: Formula-based levels created from previous session price data.
- Supply and demand zones in forex: Price-action areas where buying or selling pressure previously moved price away with force.
- Dynamic areas: Moving averages or other tools that traders may use as shifting reference areas.
- Session highs and lows: Highs and lows from important trading sessions or previous periods.
- Previous breakout areas: Areas where price broke through and may later return for a retest.
Each type is a reference point whose relevance depends on the current chart and timeframe.
Can Tools and Indicators Help Find Forex Support and Resistance?
Some tools calculate possible support and resistance, while others help traders visualize price structure. Their role is to organize analysis, not to turn every marked level into a signal.
- Pivot points: Calculate levels from previous session price data.
- Moving averages: Provide dynamic references that move with price.
- Bollinger Bands: Show dynamic bands that expand and contract with volatility.
- Fibonacci retracement: Marks percentage-based pullback areas that may overlap with existing structure.
- Trend lines: Visualize diagonal support or resistance across rising lows or falling highs.
- Supply and demand zones: Highlight price-action areas where price previously moved away with force.
Automatic tools can speed up level marking, but they can also create clutter or highlight areas that are unimportant on the trader’s timeframe. Check any calculated or drawn level against the underlying price structure.
How to Identify Support and Resistance in Forex
A useful level should be visible enough to explain without forcing the chart. If a trader has to zoom in heavily or draw too many lines, the chart may become harder to read.
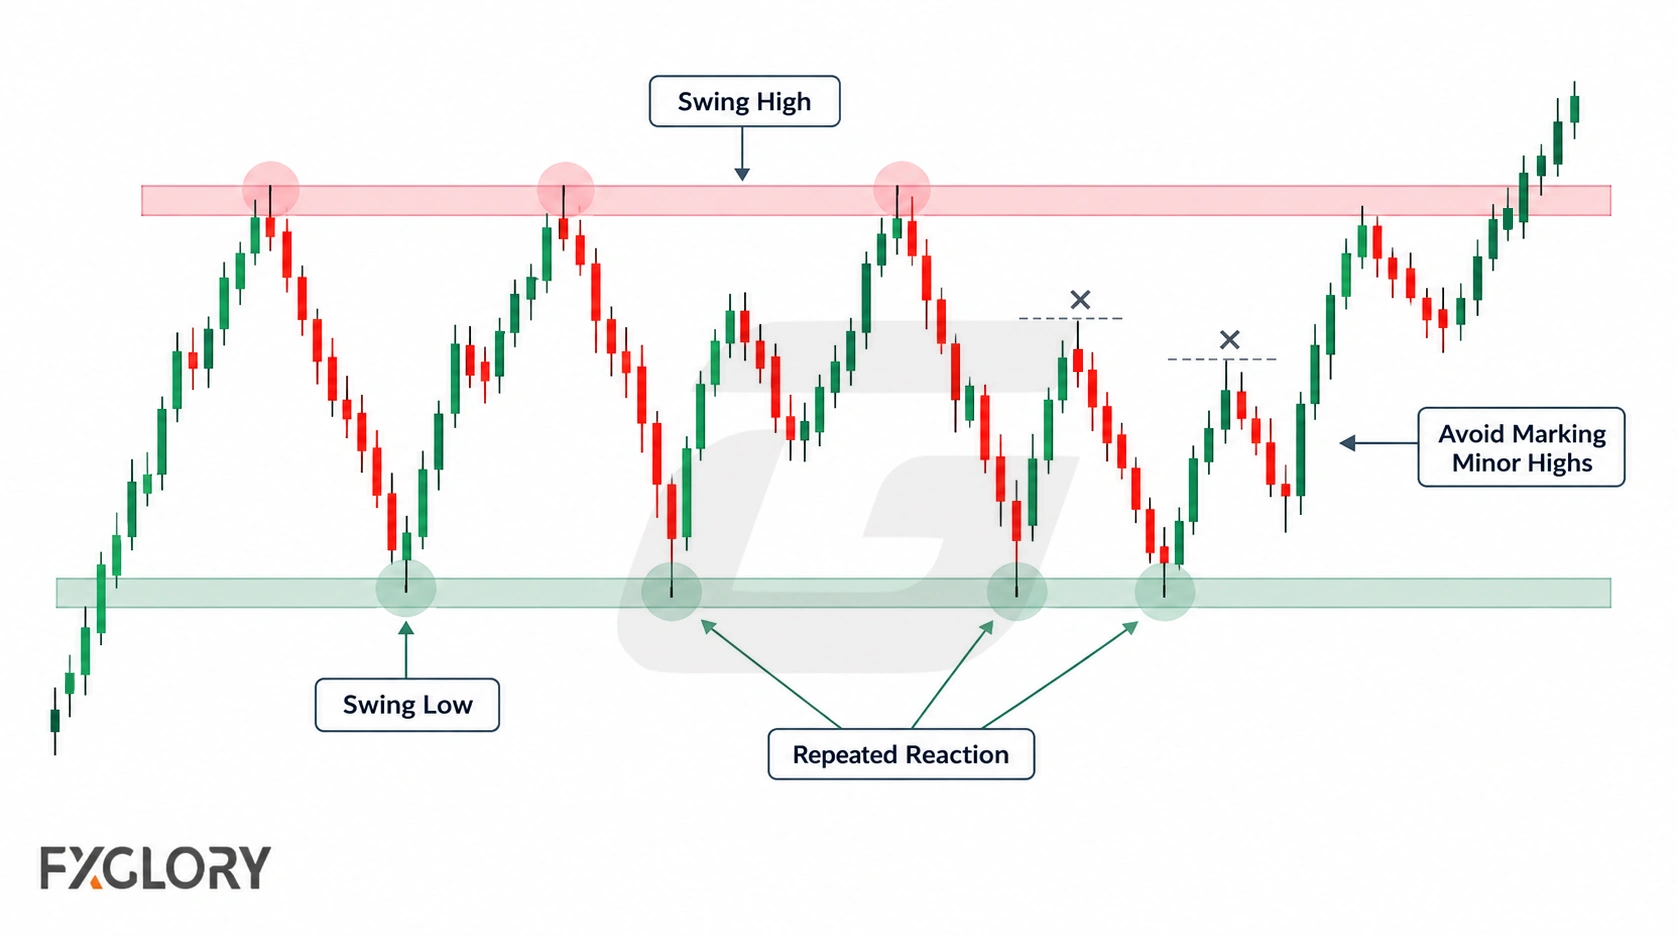
- Start with the relevant timeframe: Higher timeframes can help show broader structure, while lower timeframes can show short-term reactions.
- Find obvious swing highs and lows: Look for areas where price clearly turned, paused, or rejected.
- Mark the reaction area: Include nearby wicks, closes, and repeated reactions instead of forcing one exact price.
- Look for repeated reactions: A zone that price has respected more than once may be more visible to traders.
- Compare indicator levels carefully: If a tool marks a level, check whether price structure also supports it.
- Avoid chart clutter: Do not mark every minor high and low.
- Check current price behavior: A level matters more when price is reacting near it now.
- Define a wrong point: Decide what price behavior would show that the zone is no longer useful for the idea.
Bounce, Breakout, Retest, and False Break Scenarios
Support and resistance do not create one fixed outcome. The same zone can lead to different scenarios depending on how price behaves around it.
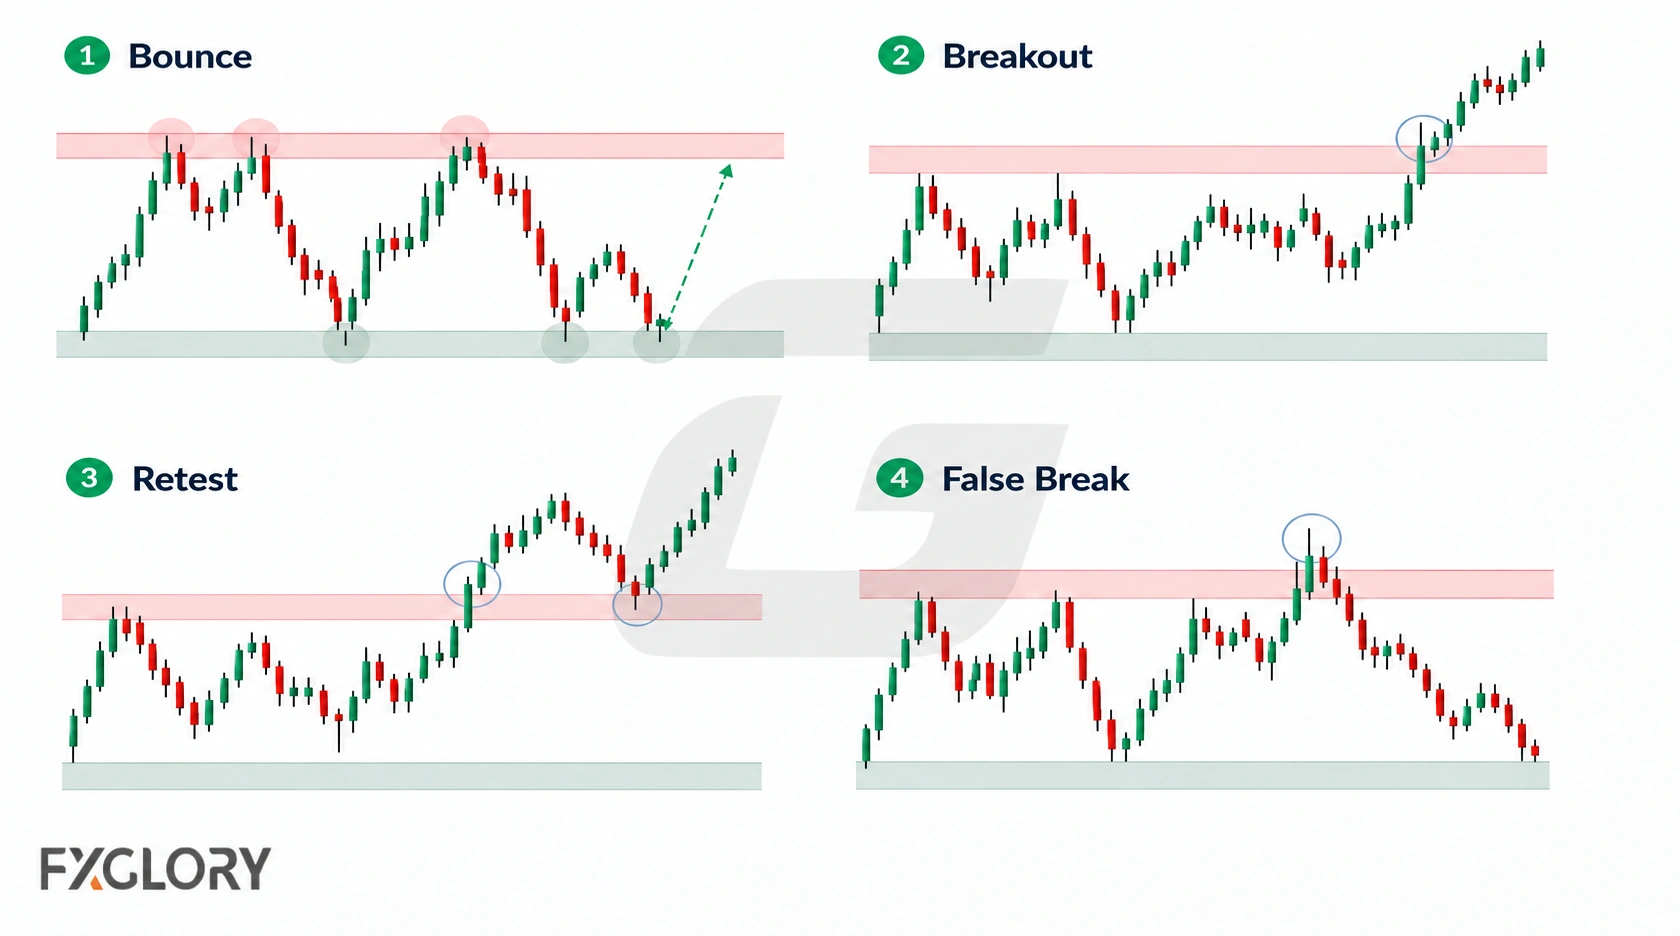
- Bounce: Price reacts from the zone and moves away from it. The risk is that the reaction may fail or become only a small pause.
- Breakout: Price moves through the zone with stronger movement. The risk is that the break may be false or happen during fast conditions.
- Retest: Price returns to a broken zone to test it again. The risk is that the retest may not hold, or price may move through again.
- False break: Price moves beyond the zone but then returns back inside. The risk is that traders who react too quickly may enter late or with poor risk.
A support or resistance scenario becomes more useful when the trader can explain what would confirm it and what would prove it wrong. A support and resistance strategy can then define the execution rules, position sizing, and conditions for standing aside.
Role Reversal: When Support Becomes Resistance
Role reversal happens when a broken level later acts as the opposite type of zone. Old resistance may become support after price breaks above it and returns. Old support may become resistance after price breaks below it and returns.
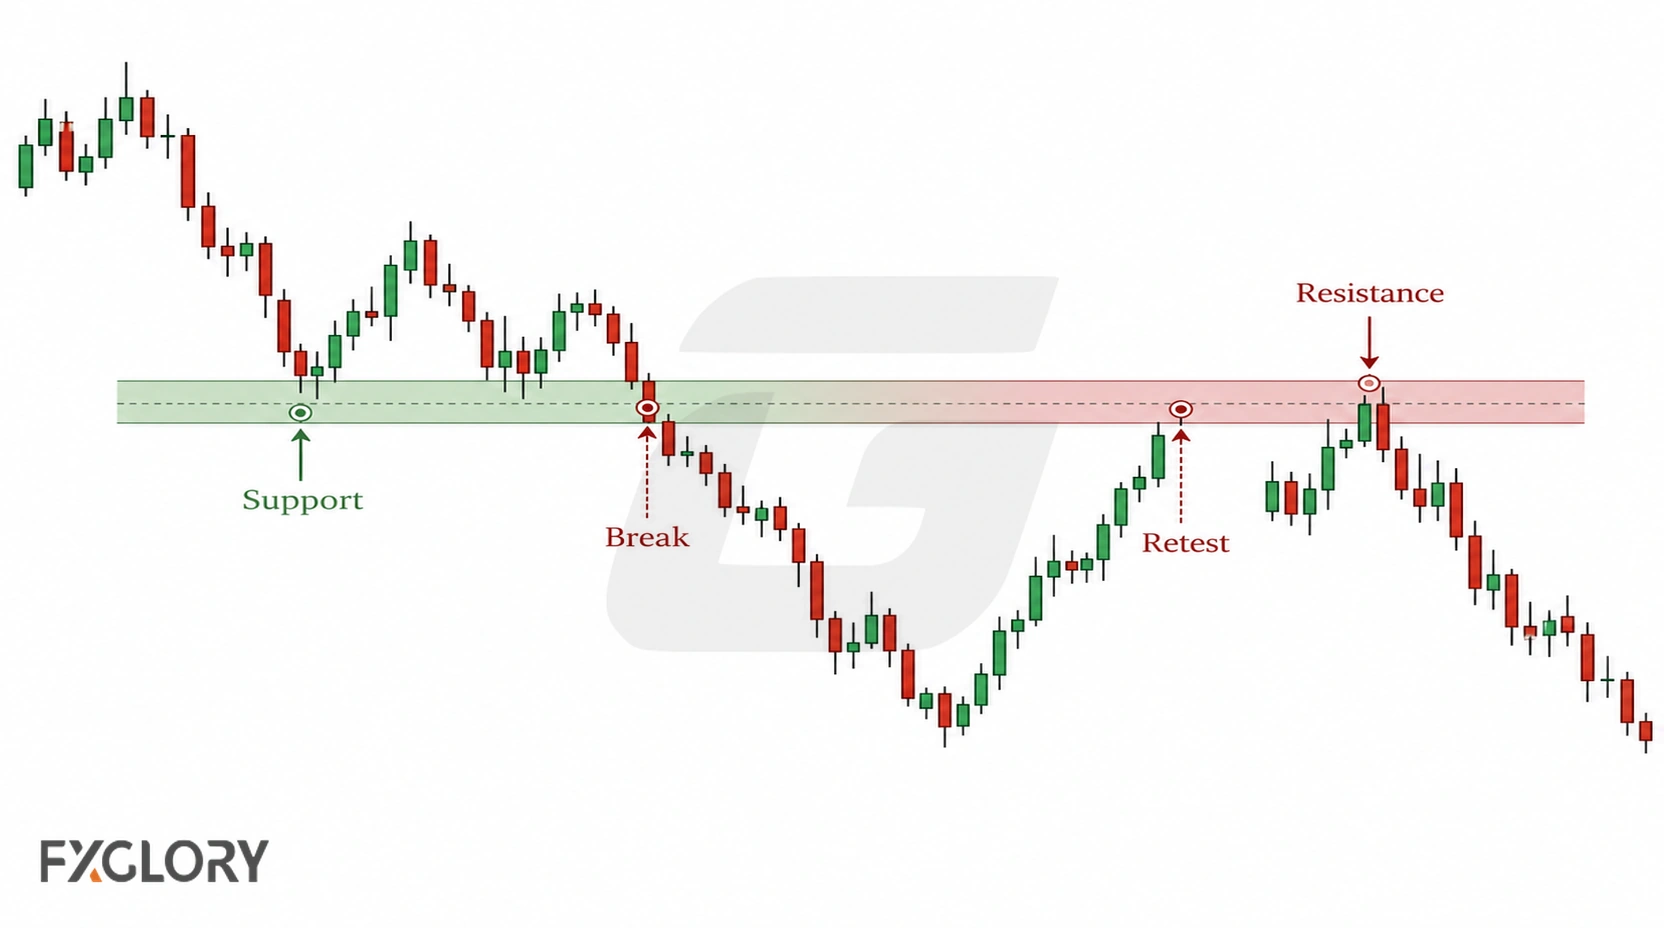
Role reversal is only relevant if price returns to the broken area and reacts there. If price moves through the zone without response, the old level may offer little value for that scenario.
- Old resistance as support: Price breaks above a resistance zone, then later returns and reacts from that area.
- Old support as resistance: Price breaks below a support zone, then later returns and struggles near that area.
- No role reversal: Price breaks and does not respect the area on the return.
Forex Context: Round Numbers, Sessions, News, and Liquidity
Support and resistance in forex should be read with market context. Currency pairs trade across global sessions, and price behavior can change during active sessions, thin-liquidity periods, and major news releases.
- Round numbers: Clean price areas may attract attention, but they should not be traded blindly.
- Session highs and lows: Previous session extremes can become watched areas for short-term traders.
- News volatility: High-impact news can break levels quickly or create false moves.
- Thin liquidity: Price can move through levels more easily when fewer participants are active.
- Spread and slippage: Fast movement around a level can affect entry, exit, and risk control.
- Timeframes: A level on a short timeframe may not matter the same way as a level visible on a higher timeframe.
These conditions can change how price behaves around an otherwise clear technical area.
When Not to Use a Support or Resistance Level
Some levels are too weak, crowded, or unclear to support a decision. A trader should be able to explain why a zone matters before using it in a scenario.
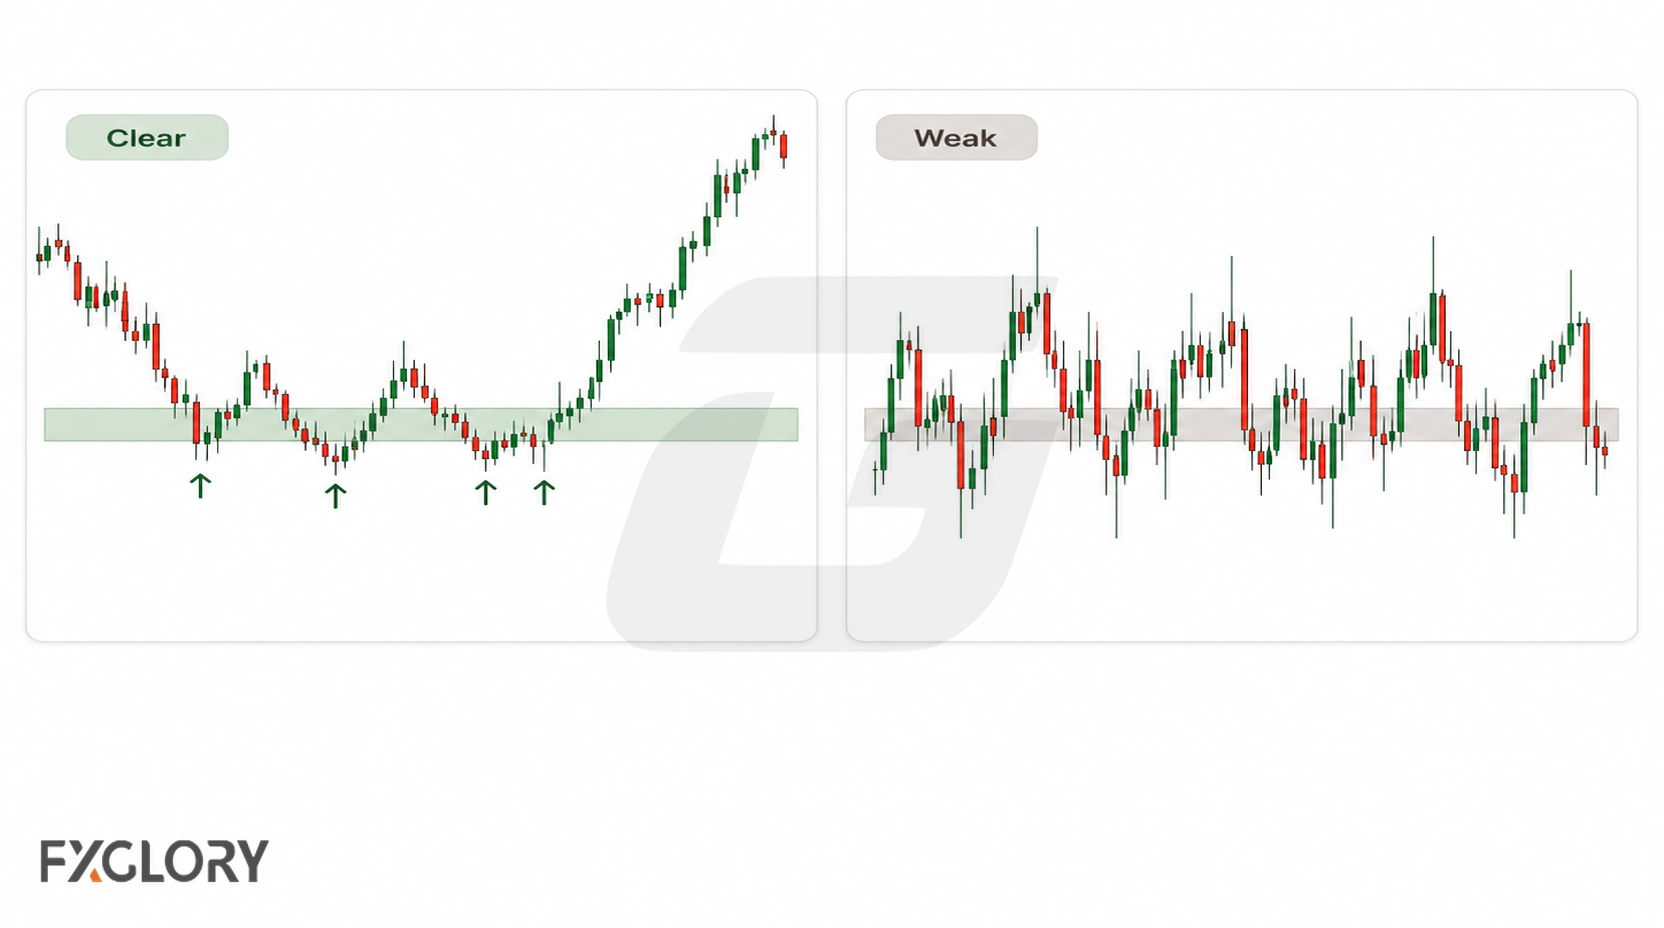
- The zone disappears unless the chart is heavily zoomed in: If the area is not obvious, it may not be useful.
- Price is in the middle of noise: A level inside messy movement may offer poor context.
- Major news is close: News can overwhelm nearby technical zones.
- The wrong point is impractically far away: The required risk may not fit the account or plan.
- Price no longer reacts near the area: A historical level may lose relevance if price no longer responds there.
Common Mistakes With Forex Support and Resistance
Most support-and-resistance mistakes come from overmarking the chart or treating a reference area as a complete trade decision.
- Drawing too many levels: Marking every high and low creates clutter instead of clarity.
- Using exact lines only: A single price can hide the wider reaction area shown by nearby wicks and closes.
- Buying support or selling resistance automatically: A level is not a complete trade plan.
- Trusting automatic tools blindly: A calculated level may be irrelevant to the active timeframe or current structure.
- Ignoring breakouts and false breaks: Price can move beyond a zone and then return.
- Ignoring higher timeframes: A short-term level may conflict with broader market structure.
- No invalidation point: A level without a wrong point can lead to emotional holding.
- Ignoring spread, slippage, and volatility: Execution conditions can change the result around a level.
Example: Reading Support and Resistance on EUR/USD
Suppose EUR/USD technical readings show price returning to a previous reaction zone. Instead of assuming the level will hold, compare the return with the scenarios above: rejection supports a bounce interpretation, a sustained move through the area supports a breakout interpretation, and a quick move beyond the zone followed by a return suggests a false break.
A Safer Way to Use Support and Resistance in Forex
Support and resistance are most useful as a repeatable way to organize important price areas. Prefer clear zones that can be explained from the chart, compare them with current market context, and avoid using a level when the risk or invalidation cannot be defined clearly.