
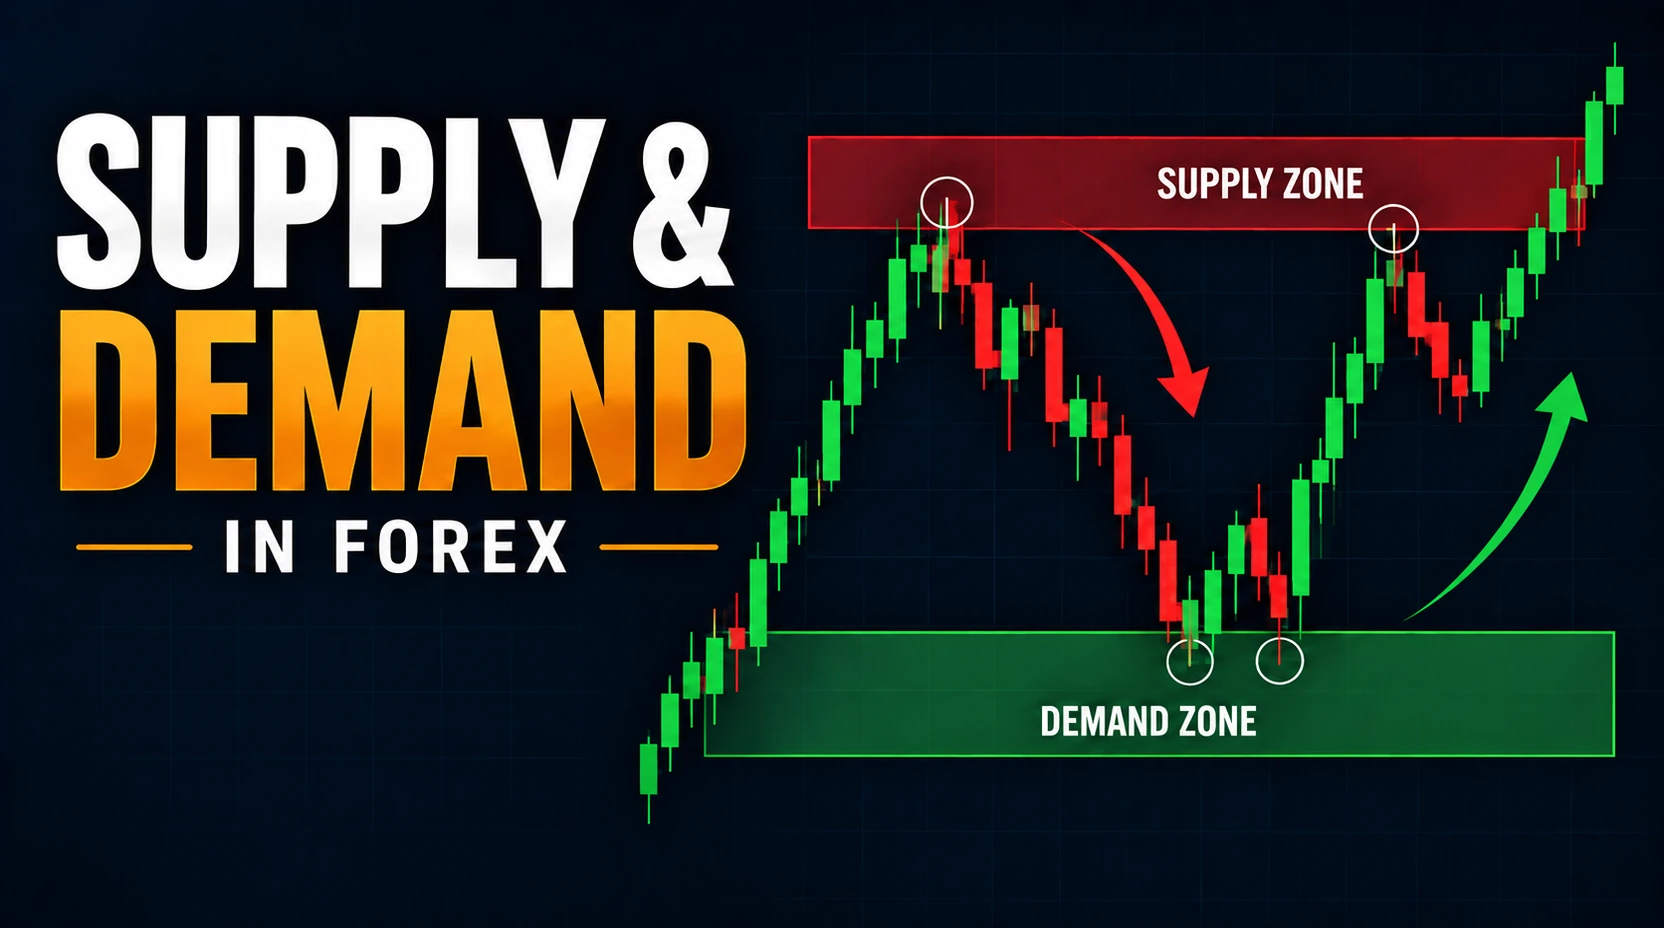
What Is Supply and Demand in Forex?
Supply and demand in forex describes the pressure between buyers and sellers in a currency pair. When demand for one currency increases relative to another, its price may rise; when selling pressure dominates, its price may fall.
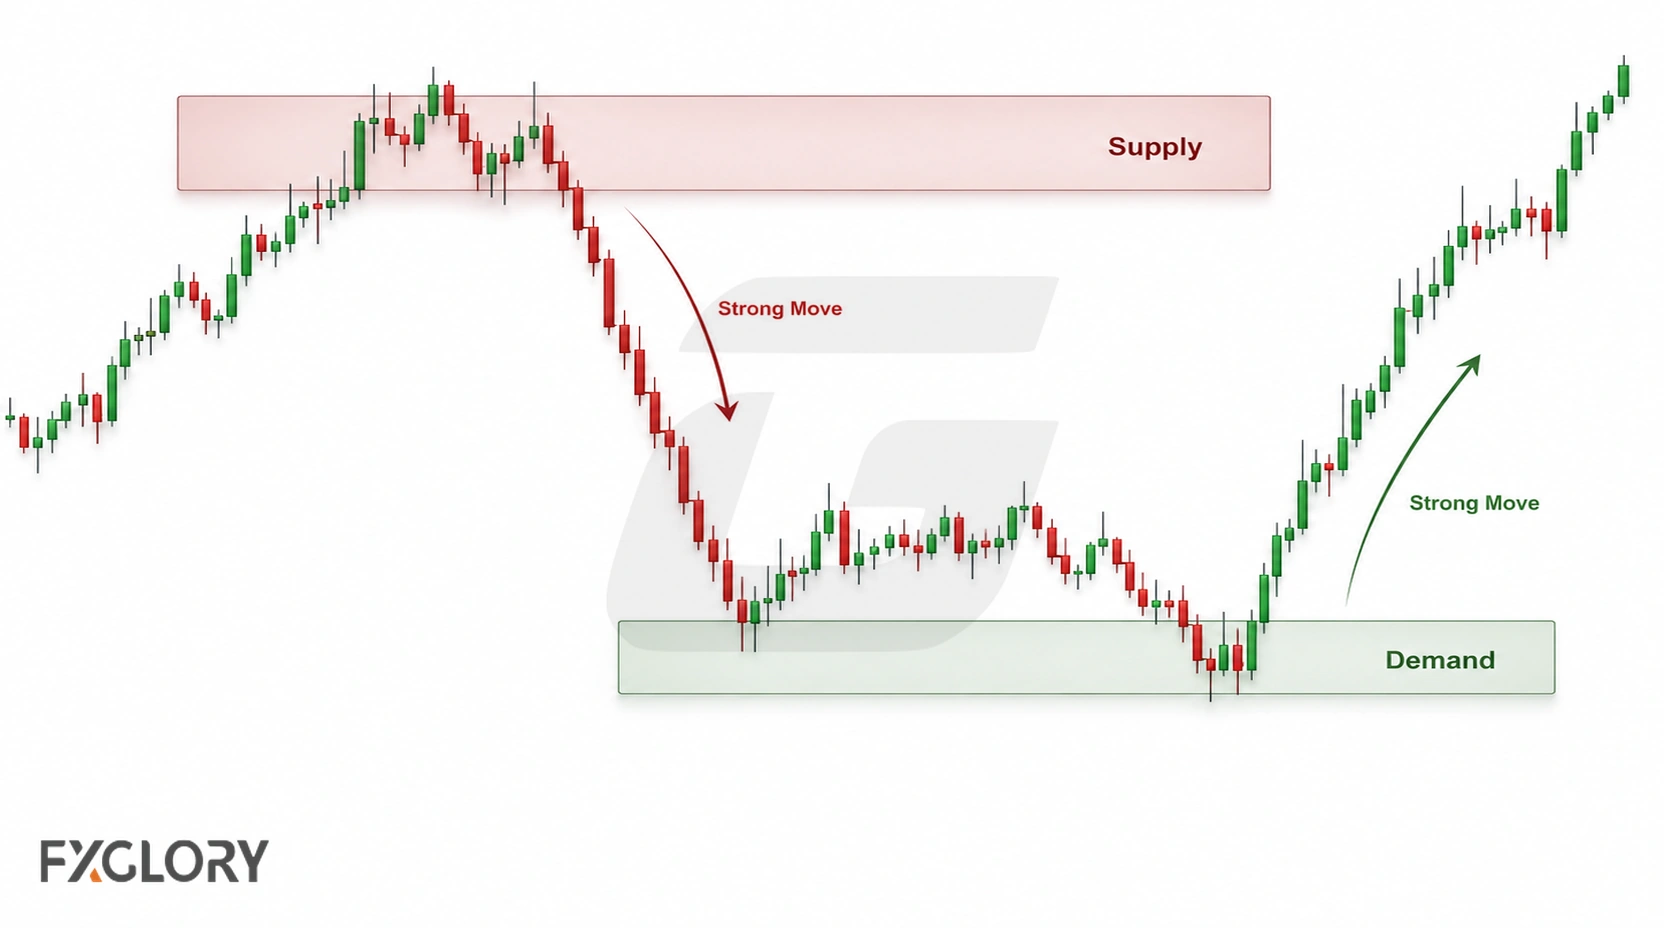
On a chart, traders use supply and demand zones to mark the base before a directional move. A demand zone is associated with a base before a rally; a supply zone is associated with a base before a decline. The zone is an area rather than one exact price.
A chart-based zone records past price behavior. It does not prove that hidden or institutional orders remain there. Traders who want to examine what market-data feeds can and cannot reveal can review order-flow data in forex.
What Changes Supply and Demand in Currency Pairs?
Chart zones are historical references, while the forces affecting a currency pair can change. Interest-rate expectations, central-bank policy, inflation data, employment reports, political uncertainty, risk sentiment, trade flows, and major news events can all alter demand for one currency relative to another.
New information can therefore make an old zone less informative. A prior demand area may stop containing price after bearish repricing, while a prior supply area may be exceeded after bullish repricing. Historical structure should be read in current market context rather than treated as a guarantee.
Supply Zone vs Demand Zone
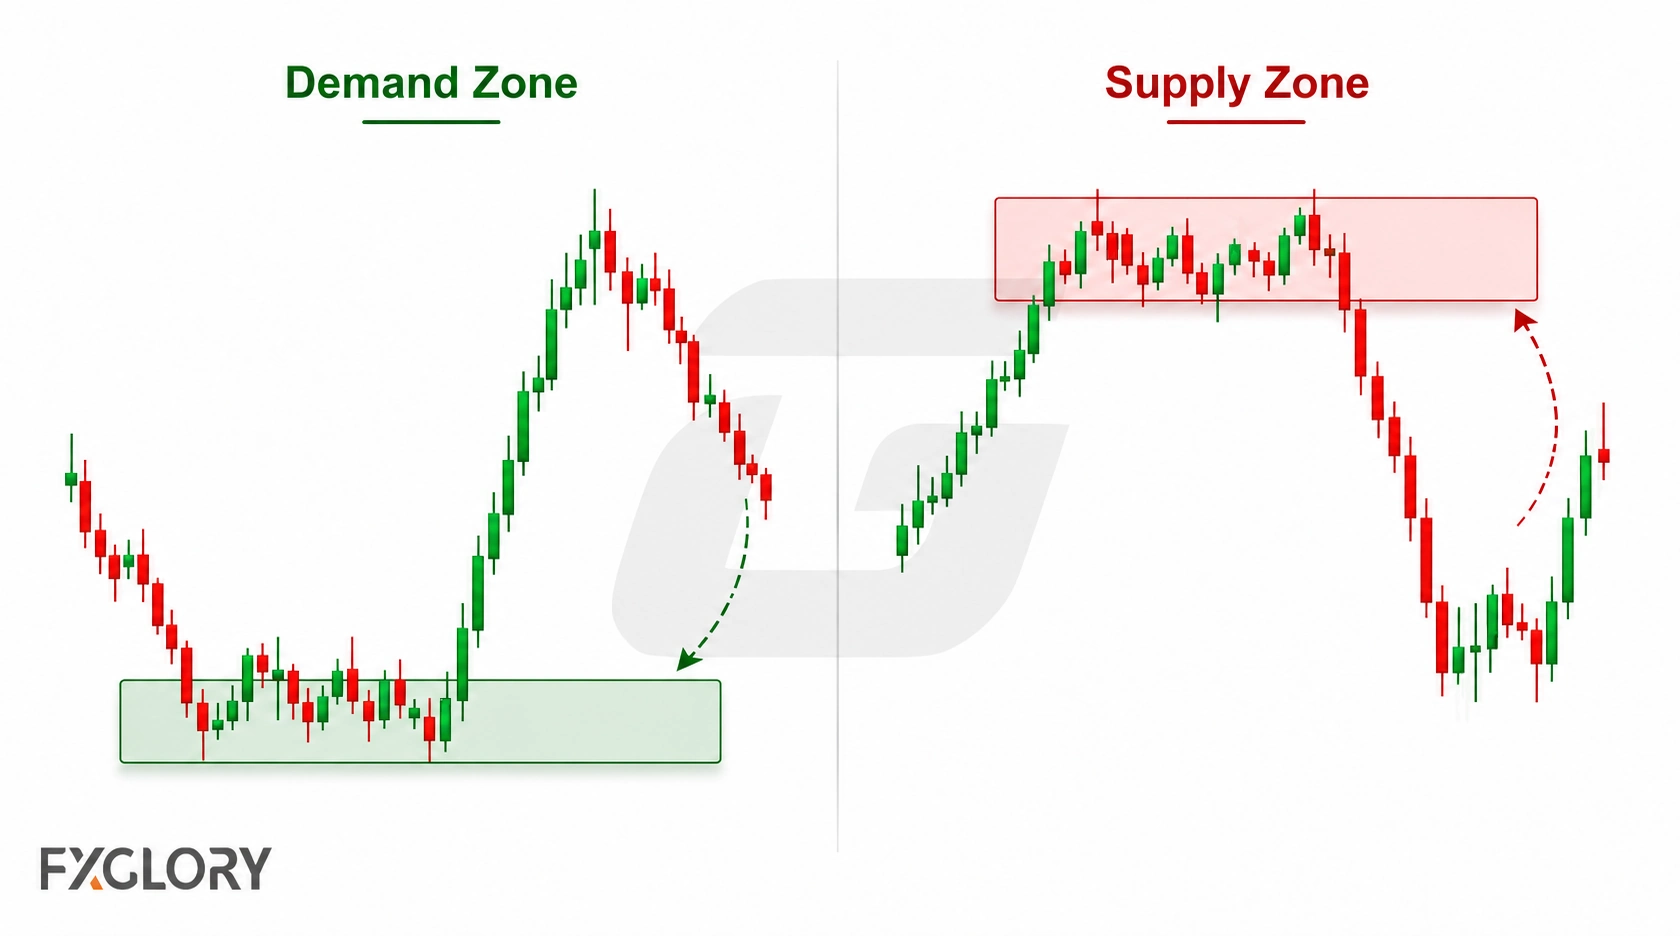
| Zone type | Where it appears | What to observe on a return |
|---|---|---|
| Demand zone | Around a base before a rally | Whether price moves away again, remains within the area, or establishes structure below it |
| Supply zone | Around a base before a decline | Whether price moves away again, remains within the area, or establishes structure above it |
Supply and Demand vs Support and Resistance
Supply and demand zones belong within the broader field of support and resistance analysis, but they use a more specific construction. Support and resistance can come from repeated highs or lows, breakout areas, round numbers, or other visible references. Supply and demand zones emphasize the base immediately before a directional departure.
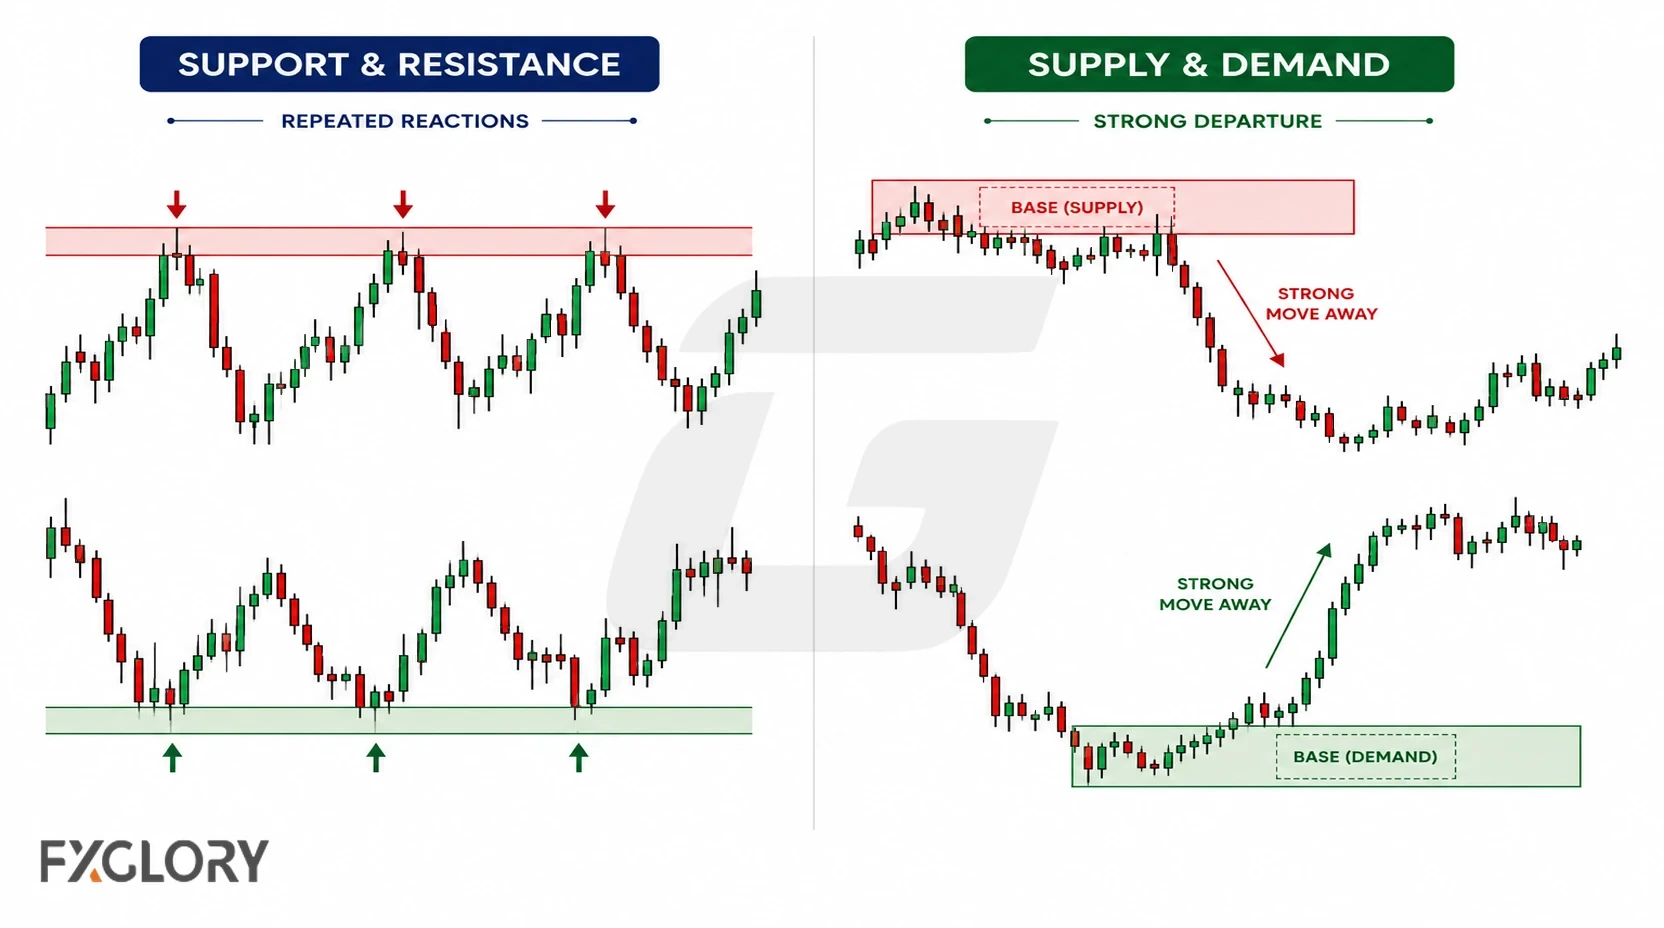
For comparison, calculated forex pivot points create levels from a formula. Supply and demand zones are drawn from visible price structure instead.
How to Evaluate a Supply or Demand Zone
Not every pause on a chart needs to become a zone. The purpose of evaluation is to decide whether a marked area clearly represents the base before a directional move and remains practical to interpret later.
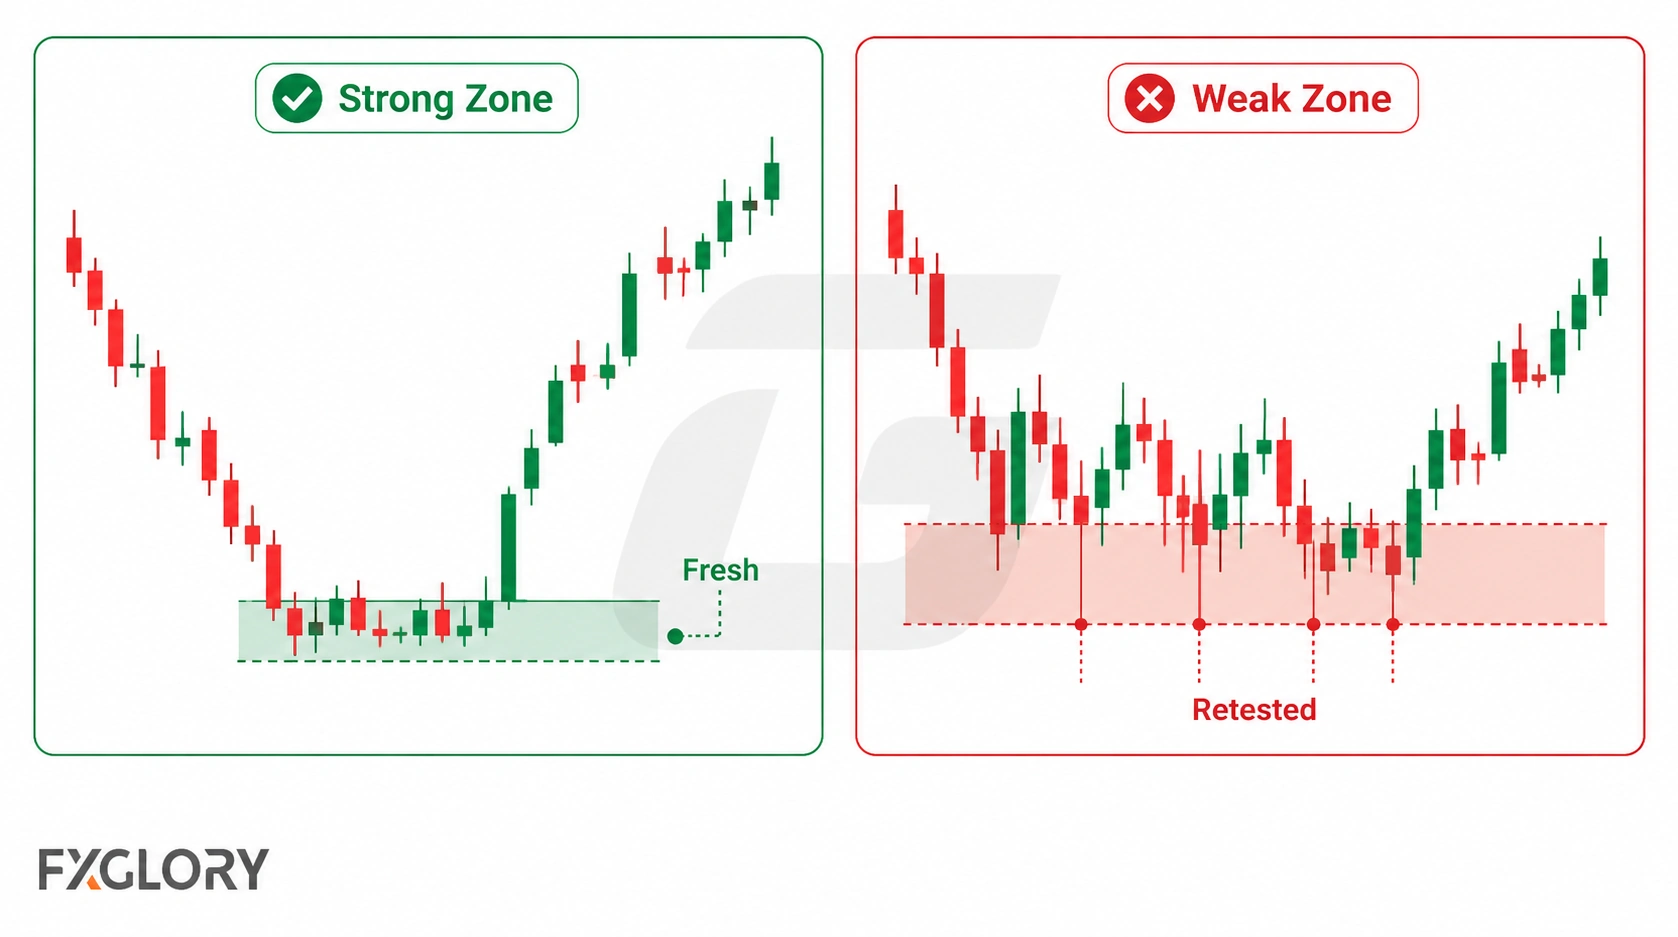
- Base clarity: The pause before the move can be identified without stretching the zone across unrelated candles.
- Departure clarity: Price moves away directionally enough to distinguish the base from ordinary sideways movement.
- Later interaction: Subsequent returns show whether the original boundaries still describe price behavior or have become blurred.
- Practical width: The zone is narrow enough to remain a useful analytical reference rather than covering a large part of the chart.
- Structural context: Nearby swings and opposing zones help show where the marked area sits within the broader chart.
Fresh Zones vs Retested Zones
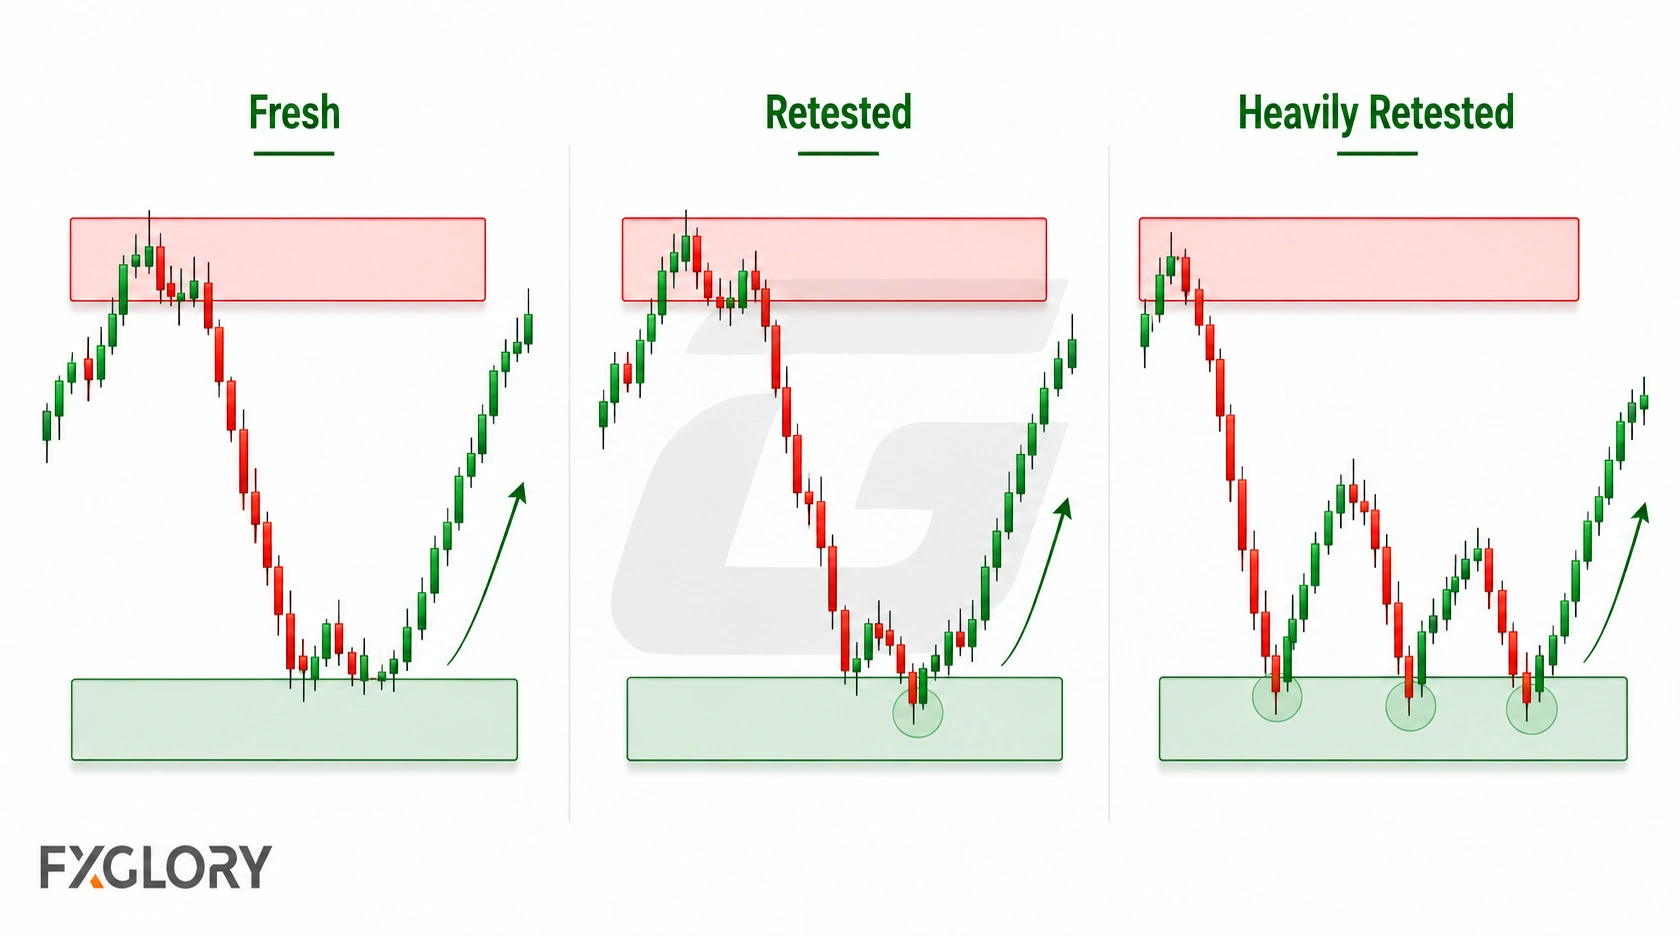
A fresh zone has not been revisited since price left the base. A retested zone has had one or more later interactions with the same area. Freshness describes the zone's history; it does not predict that the next return will produce a particular reaction.
| Zone condition | What it means | What to observe |
|---|---|---|
| Fresh zone | No return since the departure | How price behaves on the first revisit |
| Retested zone | One or a small number of later interactions | Whether the original boundaries still describe the response clearly |
| Heavily retested zone | Repeated later interaction with the area | Whether price increasingly trades through the zone or the original boundaries have become less informative |
Supply and Demand Zone Patterns
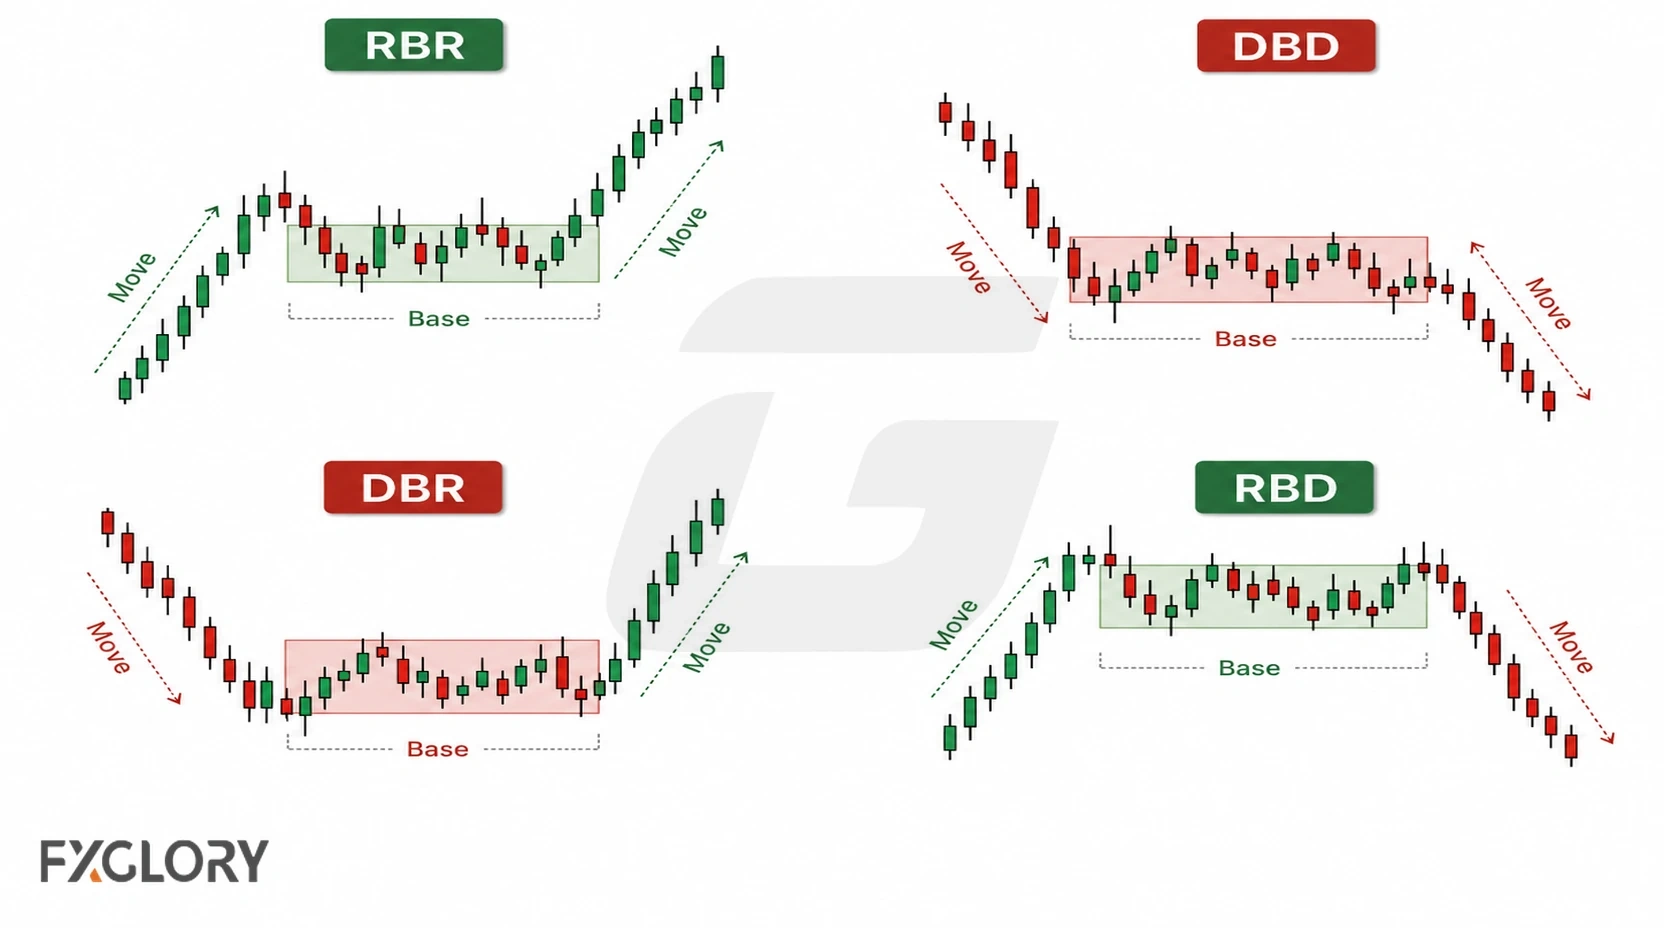
Four common labels describe how price moves into a base and leaves it.
| Pattern | Meaning | Typical zone idea |
|---|---|---|
| Rally-Base-Rally (RBR) | Price rallies, pauses, then rallies again | Continuation demand zone |
| Drop-Base-Drop (DBD) | Price drops, pauses, then drops again | Continuation supply zone |
| Drop-Base-Rally (DBR) | Price drops into a base, then rallies away | Reversal demand zone |
| Rally-Base-Drop (RBD) | Price rallies into a base, then drops away | Reversal supply zone |
How to Draw Supply and Demand Zones
Draw the zone around the base immediately before the directional departure rather than around the entire move.
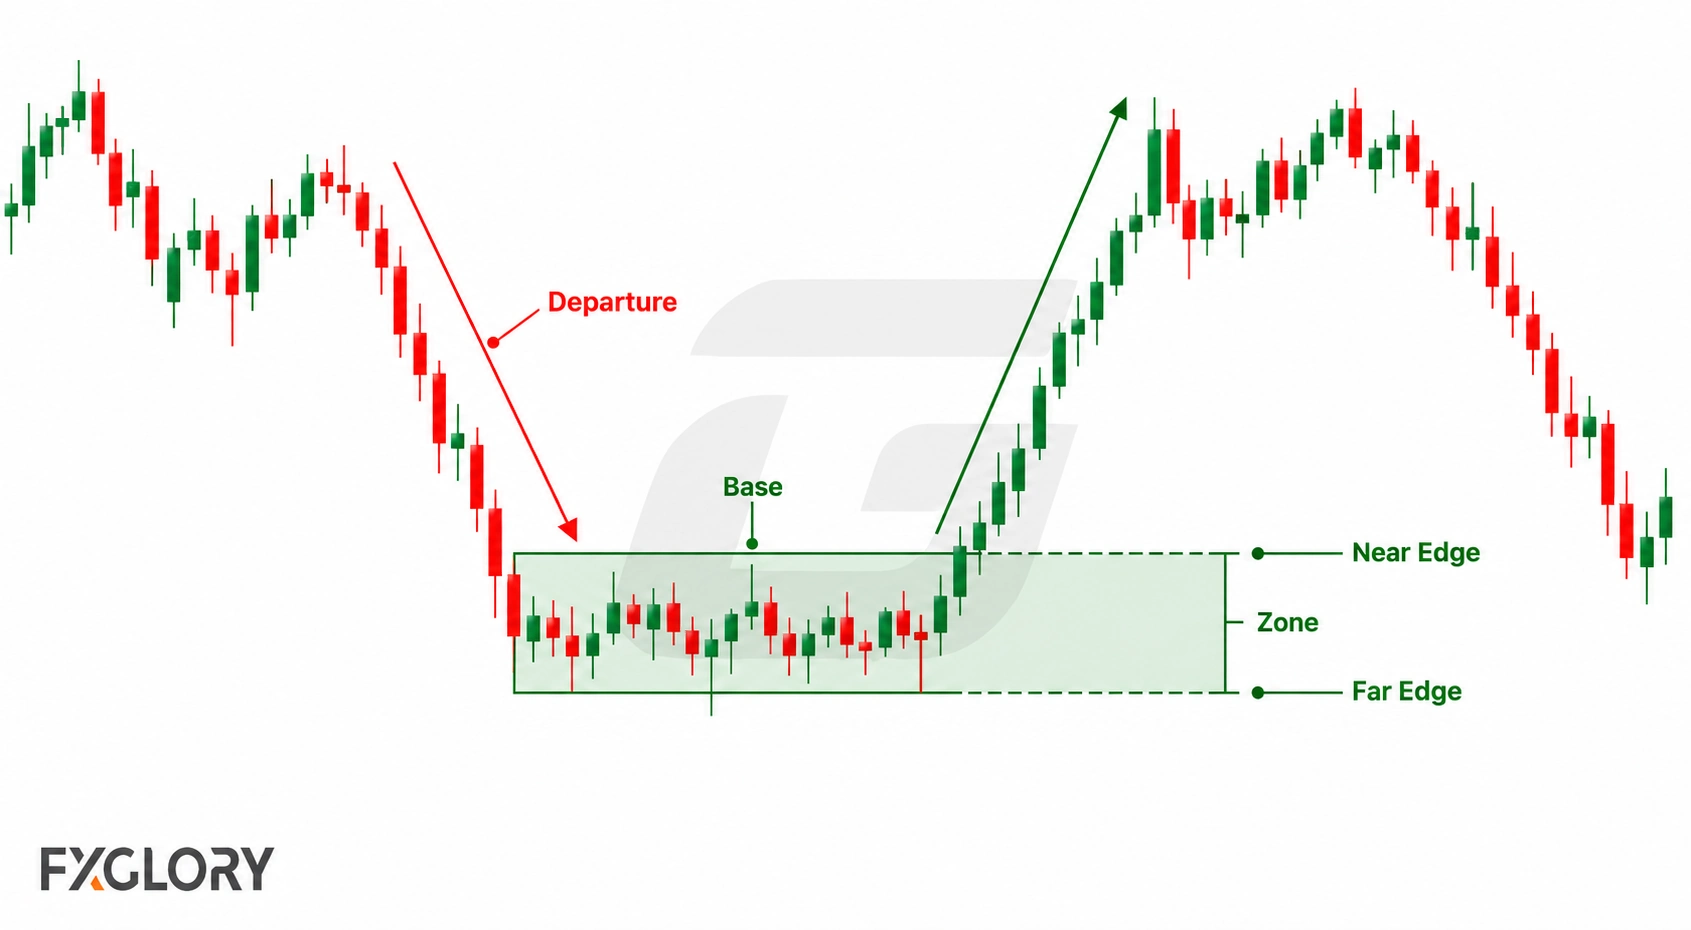
- Find the departure: Identify a rally or drop that clearly separates from the preceding base.
- Locate the base: Mark the candles where price paused immediately before that move.
- Draw an area: Use the relevant bodies and wicks that define the base rather than one exact price.
- Set the far edge: For demand, this is near the lowest relevant point of the base; for supply, near the highest.
- Set the near edge: Use the side of the base closest to current price.
- Keep the width practical: Do not expand the rectangle so far that it no longer describes the original base.
Some traders call the near boundary the proximal line and the far boundary the distal line. Those labels are optional; the important point is that both boundaries come from the same base rather than being adjusted later to fit the outcome.
Supply and Demand Forex Trading Workflow
A simple workflow is identify → mark → wait → observe → reassess. Choose a timeframe that shows the swing structure relevant to the trading horizon, mark the base and its boundaries, and then wait to see whether price revisits the area.
On a return, compare whether price moves away from the zone, remains within it, or establishes price action beyond its boundary. Avoid turning one wick, one close, or an arbitrary candle count into a universal rule. The objective is to reassess whether the original zone still describes the current structure.
For example, if a demand zone was drawn around a base before a rally and price later returns, the useful questions are whether the original boundaries still contain the interaction and whether the broader swing structure continues to support that interpretation.
When a Supply or Demand Zone Breaks
A prior zone may stop describing the current chart if price establishes structure beyond it. When demand no longer contains price, the old area can later be observed from below; when supply no longer contains price, it can later be observed from above.
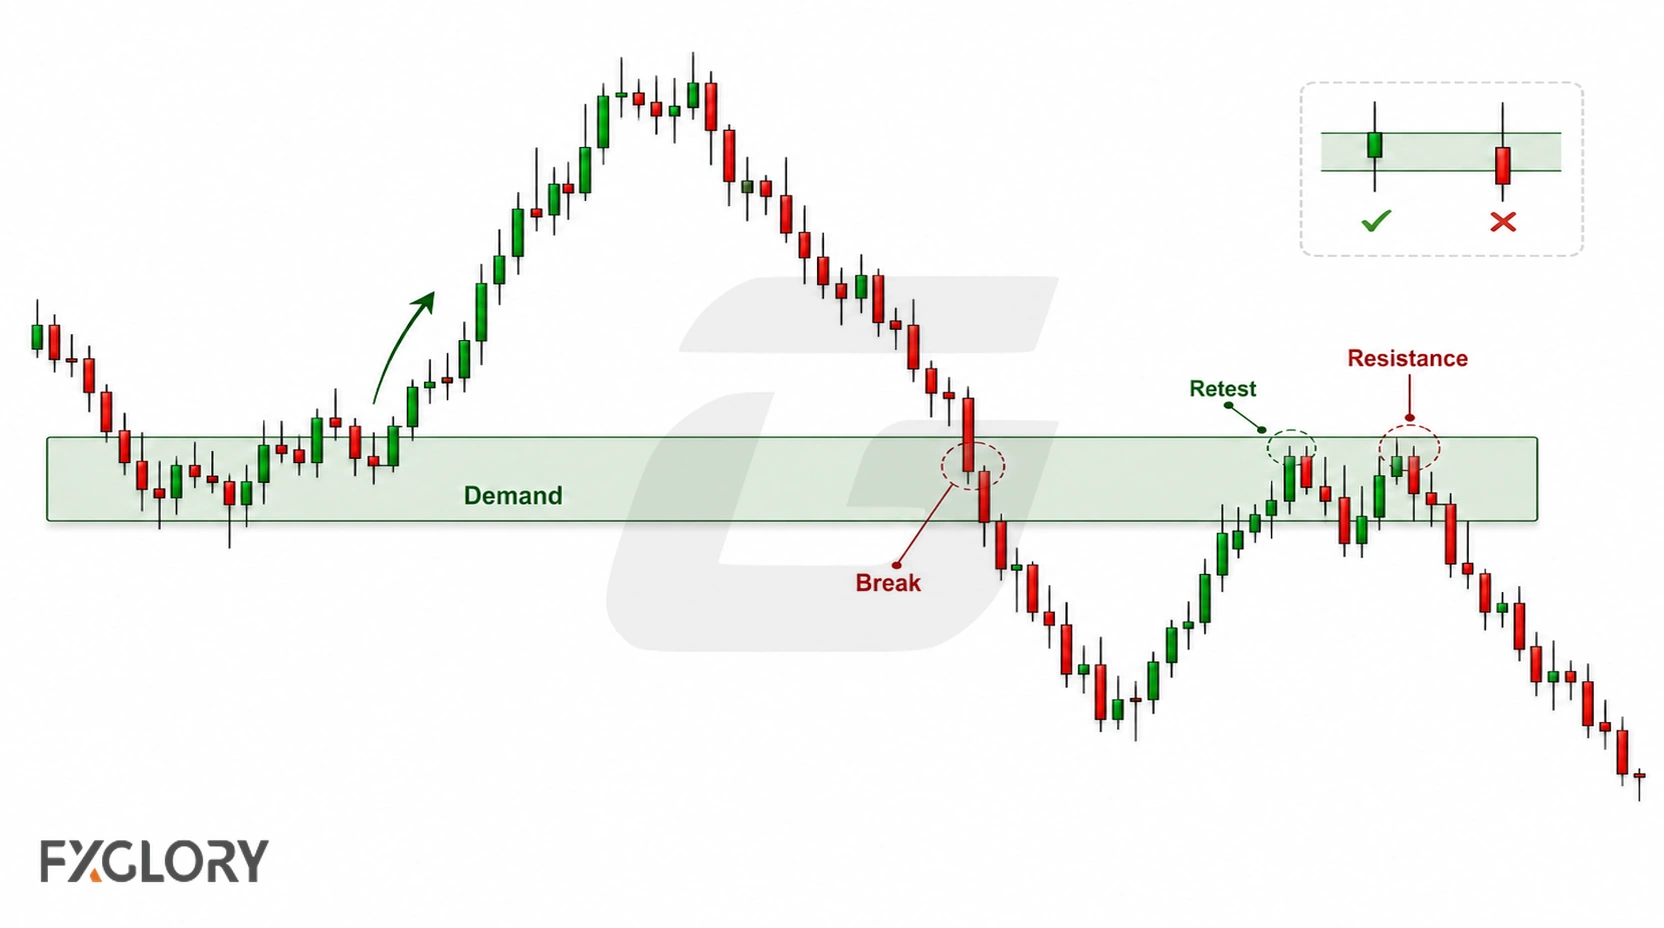
A brief penetration alone does not establish that the zone has definitively changed role. Look at the subsequent structure rather than relying on a single wick or fixed number of closes.
For a deeper trading framework around breaks and later retests, see the break and retest strategy guide.
Additional Context Around a Supply or Demand Zone
Other tools can provide context that is different from the zone itself. They should not be treated as a fixed checklist that automatically makes a setup valid.
Price-Action Context
Candles can show how price is behaving during the revisit. A move back away from the area, continued overlap inside it, or trading beyond its boundary are observations rather than universal confirmation thresholds. Traders can compare these behaviors with reversal candle behavior near support and resistance.
Volatility Context
Volatility affects the scale of normal price movement. ATR can provide a separate volatility measure when deciding whether a zone's width or a planned invalidation point is unusually tight relative to recent movement.
Trend and Structural Context
Nearby swing highs and lows, broader directional structure, and opposing zones can help show whether the marked area is isolated or part of a larger pattern. This context should describe the chart rather than serve as an automatic reason to trade.
Volume and Tick Activity
Spot forex is decentralized, so platform volume and tick activity represent limited feeds rather than the full global market. They can add context, but they do not prove the presence or absence of institutional orders at a zone.
Common Mistakes and Limits
Supply and demand analysis becomes less useful when the rectangle is forced to fit a preferred interpretation rather than the visible base and departure.
- Marking every pause: Dense overlapping rectangles make it difficult to distinguish meaningful bases.
- Drawing zones too broadly: A zone that covers unrelated candles stops describing the original base.
- Treating the area as an exact line: The zone represents a range derived from the base, not one mandatory reaction price.
- Retrofitting boundaries: Moving the edges after the outcome is known can hide that the original zone was poorly defined.
- Assuming hidden orders: A retail chart cannot identify who placed orders at a price area.
- Treating visibility as prediction: A clearly visible historical zone does not guarantee a future reversal.
When Supply and Demand Zones Are Less Useful
A zone may be less informative when price repeatedly moves through both boundaries, when overlapping candles make the original base difficult to distinguish, when the rectangle is so broad that it no longer separates one price area from another, or when abrupt news-driven repricing makes the historical structure a poor guide to current conditions.
Final Thoughts on Supply and Demand Zones in Forex
Supply and demand zones are retrospective chart references built around bases that preceded directional moves. Their usefulness comes from how clearly they describe structure and how price behaves when the area is revisited—not from assuming that the same reaction must occur again.