

What Are Forex Pivot Points?
Forex pivot points are formula-based support and resistance references derived from prior-period price data. The Classic method uses the prior high, low, and close to create a central pivot, then builds resistance levels above it and support levels below it.
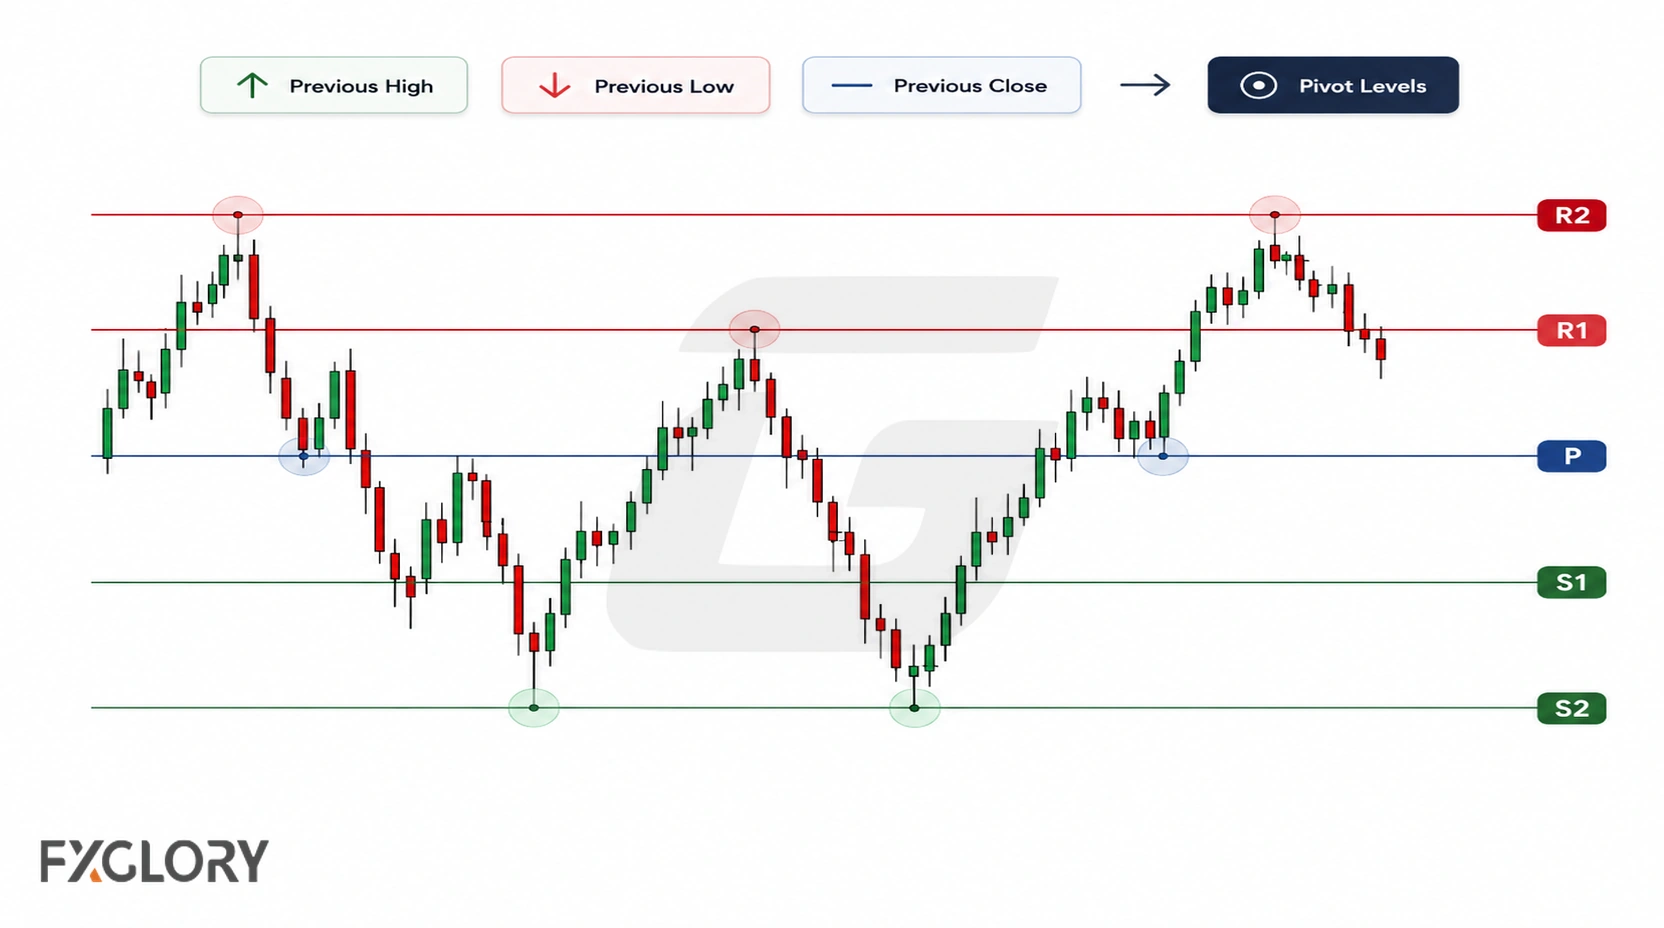
Pivot points became popular through floor-trader style session planning, where previous high, low, and close data helped mark reference levels for the next trading session.
The central pivot gives the session a reference point. When price trades above it, traders may read the intraday tone as firmer. When price trades below it, they may read the tone as weaker. That does not mean price must continue in that direction. It simply gives the chart a fixed level to compare price behavior against.
Pivot points belong naturally inside support and resistance analysis. Unlike hand-drawn levels, they are mechanically calculated from a defined formula and data set. That makes them consistent within the same method and data source, but not automatic trade signals.
Forex Pivot Point Formula and Level Ladder
The classic pivot point calculation starts with the previous session high, low, and close. The central pivot is calculated first:
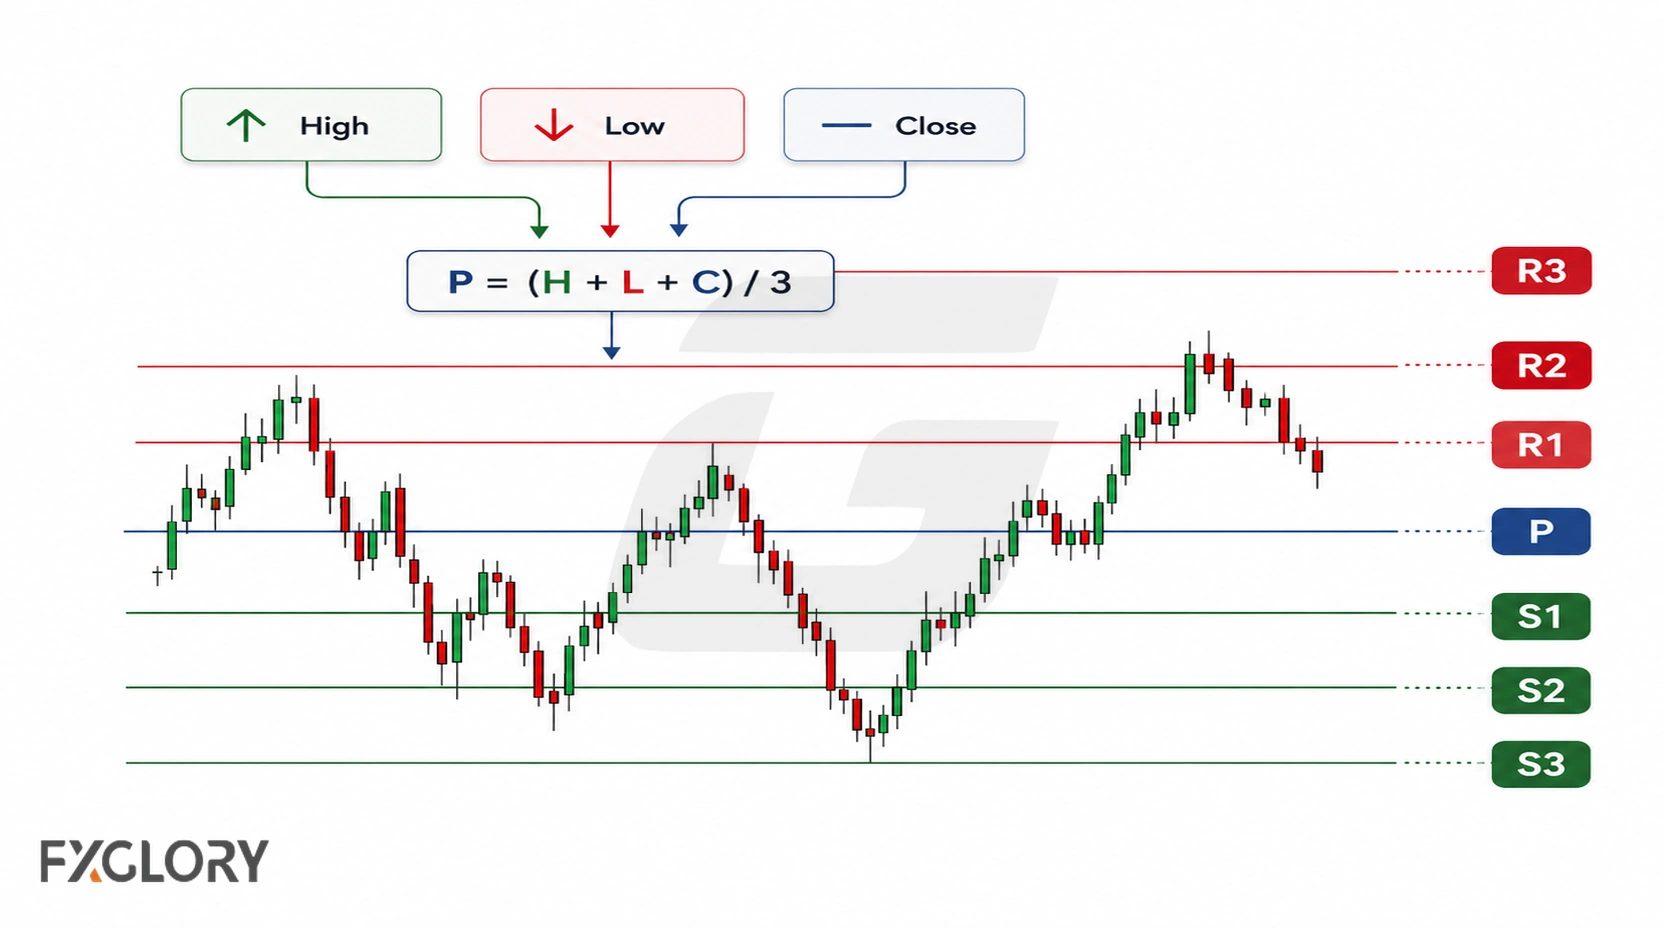
P = (High + Low + Close) / 3
After the central pivot is calculated, the support and resistance ladder is built around it. Most trading platforms calculate these levels automatically, but understanding the basic formula helps prevent pivot points from becoming a black box.
| Level | Classic formula | Typical role |
|---|---|---|
| P | (High + Low + Close) / 3 | Central session reference |
| R1 | (2 × P) - Low | First resistance reaction area |
| S1 | (2 × P) - High | First support reaction area |
| R2 | P + (High - Low) | Second resistance area after stronger upside movement |
| S2 | P - (High - Low) | Second support area after stronger downside movement |
| R3 | High + 2 × (P - Low) | Outer resistance area during extended upside movement |
| S3 | Low - 2 × (High - P) | Outer support area during extended downside movement |
R1 and S1 are usually the nearest levels around the central pivot. R2, S2, R3, and S3 sit farther away and often matter more when volatility expands or price is already moving strongly before the main session begins.
Types of Forex Pivot Points
There is more than one pivot calculation. The central idea is the same: use prior-period price data to project reference levels for the current session. The methods differ in how they use or weight the prior range, close, and, in some cases, the previous open-close relationship.
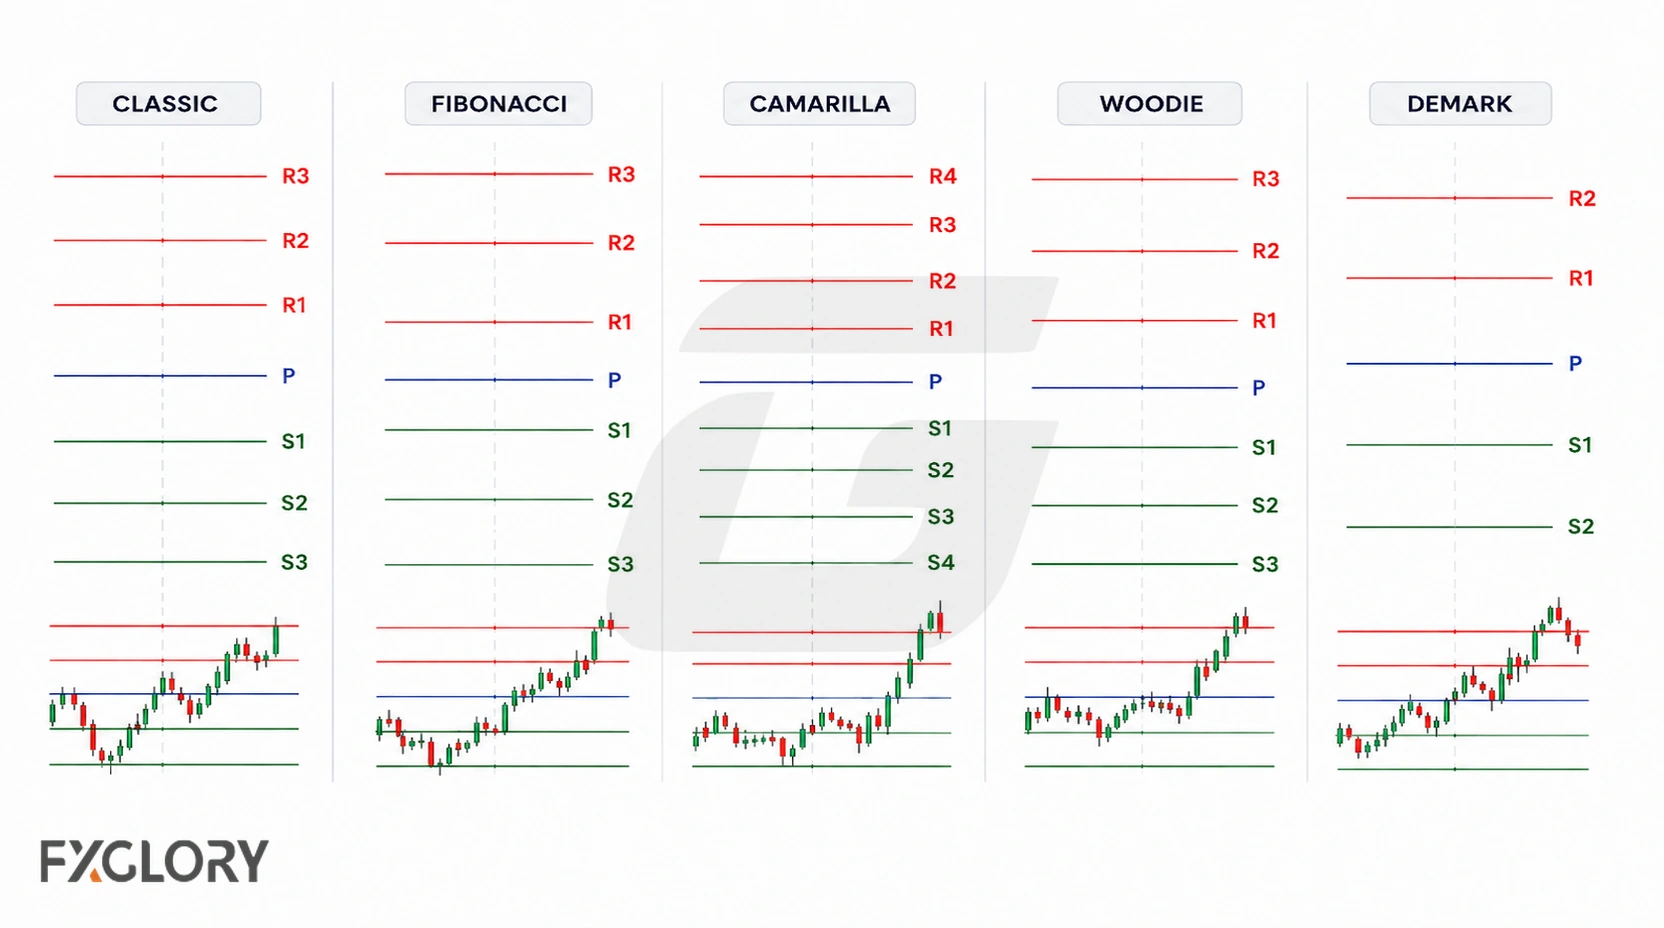
| Pivot type | Core calculation logic | Common use |
|---|---|---|
| Classic pivots | P = (High + Low + Close) / 3, then R and S levels are built around that central pivot. | A balanced support and resistance ladder. |
| Fibonacci pivots | P is usually the classic pivot, then the prior range is multiplied by ratios such as 0.382, 0.618, and 1.000. | Reaction levels based on range expansion. |
| Camarilla pivots | Levels are commonly built around the previous close using fractions of the prior range, often with a 1.1 multiplier. | Tighter intraday levels that often sit closer to the previous close than classic support and resistance levels. |
| Woodie pivots | Woodie implementations vary by platform. One common version gives extra weight to the previous close with P = (High + Low + 2 × Close) / 4, while others use the current-period open. | Session levels that give extra weight to a recent reference price. |
| DeMark pivots | If Close < Open, X = High + 2 × Low + Close. If Close > Open, X = 2 × High + Low + Close. If Close = Open, X = High + Low + 2 × Close. Then P = X / 4, R1 = X / 2 - Low, and S1 = X / 2 - High. | A conditional pivot calculation that usually focuses on fewer projected levels. |
Classic pivots are the clearest starting point because they are widely available and easy to interpret. Fibonacci and Camarilla pivots can add extra levels, but more lines do not automatically mean better analysis. The trader still needs price reaction, structure, and invalidation.
How to Read Forex Pivot Points as Zones
Pivot points are printed as exact prices, but they should usually be read as zones. Spreads, liquidity, candle wicks, and session volatility can make price react slightly above or below the printed level.
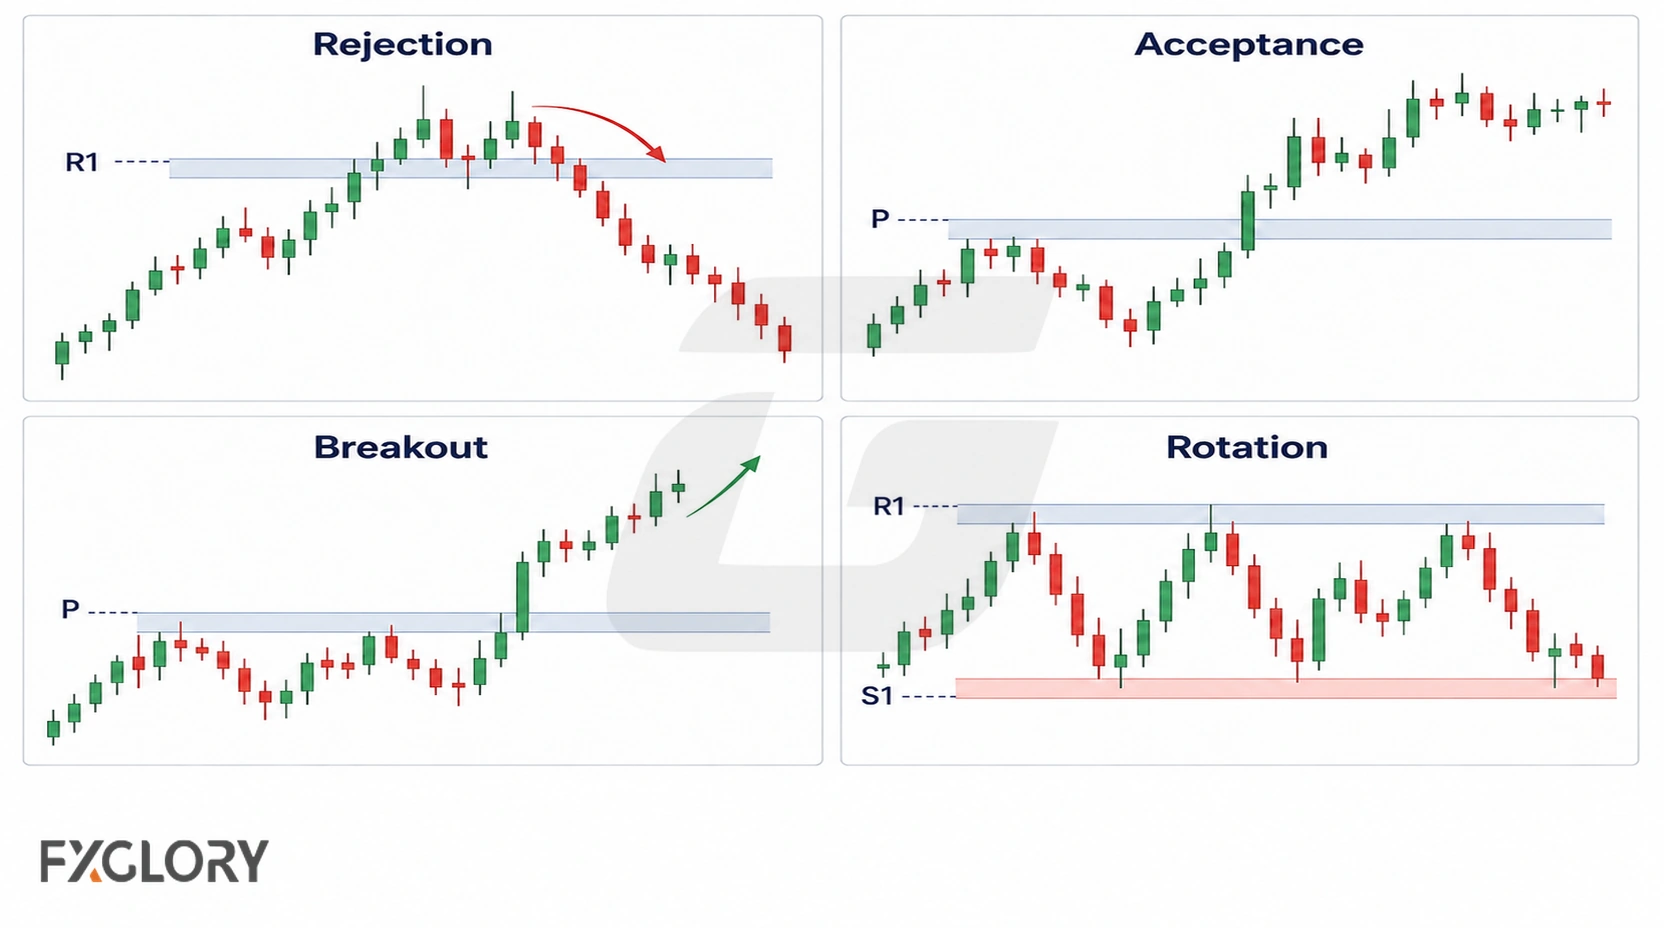
The central pivot is usually read first. If price opens above the pivot, pulls back, and rejects it with a clear close back upward, the session may still be holding a firmer structure. If price opens above the pivot but later accepts below it, the tone has changed.
The same logic works below the pivot. If price starts below the pivot and rejects it from underneath, the level may act as resistance. If price breaks through and holds above it, the prior resistance may become a new support reference.
- Rejection: Price tests a pivot zone and moves away from it with clearer candle closes.
- Acceptance: Price spends time beyond the level and begins treating the other side as normal trading area.
- Breakout: Price moves through the pivot level with enough follow-through to challenge the next level.
- Rotation: Price keeps moving between nearby levels without clean follow-through.
Pivot levels become more useful when they overlap with other chart references. A pivot near a prior swing high, round number, trend line, or larger support and resistance zone has more context than a pivot level floating alone in the middle of quiet price action.
How Traders Use Pivot Points in Forex Trading
A pivot-based trading plan usually starts before the session. The trader marks the levels, checks the broader market structure, then waits for price behavior around the nearest pivot area.
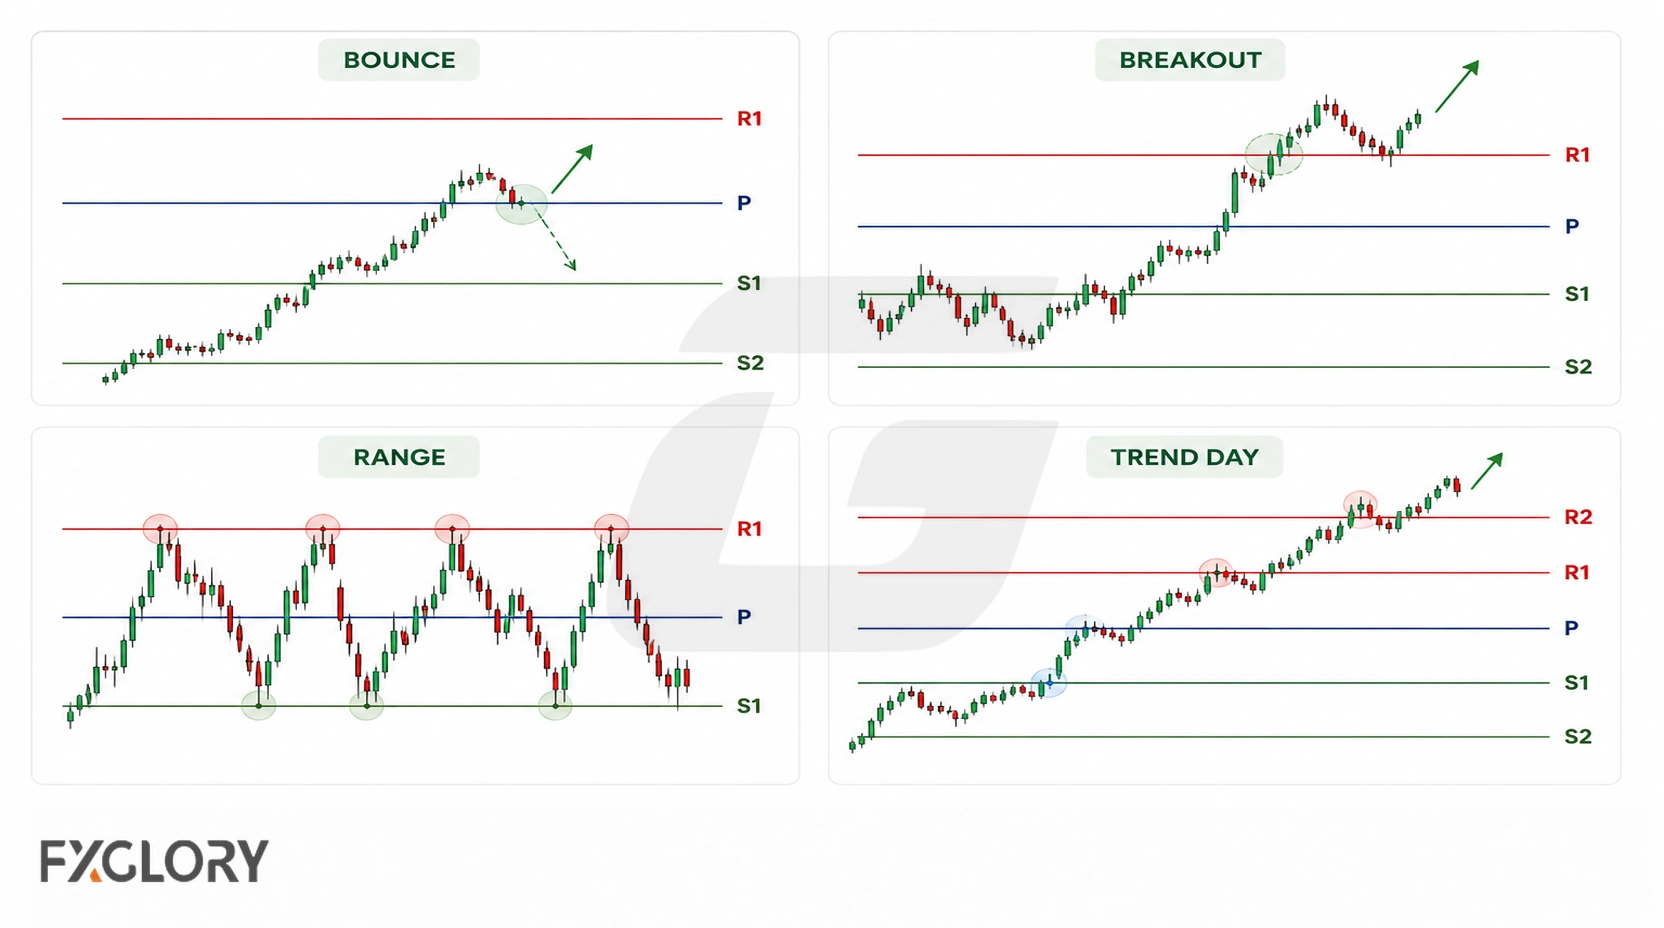
Pivot Bounce Plan
A bounce plan studies whether price rejects a pivot level and moves away from it. For example, if price is above the central pivot, pulls back into it, and then closes strongly upward, the trader may treat that reaction as a possible continuation signal.
When a pivot reaction includes wick rejection, a strong close, or a reversal-shaped candle near the level, traders can compare that behavior with reversal candle behavior around support and resistance before deciding whether the reaction is strong enough to study further.
- Context: Price is approaching the central pivot, S1, or R1.
- Trigger: A candle close shows rejection away from the pivot zone.
- Invalidation: Price accepts beyond the pivot instead of rejecting it.
- Review point: The next pivot level, recent swing high or low, and current volatility.
Pivot Breakout Plan
A breakout plan studies whether price can move through a pivot level and hold beyond it. A wick through R1 or S1 is not enough. The stronger clue is whether price closes beyond the level, retests it, and continues without falling back into the previous range.
- Context: Price compresses near a pivot level or approaches it with momentum.
- Trigger: Price closes beyond the level and does not immediately return.
- Invalidation: Price falls back through the level and loses follow-through.
- Review point: The next pivot level and any higher-timeframe structure nearby.
Pivot Range Plan
When price keeps rotating between S1, the central pivot, and R1, the session may be balanced. In this condition, breakout assumptions are weaker. Traders may either wait for a cleaner break or focus only on confirmed reactions near the edges of the range.
Pivot Trend-Day Plan
On stronger trend days, price may cut through multiple pivot levels. In that situation, the central pivot may be less important than whether pullbacks continue holding above broken resistance or below broken support. R2, S2, R3, and S3 become review areas, not guaranteed endpoints.
When price moves quickly around pivot levels, a volatility reference can help separate ordinary movement from a true break of the idea. Traders can compare this with normal volatility around a pivot level before deciding whether a stop is too tight or too far from the invalidation point.
Where to Find Forex Pivot Points on FXGlory
FXGlory currency-pair technical pages can display pivot point tables where available. For example, the EUR/USD technical pivot table shows Classic, Fibonacci, and Camarilla levels from R3 to S3 alongside other technical readings.
This is useful because the educational idea and the live chart context can be checked in the same workflow. First, understand what the central pivot, support levels, and resistance levels mean. Then study how price behaves near the current levels on a live currency-pair technical page.
How to Use the FXGlory Pivot Table
- Start with current price: Compare price with the central Pivot to see whether the pair is trading above, below, or near the session reference.
- Check the nearest levels: Look at R1 and S1 first because they are usually the closest reaction areas around the central pivot.
- Compare pivot types: Notice whether Classic, Fibonacci, and Camarilla levels cluster near the same price area. Clustered levels can create a cleaner zone to watch.
- Match the chart reaction: Wait to see whether price rejects, accepts, rotates around, or breaks through the level.
- Plan invalidation: Decide what would make the pivot idea wrong before treating the level as part of a trade plan.
Hourly, 4-Hour, Daily, Weekly, and Monthly Pivot Points
Pivot levels can be calculated from different periods. The useful period depends on the trading plan.
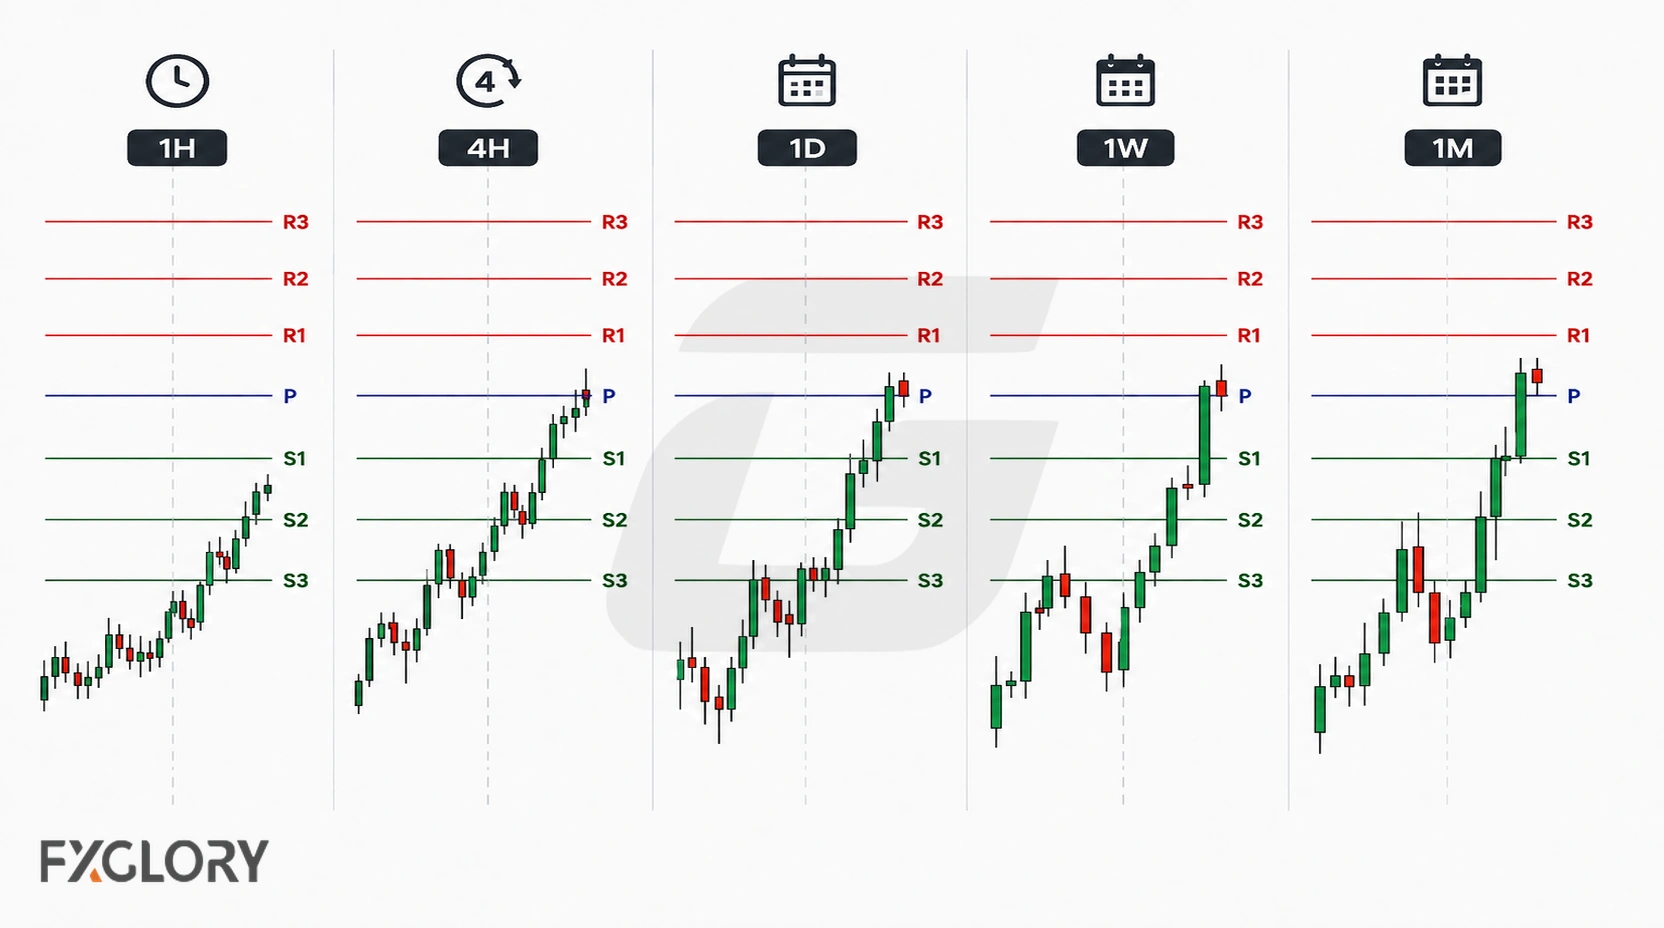
| Pivot period | What it usually helps with | What to watch |
|---|---|---|
| Hourly pivots | Very short-term intraday reference | Fast-changing reactions, spread, and session noise |
| 4-hour pivots | Short-term session structure | Reaction zones during active trading sessions |
| Daily pivots | Intraday support and resistance planning | Session open, London/New York reaction, S1/R1 tests |
| Weekly pivots | Broader swing context during the trading week | Whether daily pivots align with weekly levels |
| Monthly pivots | Larger support and resistance reference | Major reaction zones, extended moves, broader market structure |
Short-term traders often focus on daily pivots, while weekly and monthly pivots provide wider context. Some tools also show hourly or 4-hour pivots, but those levels can change faster and should be read with session volatility, spread, and nearby price structure in mind.
A daily R1 level that sits directly below a monthly resistance zone may carry more weight than a daily R1 level with no nearby structure.
Common Pivot Point Mistakes and Limits
Pivot points are simple to calculate, but they are easy to misuse when traders ignore context, volatility, or the limits of the formula.
- Trading every touch: A pivot level needs a defined setup and confirmation rather than an automatic entry.
- Ignoring the higher timeframe: A short-term pivot may fail quickly if it sits inside a larger breakout or trend move.
- Using exact-line thinking: Wicks, spread, and liquidity can produce reactions slightly above or below the printed pivot price.
- Changing data sources: Switching platforms can change the pivot calculation and make review inconsistent.
- Forcing targets: R2 and S2 are not guaranteed endpoints for the session.
- Ignoring volatility: Strong news events can move through several pivot levels quickly.
When Pivot Points Are Less Useful
Pivot points are less useful when price is moving through levels without reaction, when a major news event dominates the session, or when the chart is already reacting to a larger weekly or monthly structure. They can also be less useful when the trader cannot define invalidation clearly.
- Do not treat any pivot formula as a complete trading system.
- Do not place stops only because a pivot level is nearby.
- Do not assume one pivot type is suitable for every pair, session, or market condition.
Final Thoughts on Forex Pivot Points
Forex pivot points can organize pre-session preparation by giving traders predefined reference levels before price reaches them.
A practical FXGlory workflow is to review the current pivot table, compare price with the central pivot and nearby support or resistance, then assess the reaction alongside market structure and volatility before defining invalidation.