
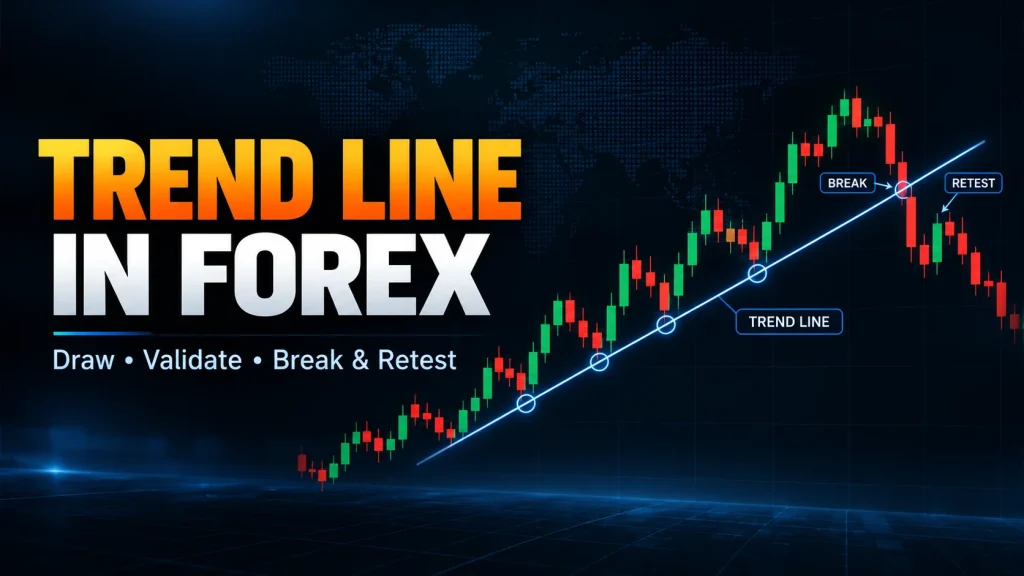
What Are Trend Lines in Forex?
A trend line is a diagonal chart line drawn through meaningful swing points. In rising structure, traders commonly connect swing lows below price; in falling structure, they commonly connect swing highs above price.
The line is an analytical reference, not the trend itself and not a forecast. Broader trend analysis also considers the sequence of highs and lows, direction, momentum, and market context. For that wider framework, see how forex trend structure is read.
Why Trend Lines Belong to Support and Resistance
Trend lines are a diagonal form of support and resistance. A rising line can mark an area where higher lows have formed, while a falling line can mark an area where lower highs have formed. Unlike a horizontal level, the reference price changes as the line extends across time.
This makes trend lines one part of broader support and resistance analysis. For comparison, forex pivot points are calculated from previous session data, whereas trend lines are drawn from visible swing structure.
Uptrend Lines, Downtrend Lines, and Channels
Three common structures are uptrend lines, downtrend lines, and channels.
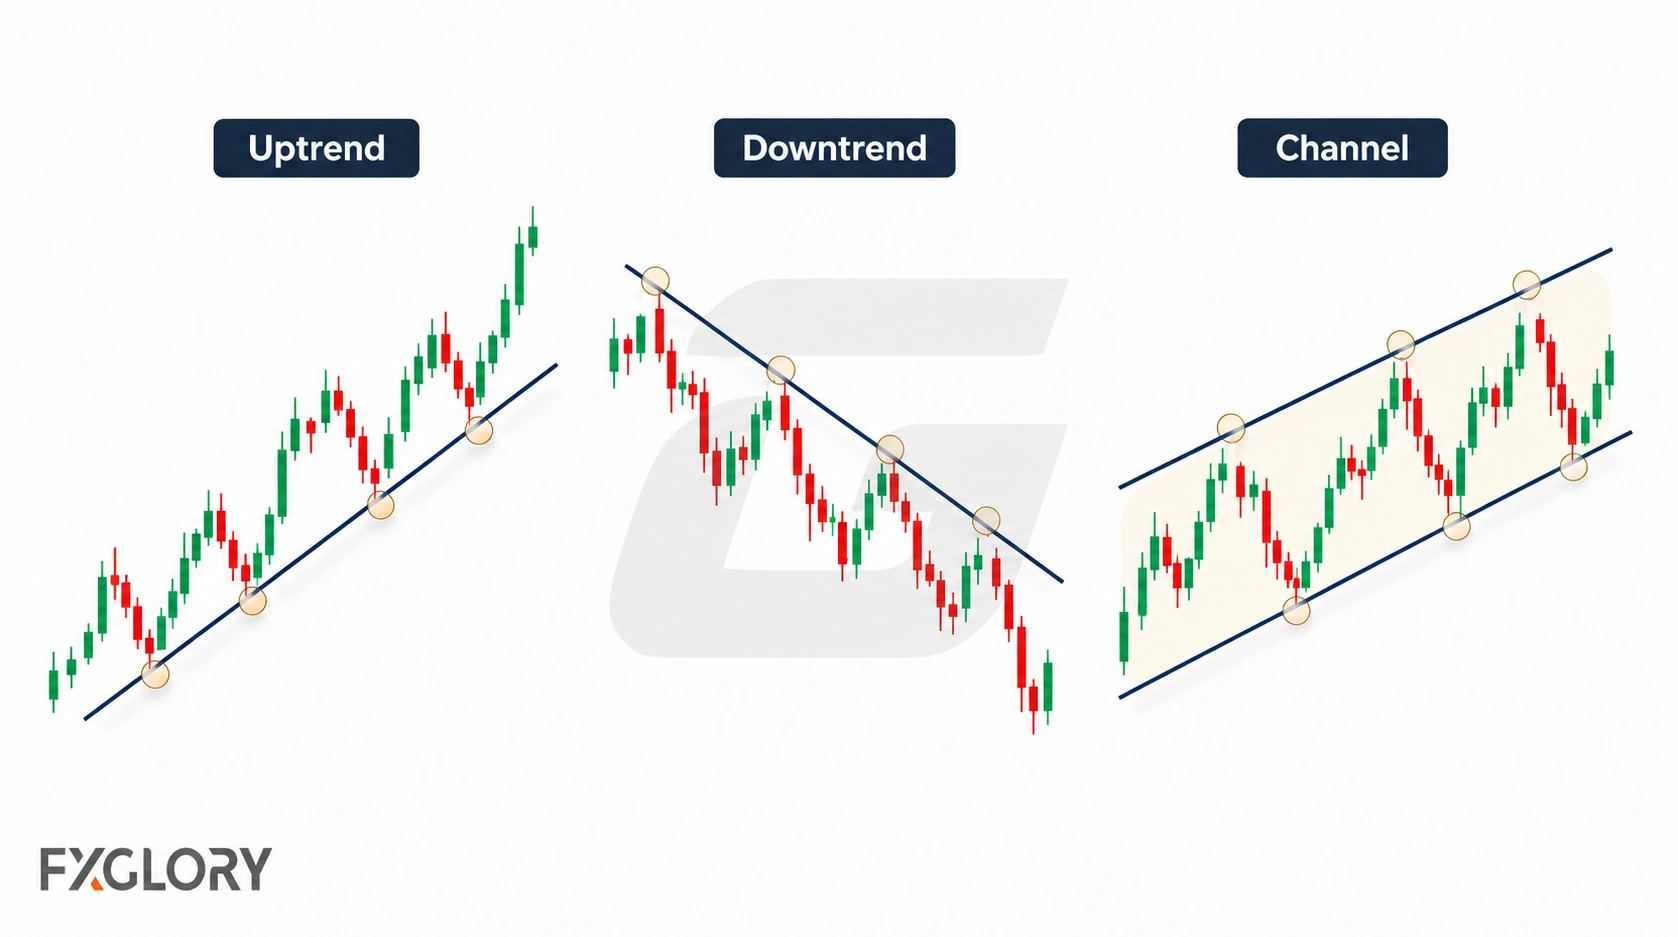
- Uptrend line: Connects rising swing lows below price.
- Downtrend line: Connects falling swing highs above price.
- Trend channel: Adds a roughly parallel boundary on the opposite side of price movement.
A channel is useful only when both boundaries correspond reasonably well with actual price reactions. If one side repeatedly fails to describe the structure, it can be clearer to treat the better-supported boundary as a single trend line rather than forcing a symmetrical channel.
How to Draw Forex Trend Lines Correctly
Start with the price structure that is already visible rather than drawing a line to support a preferred market view.
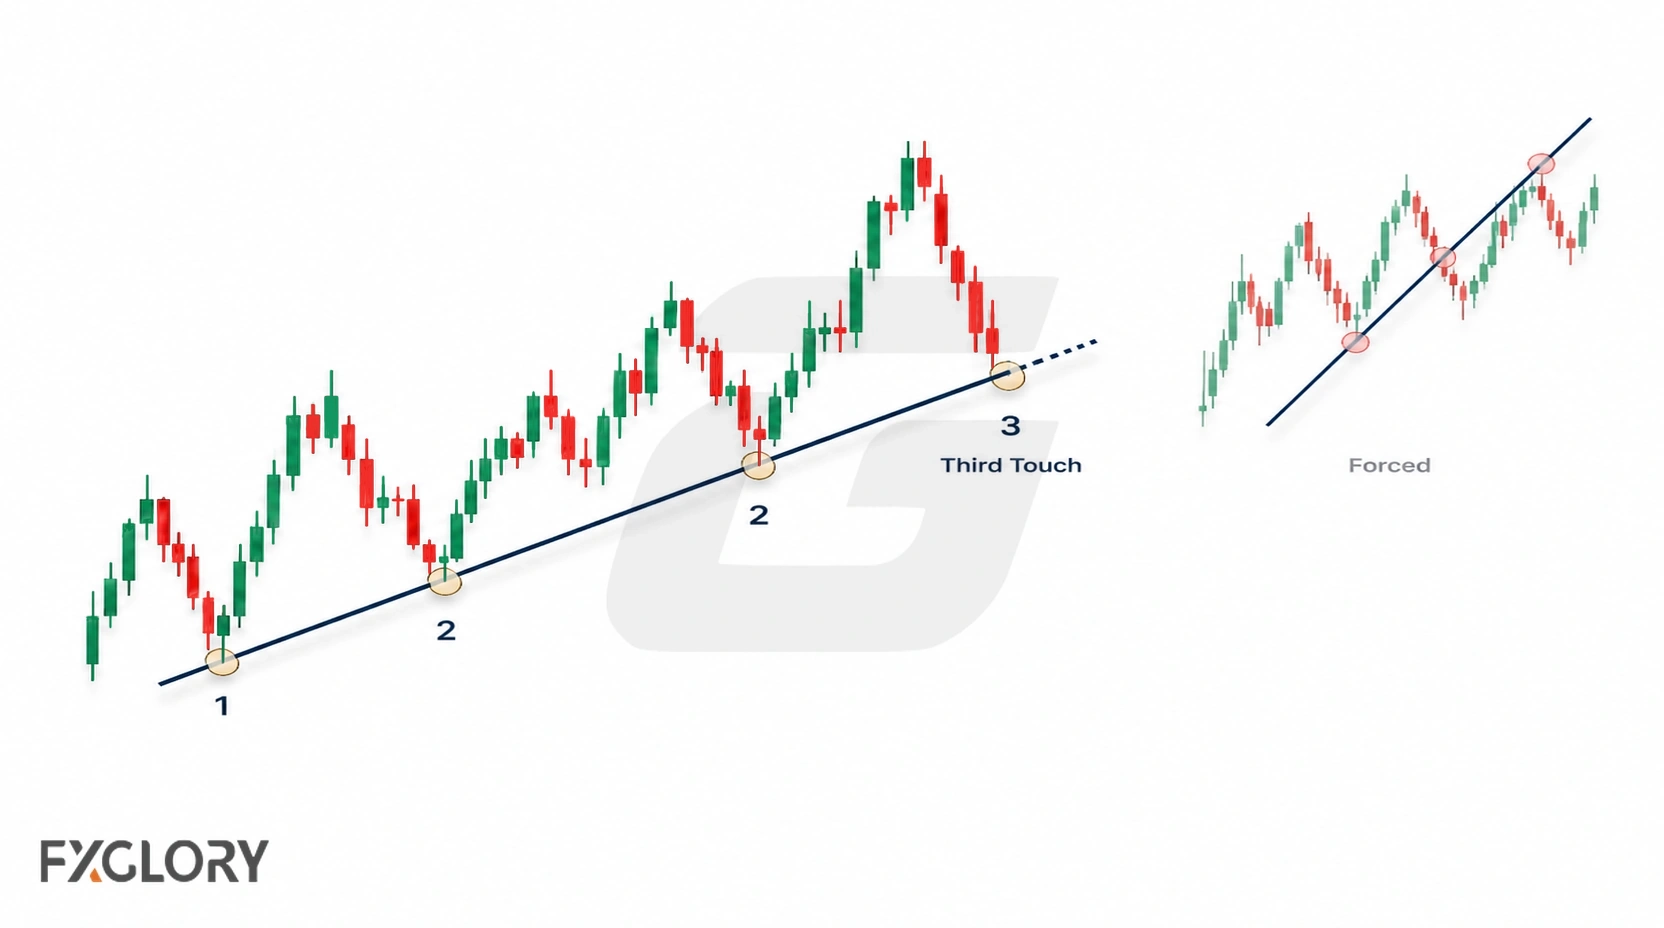
- Find meaningful swings: Use highs or lows that clearly belong to the structure being analysed rather than tiny fluctuations.
- Choose the relevant side of price: Connect rising swing lows for an uptrend line or falling swing highs for a downtrend line.
- Connect two anchor points: Two points define the line geometrically, but they do not guarantee another reaction.
- Extend the line forward: The extension provides a reference for comparing later price behavior with the earlier swing structure.
- Review later interactions: A later touch, overshoot, break, or retest adds information about whether the original placement still describes the chart.
- Avoid forced placement: If the line repeatedly cuts through unrelated price action, another interpretation may fit the structure better.
How to Evaluate an Existing Trend Line
Trend-line quality is not determined by a universal number of touches. Instead, judge whether the chosen line continues to represent meaningful price structure without repeated adjustment.
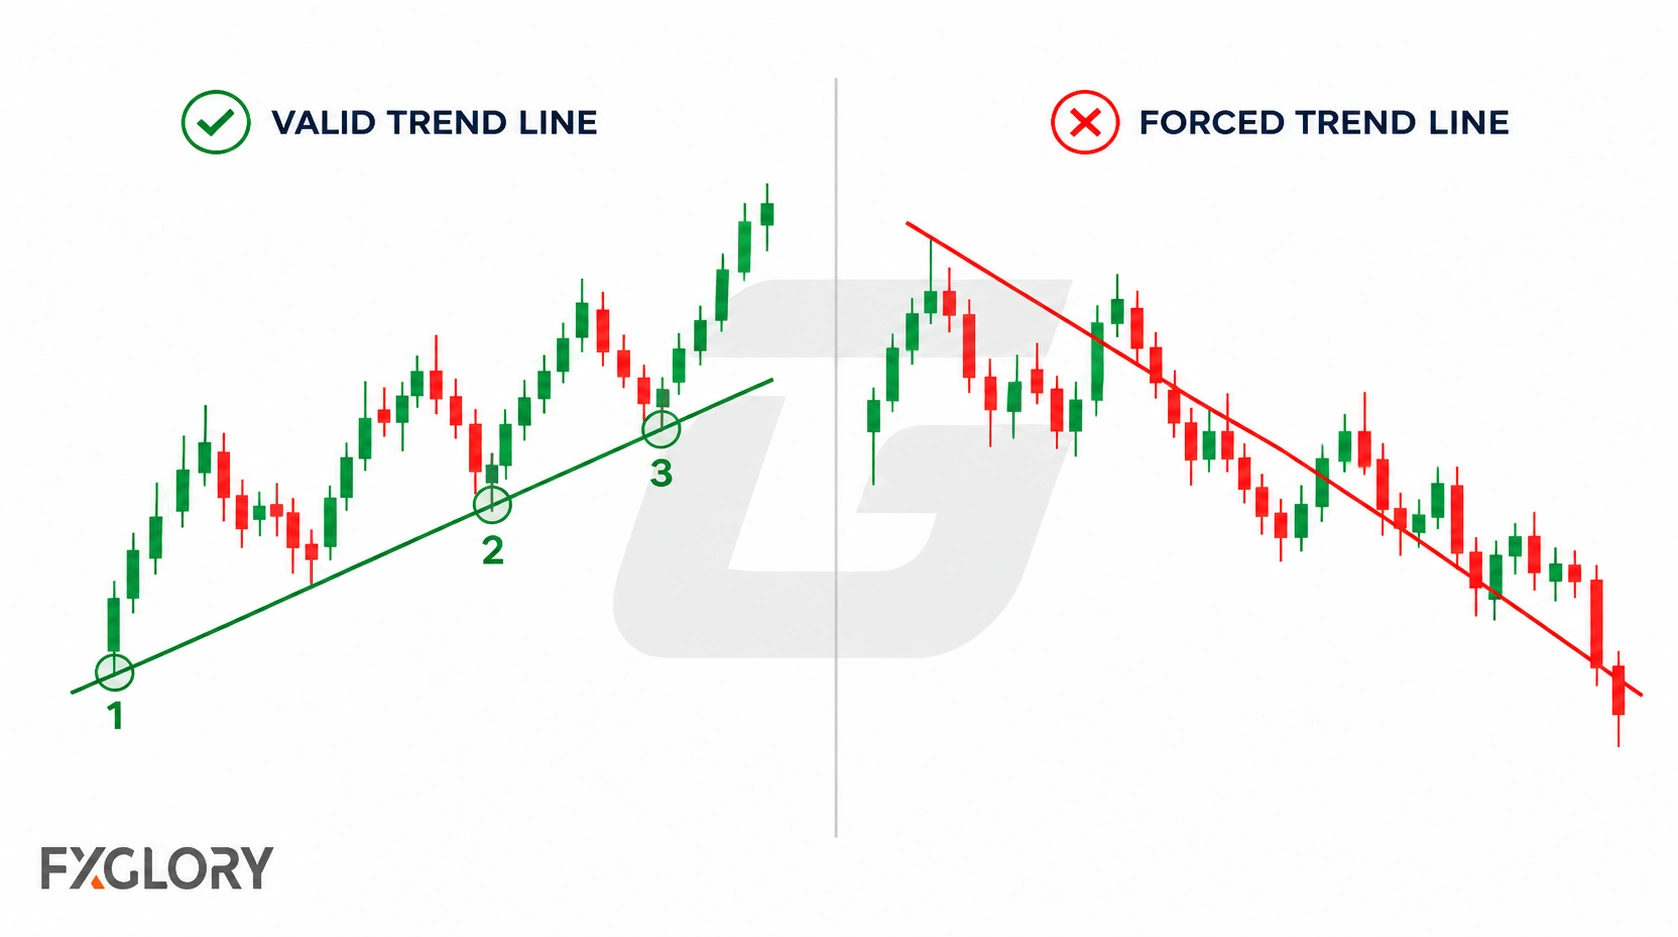
- Anchor quality: The line is based on meaningful swings rather than minor chart noise.
- Subsequent behavior: Later price interactions broadly support the original placement instead of repeatedly slicing through it.
- Structural fit: The line agrees with the broader sequence of highs and lows rather than contradicting it.
- Stable placement: The line does not need constant adjustment simply to remain visually relevant.
Two points are enough to define the line, while a later reaction provides additional evidence about its ongoing relevance. More touches are not automatically better if price repeatedly crosses the same diagonal area.
Should Trend Lines Use Wicks or Candle Bodies?
Trend lines can use wicks, candle bodies, or a combination when those anchors best describe the structure being studied.
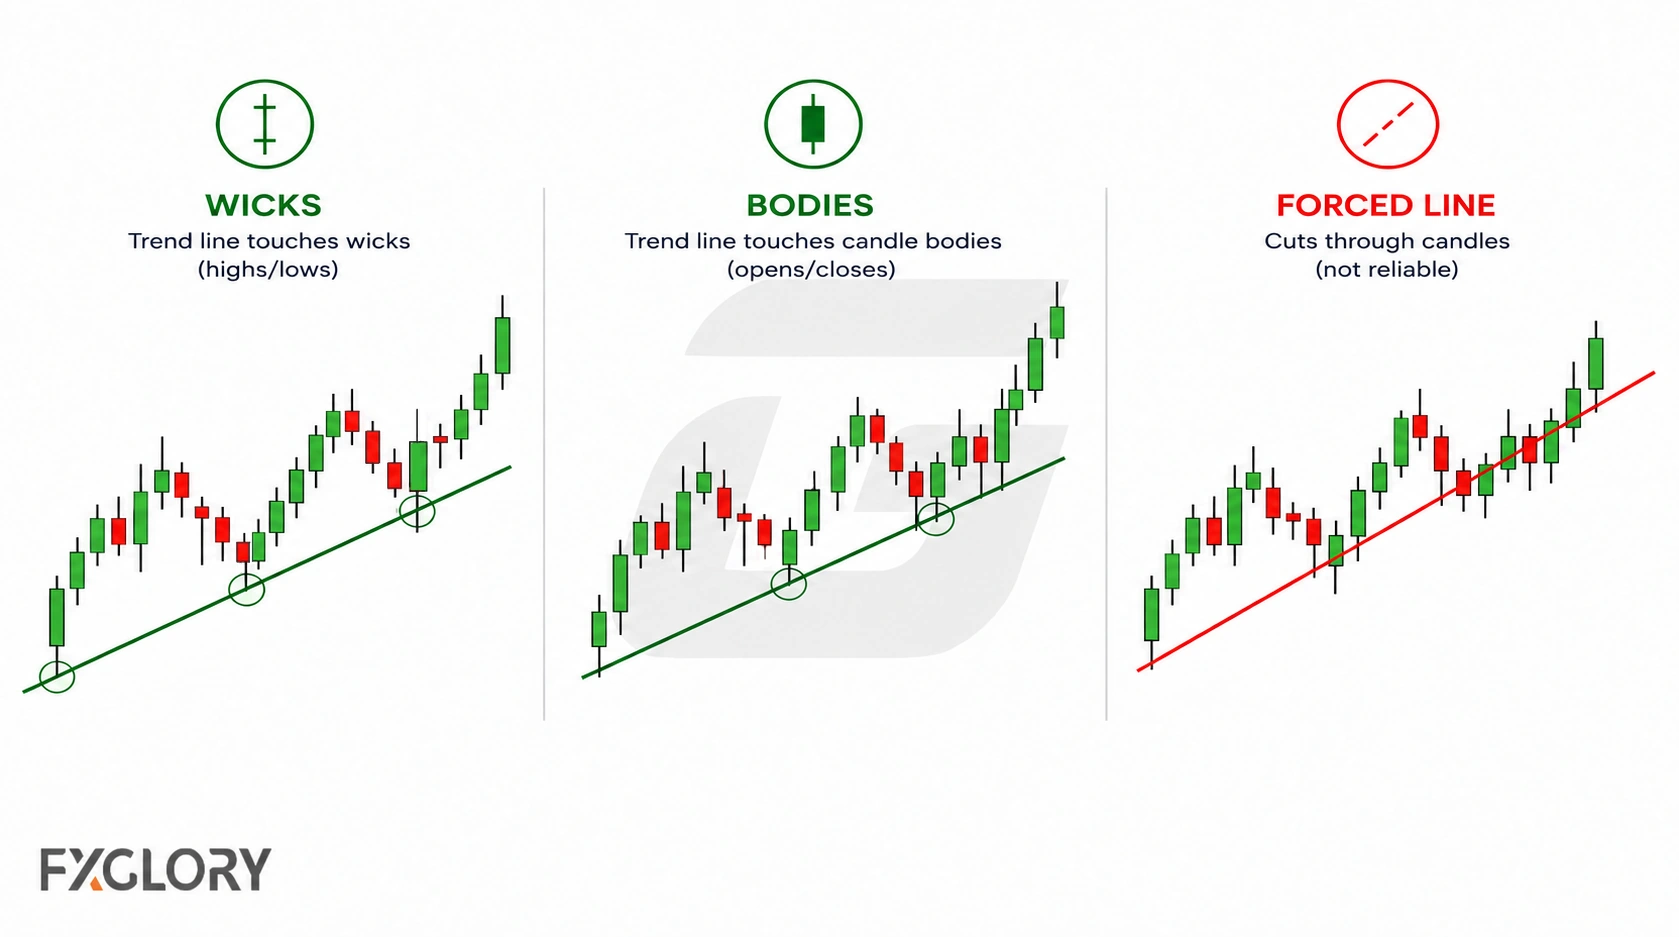
Wicks can highlight where price reached before reversing, while bodies can highlight where candles opened and closed. There is no single required method for every chart. The important discipline is to avoid switching anchors only to make a predetermined line fit.
Trendline Bounce, Break, Retest, and Flip
When price approaches or crosses a projected trend line, the next step is to describe what price actually does rather than assume the line must hold.
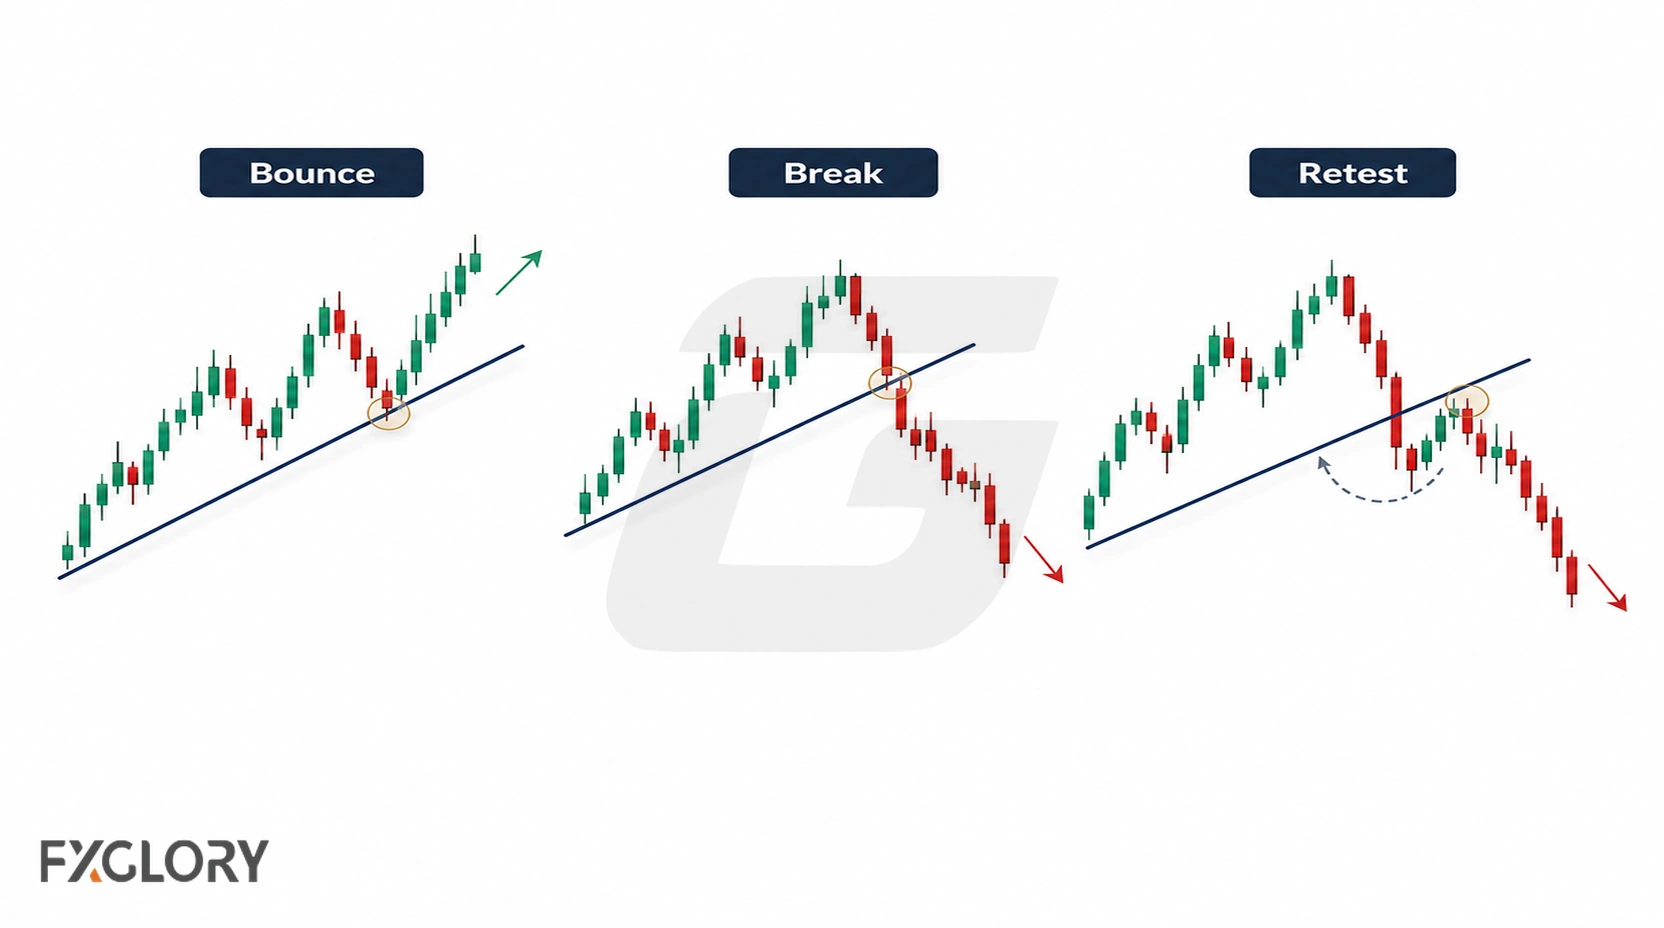
Trendline Bounce
A bounce occurs when price reaches the trend-line area and then moves away from it. Instead of labeling a bounce as automatically strong or weak, traders can separately examine the reaction around the line, nearby opposing levels, and the price behavior that would contradict the original idea.
Trendline Break
A break occurs when price moves through the projected line. That crossing alone does not establish a trend reversal. Compare it with subsequent closes, the surrounding swing structure, and whether price remains on the other side.
Trendline Retest
A retest occurs when price moves through a trend line and later returns toward the same diagonal area from the opposite side. The return can show whether the old line still influences price behavior or whether the market is forming a different structure. For a fuller trading framework around this sequence, see the break and retest strategy.
Trendline Flip
A flip describes a broken trend line that later appears to act from the opposite side: former diagonal support may act as resistance, or former diagonal resistance may act as support.
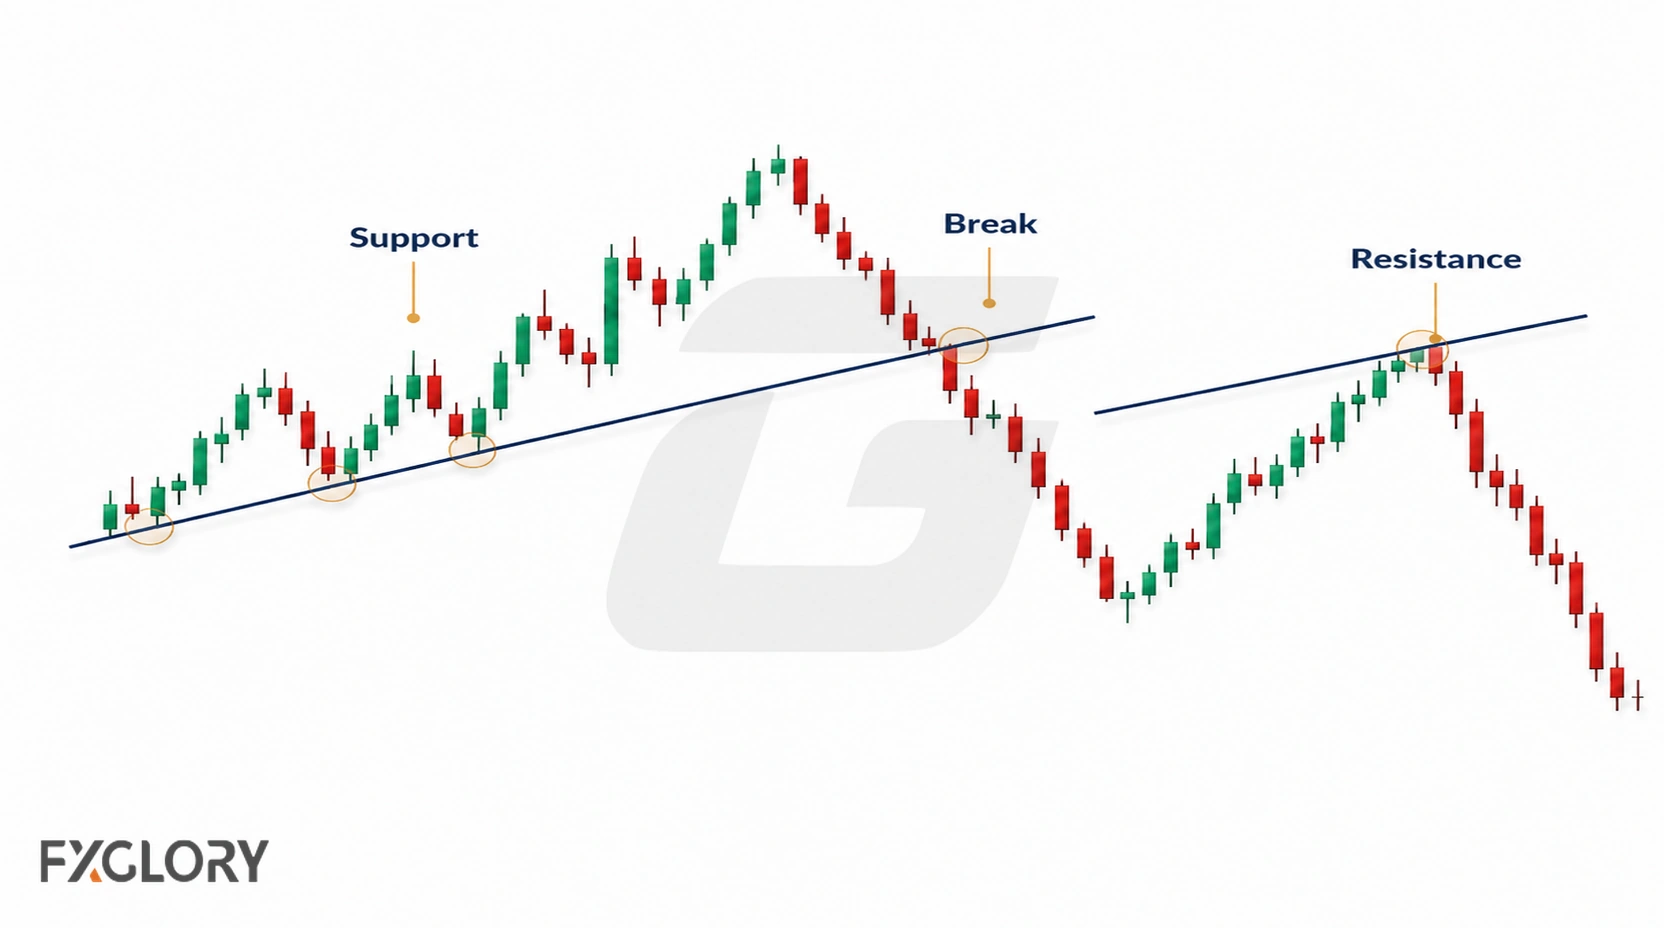
A flip is an observed price behavior, not a rule that follows every break. If later price action repeatedly crosses the old line, the line may no longer be a useful representation of current structure.
When to Delete or Redraw a Trend Line
Keep a trend line only while it helps describe the structure currently visible on the chart.
- Delete it when price repeatedly cuts through the line without meaningful reaction.
- Delete it when a changed swing sequence makes the old line irrelevant to the current structure.
- Redraw it when a clearer sequence of swing highs or lows provides better anchors.
- Do not redraw it merely to preserve an old bias or active trade idea.
Removing obsolete lines also reduces chart clutter and makes the remaining structure easier to interpret.
Using Trend Lines Across Timeframes
Different timeframes can show different swing structures, so first decide which timeframe defines the line you are analysing. A broader timeframe can provide context, while a lower timeframe can show more detail around a reaction, break, or retest.
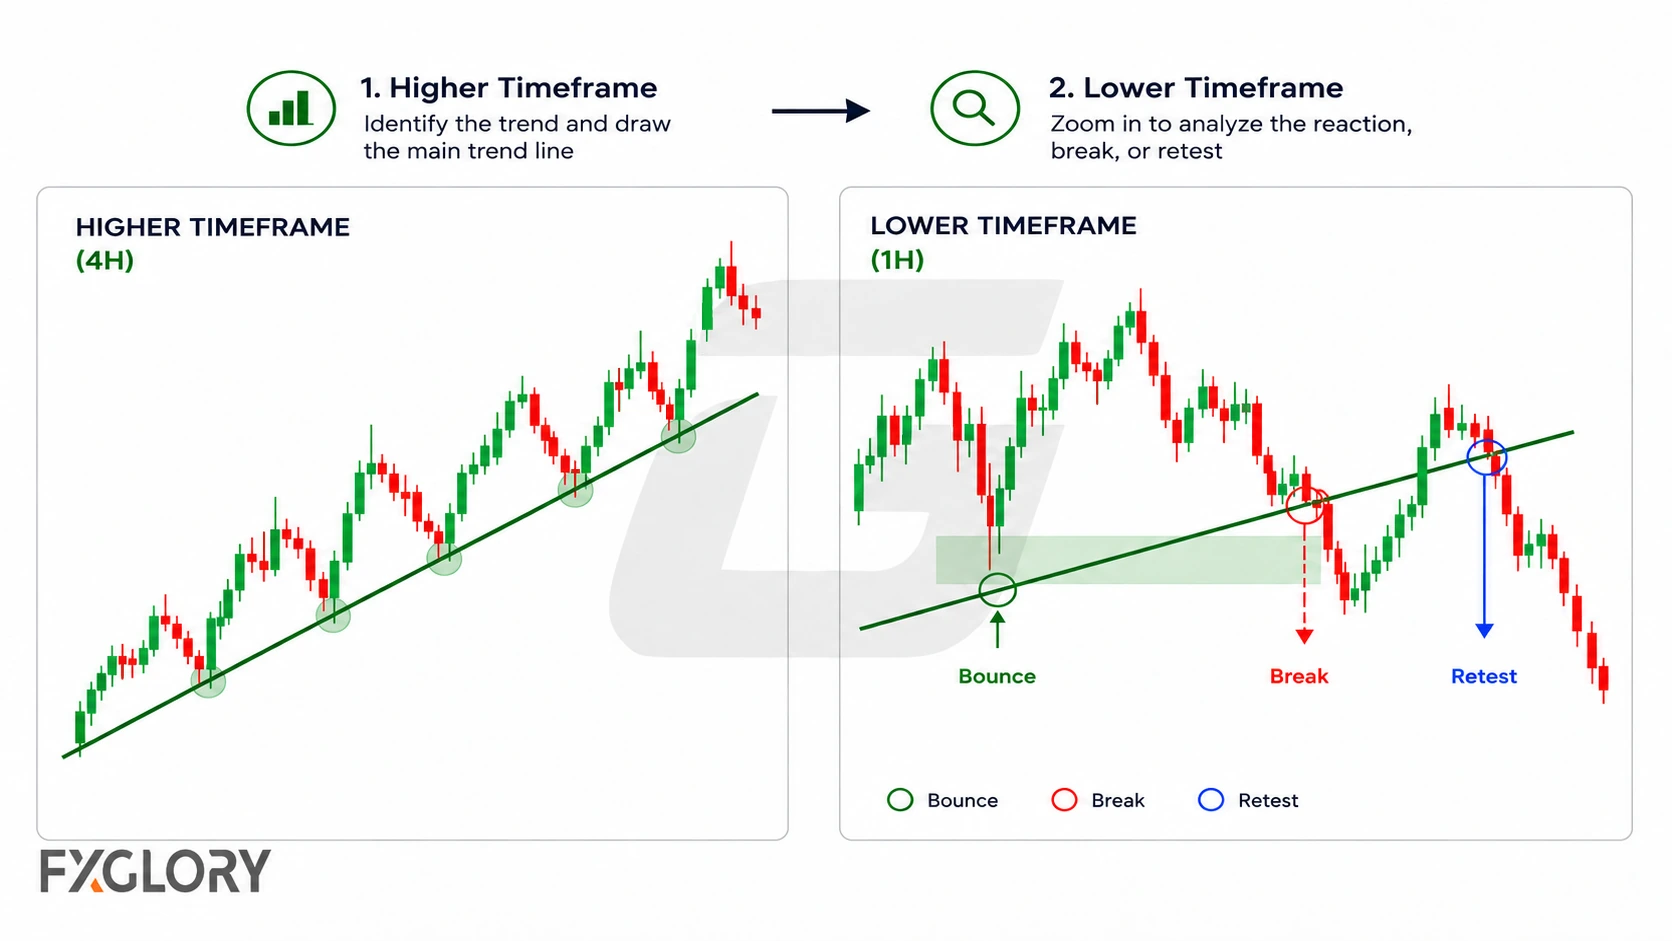
Keep the roles separate: a lower-timeframe fluctuation may add detail without changing the swing structure that produced the higher-timeframe line. If the broader structure itself changes, reassess the original line rather than forcing both timeframes to agree.
Example: Reading an Uptrend-Line Pullback
Suppose a currency pair forms two meaningful higher swing lows. Connecting them defines an uptrend line that can be extended forward as a reference. If price later returns to that area, the new interaction supplies evidence about whether the original line still represents the rising structure.
If subsequent price action holds near the line and the sequence of higher lows remains intact, the line may continue to describe the structure. If price repeatedly closes below the projected line and the swing sequence changes, the original placement may need to be reassessed.
Using Trend Lines with Other Information
A trend line supplies information about location and structure. Other tools are most useful when they contribute a different type of information rather than repeat the same visual judgment.
Candlestick Behavior
Candles can show how price behaves around the line, including rejection, closes beyond it, or repeated trading through the area. Traders can compare this with reversal candle behavior near support and resistance.
Trend Strength
A trend line does not measure trend strength by itself. Traders who want a separate strength measure can review ADX as a trend-strength indicator.
Pattern Context
Trend lines can also form part of channels, triangles, wedges, and other chart structures. In those cases, interpret the line in the context of the larger pattern rather than treating it as an independent signal.
Common Trend Line Mistakes and Limits
- Forcing the line: Selecting anchors to support a preferred conclusion instead of following visible swing structure.
- Treating a crossing as an automatic reversal: Moving through a line does not by itself prove that the broader trend has changed.
- Using insignificant swings: Tiny fluctuations can create lines that describe chart noise rather than the structure being analysed.
- Keeping obsolete lines: Old diagonal references can become misleading after the swing structure changes.
- Treating the line as a complete trading system: A trend line does not determine position size, execution quality, or future price direction.
When Trend Lines Are Less Useful
Trend lines can be difficult to interpret when price is choppy, swings overlap heavily, or no clear sequence of highs or lows is visible. They can also become less informative after abrupt price movement changes the structure that produced the original anchors.
Final Thoughts on Trend Lines in Forex
A trend line is most useful as a concise visual reference for observed swing structure. Draw it from meaningful anchors, judge it by later price behavior, and remove or redraw it when new structure makes the old placement less representative.