
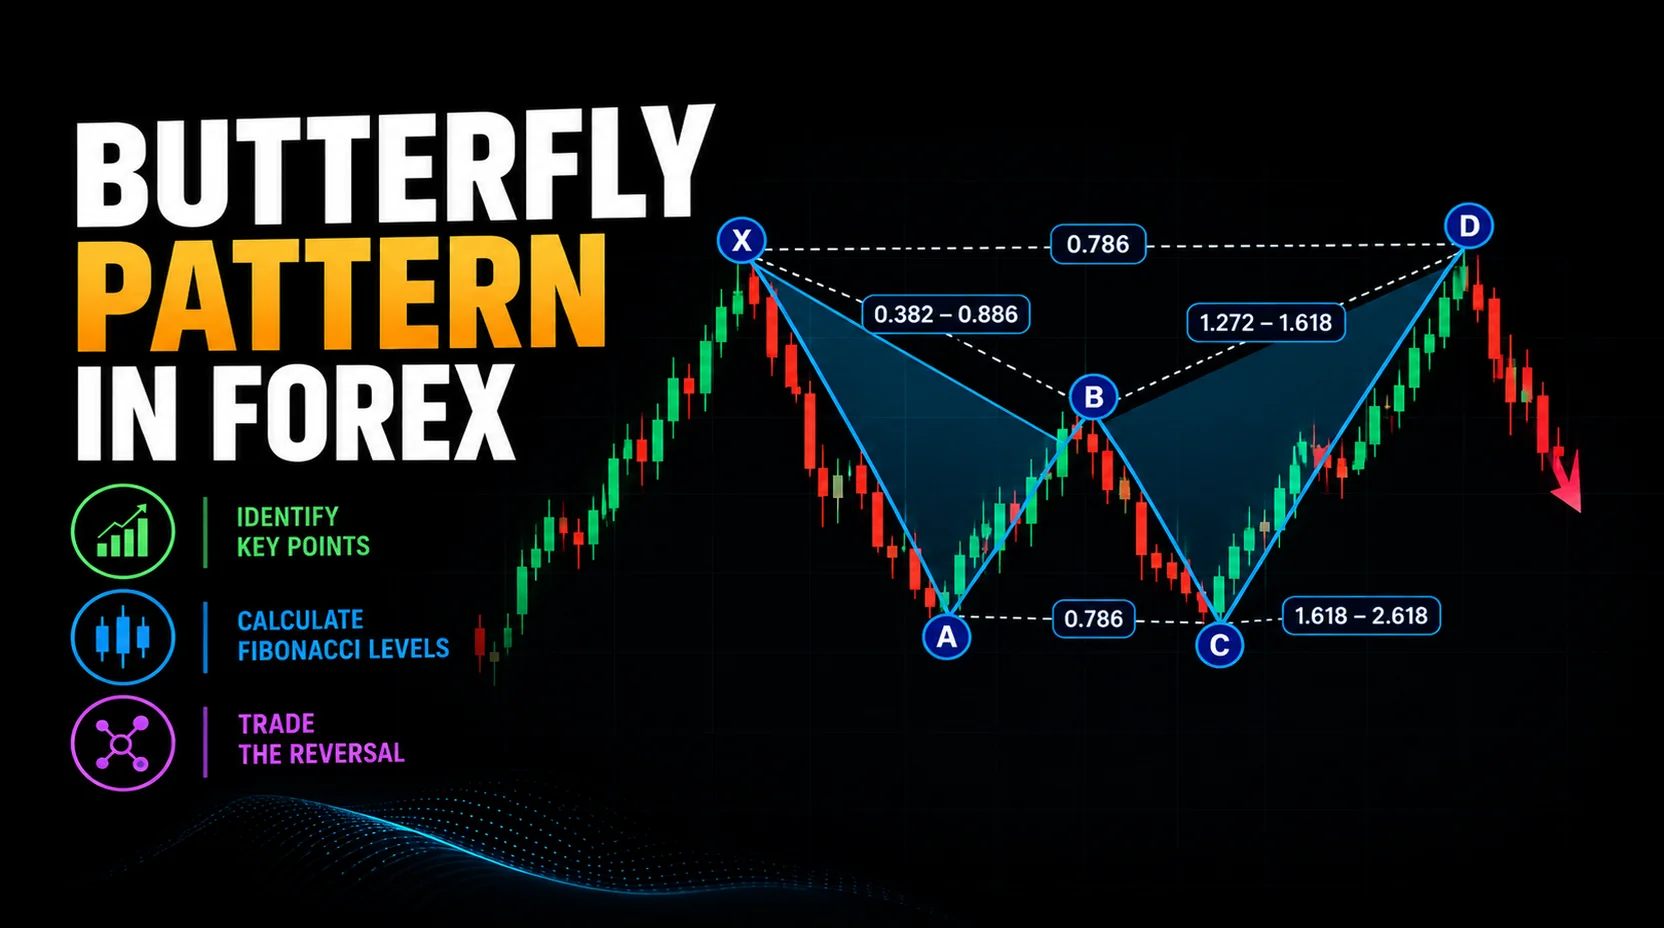
What Is the Butterfly Pattern in Forex?
The Butterfly pattern in forex is a harmonic chart structure that uses X, A, B, C, and D points with Fibonacci retracement and extension ratios. It is usually studied as an advanced potential reversal pattern.
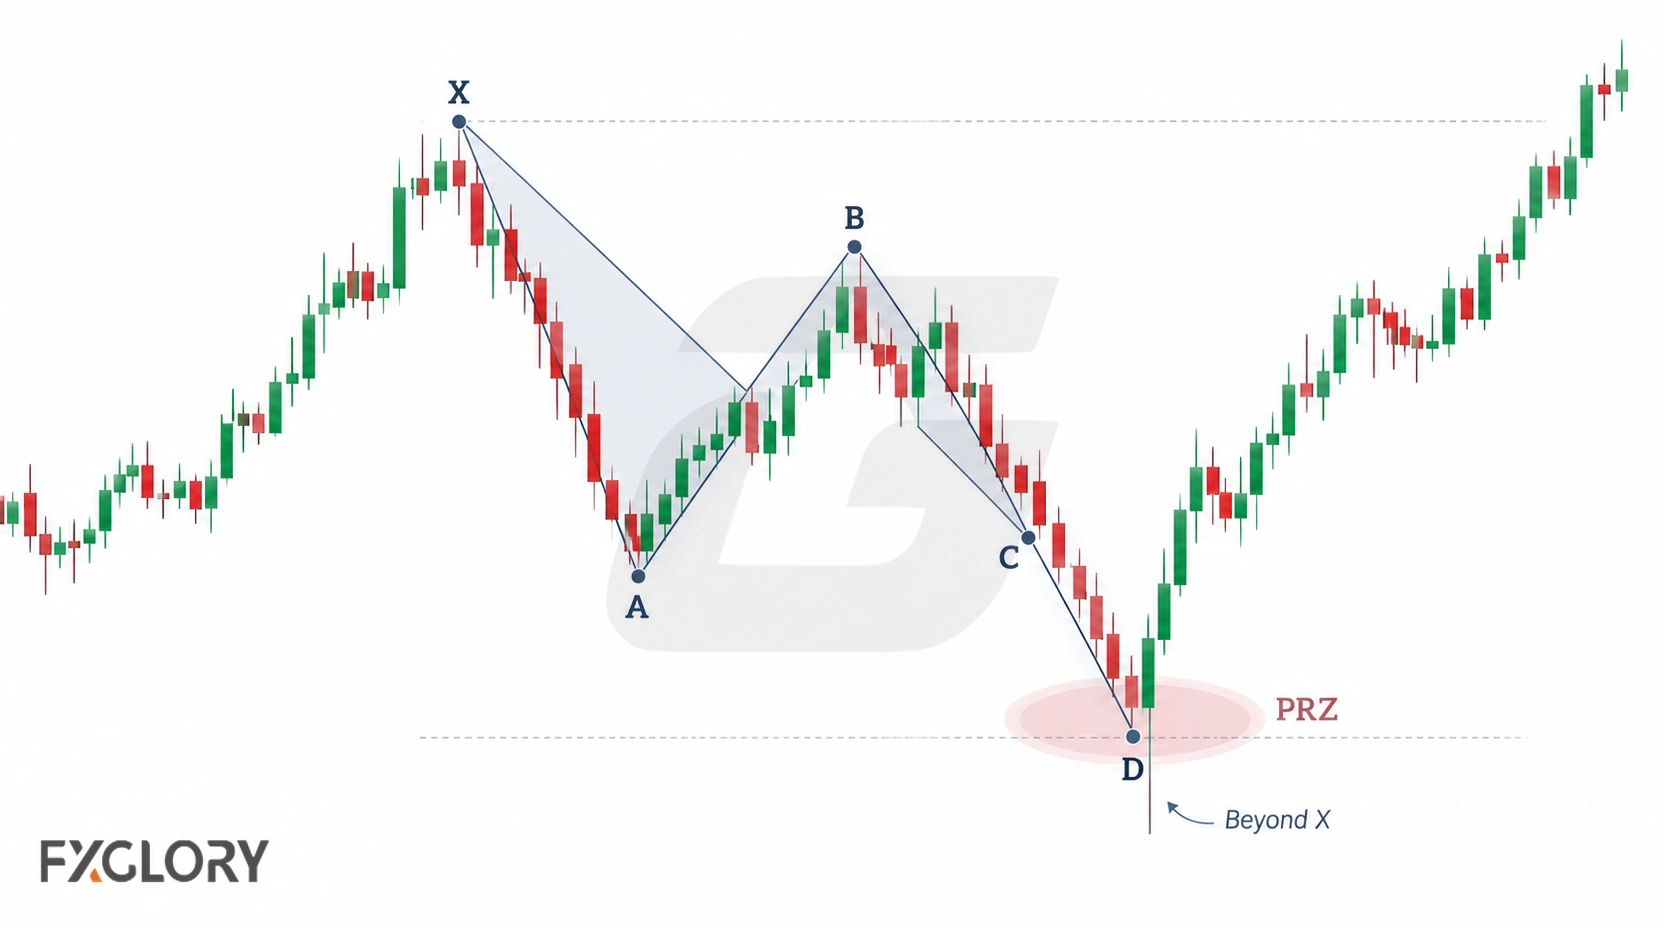
The defining feature of the Butterfly pattern is that point D often completes beyond the starting X point. This makes it different from harmonic structures that complete inside the XA range. The D area is usually studied as a potential reversal zone, but it is not a guaranteed turning point.
The Butterfly belongs to the larger harmonic-pattern family. For the broader XABCD framework, ratio validation, and harmonic-pattern types, use the harmonic-pattern family guide.
Butterfly XABCD Anatomy and Formation
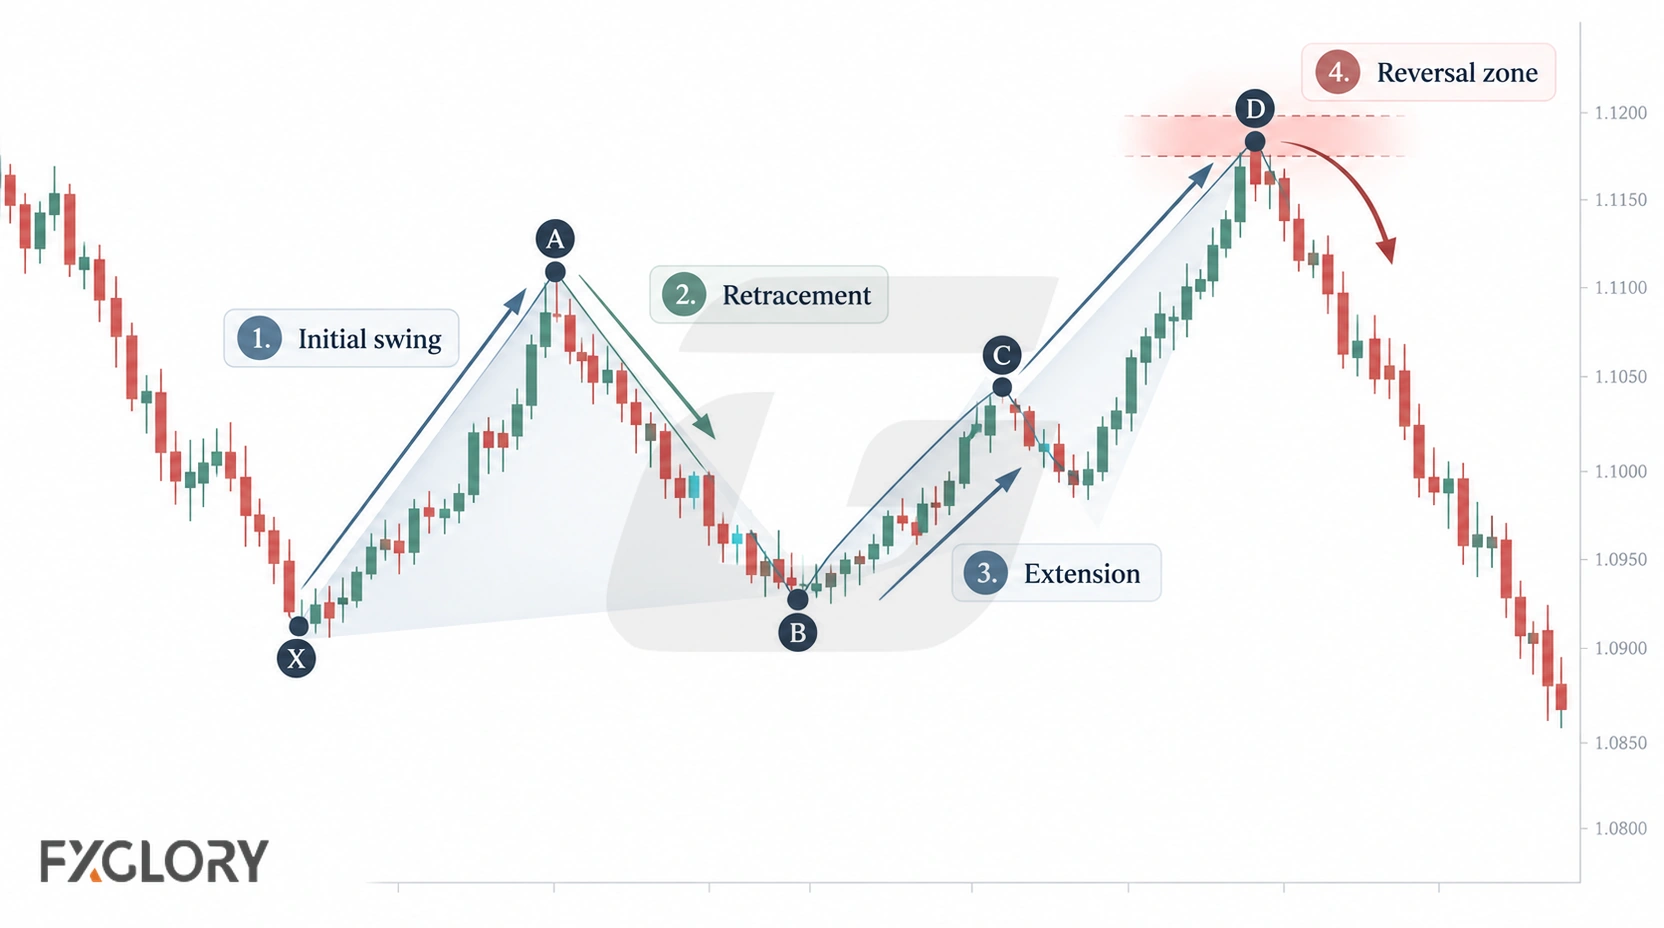
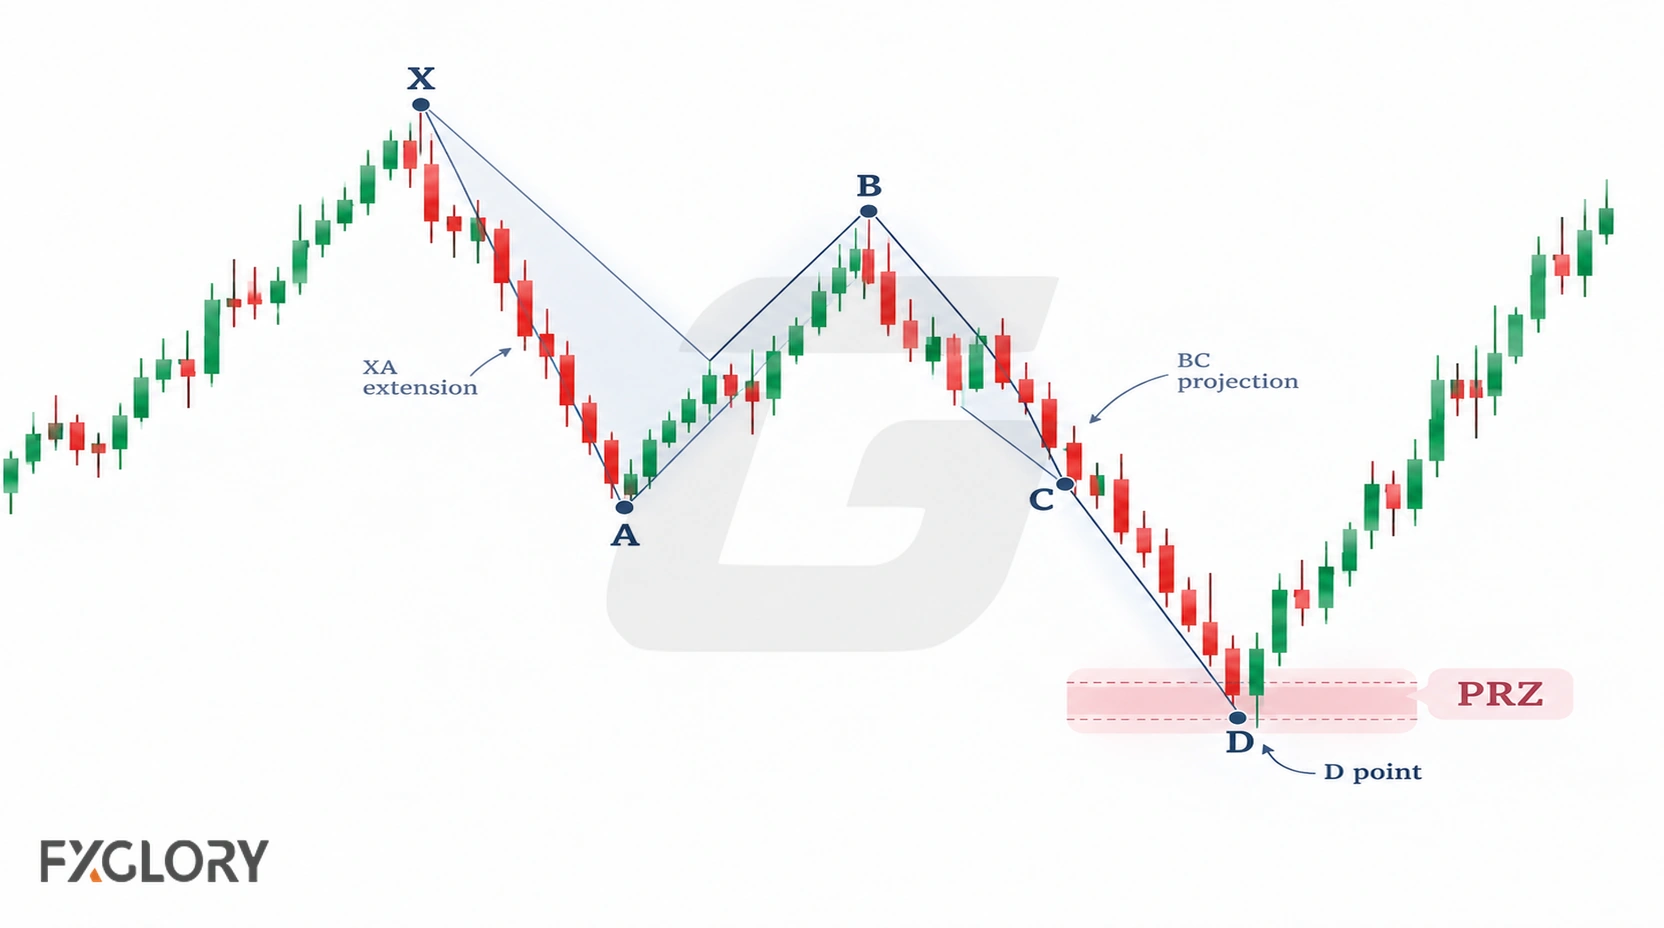
The Butterfly begins with a directional XA swing, followed by AB and BC retracements and a final CD move toward a projected D area beyond X. Before D develops, XABC is a candidate, not a completed Butterfly.
| Point or leg | Structural role | What to measure |
|---|---|---|
| XA | Initial directional swing between X and A | Baseline length for B and D |
| AB | Deep move back against XA | B retracement of XA, classically 78.6% |
| BC | Counter-move against AB | C retracement of AB |
| CD | Final movement toward D | BC projection and AB=CD relationships |
| D | Geometric completion at a measured area beyond X | Confluence of chosen Fibonacci projections |
A completed structure and a trade-ready setup are different: chart geometry can meet the chosen Butterfly definition without a stop, entry, or position size being selected.
Butterfly Fibonacci Ratios
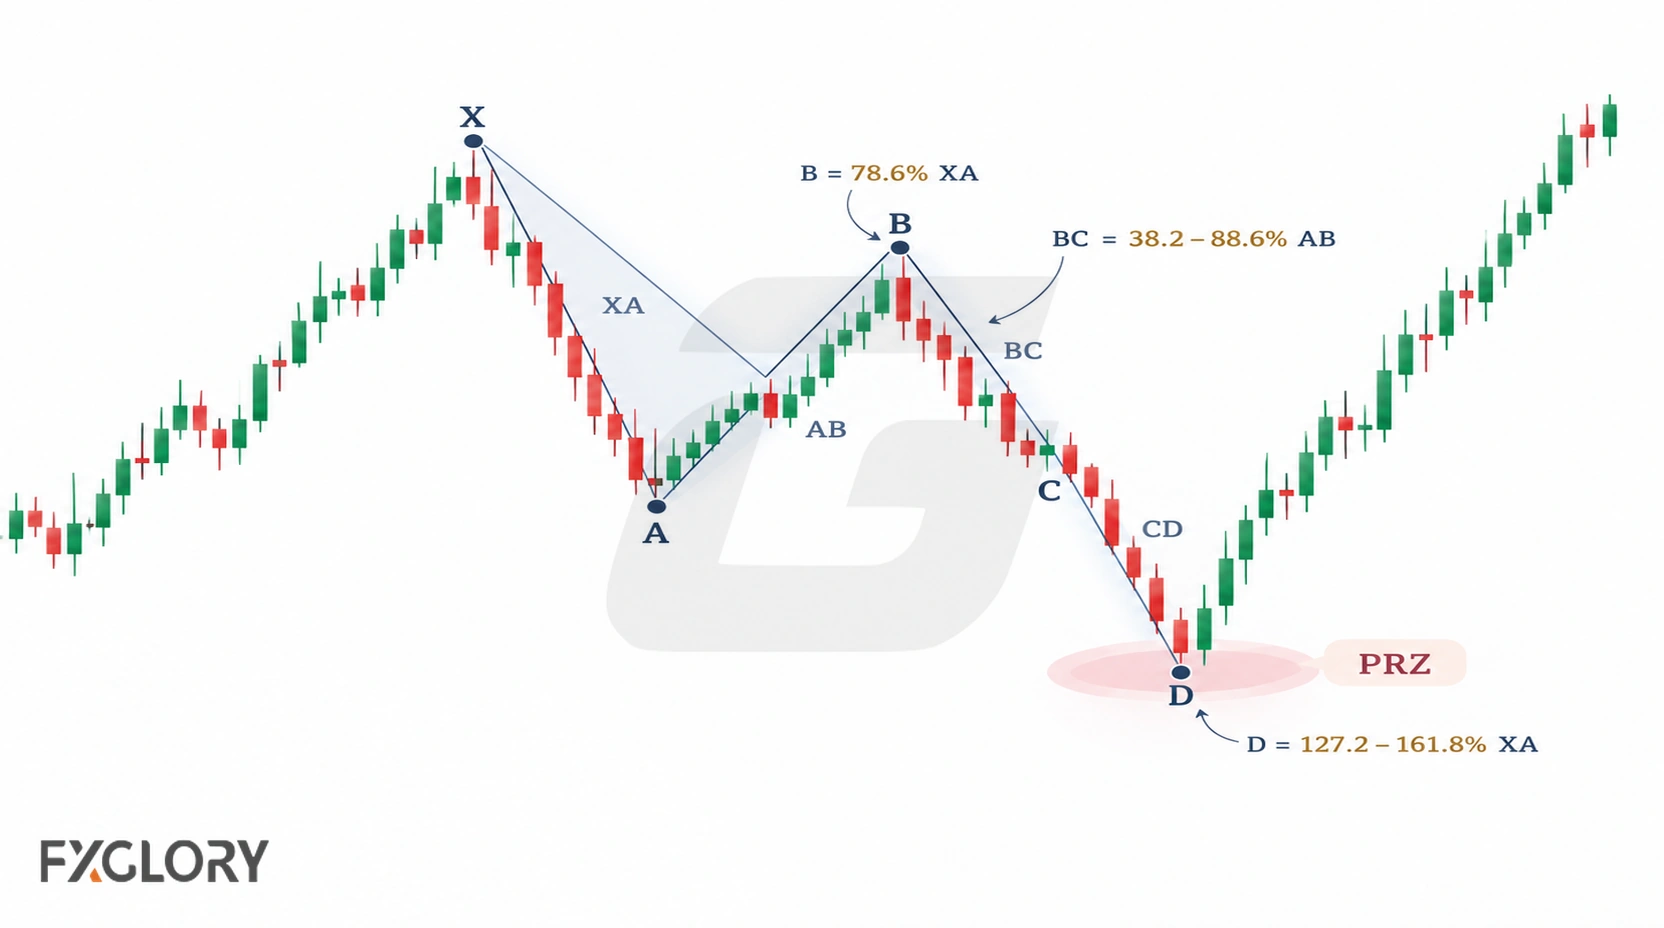
Butterfly specifications differ across harmonic methodologies. Under a restrictive classical interpretation, B retraces approximately 0.786 of XA, and the principal D completion is a 1.27 XA projection beyond X. Broader variants also discuss D near 1.618, but a broader range should not be described as one universally agreed classical rule. Always state which definition you are testing.
| Relationship | Reference | Interpretation |
|---|---|---|
| AB / XA | 0.786 retracement | Characteristic deep B point in the classical Butterfly |
| BC / AB | Commonly 0.382–0.886 retracement | Constrains the C swing without fixing one exact price |
| CD / BC | Common BC projection references include 1.618, 2.0, 2.24 and 2.618; the appropriate level depends on C and the chosen rules | Provides an independent D estimate, not a standalone Butterfly definition |
| D projection relative to XA | 1.27 classical; some broader interpretations consider up to 1.618 | Locate D beyond X and distinguish the rule set used |
| AB=CD relationships | Equality or an alternate proportional AB–CD projection, depending on the methodology | Additional confluence to evaluate, not a mandatory universal substitute for XA and BC |
For an upward XA swing, a bullish extension is projected downward from A: D = A − 1.27 × (A − X). Thus D is 0.27 × XA below X. A bearish structure reverses the arithmetic. This prevents the common error of measuring another full 1.27 × XA beyond X. Readers unfamiliar with the measurement tools can review Fibonacci retracement and extension calculations.
Building the Butterfly Potential Reversal Zone
A potential reversal zone (PRZ) is an interval in which separately calculated D projections lie reasonably close. Start with the specified XA projection, compare a compatible BC extension and the relevant AB=CD projection, and record the resulting price range. The zone should not be widened indefinitely just to accommodate the final swing.
| Component | Practical question |
|---|---|
| XA extension | Does D meet the selected 1.27-based classical rule or clearly identified alternative? |
| BC extension | Does the CD movement implied by B and C meet a recognised proportional projection? |
| AB–CD relationship | Does a relevant equality or alternate projection reinforce the same area? |
| Zone width | Are the projections close enough to provide a meaningful, testable completion interval? |
The PRZ is geometric evidence of where a Butterfly might finish, not evidence that buying or selling pressure has already reversed. Bid–ask spread and fast price movement make exact-line interpretations especially fragile.
Bullish vs Bearish Butterfly Pattern
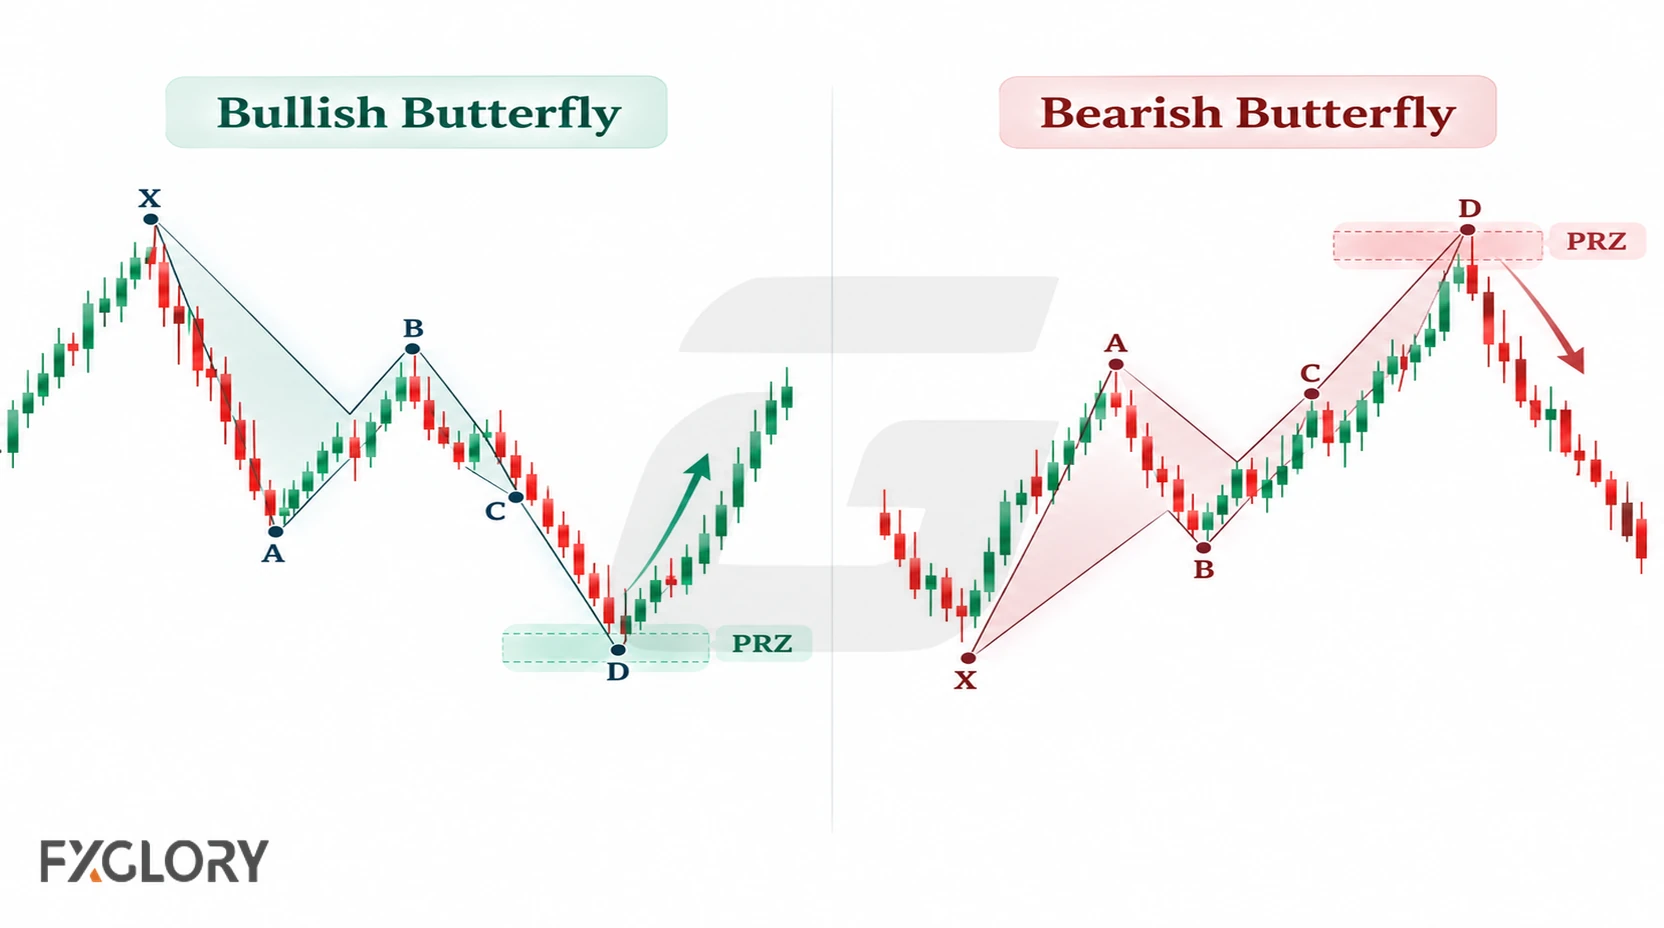
Butterflies can project a possible upward reaction after a downward CD leg (bullish) or a downward reaction after an upward CD leg (bearish). The chart orientation changes, but the proportion tests do not.
| Form | D location | Possible outcome to assess |
|---|---|---|
| Bullish | Below X after the final declining leg | A subsequent upward reaction |
| Bearish | Above X after the final rising leg | A subsequent downward reaction |
Neither completed form constitutes an automatic entry order.
Butterfly vs Gartley, Bat and Crab
The Butterfly can be confused with other harmonic patterns because many of them use XABCD points. The difference is usually in the B retracement, the D completion area, and whether D completes inside or beyond the XA range.
| Pattern | Quick Clue | Careful Reading |
|---|---|---|
| Butterfly | D usually completes beyond X as an extension pattern | Focus on the 78.6% B concept and the D extension area |
| Gartley | D often completes inside the XA range | Do not treat every XABCD pattern with a deep D as Gartley |
| Bat | Often uses a different B and D profile from the Butterfly | Small ratio differences can change the pattern family |
| Crab | Often uses a deeper extension-style completion | Deep extensions can look similar but need their own validation |
For the wider harmonic family, including Gartley, Bat, Crab, Shark, and other structures, return to the guide to harmonic structures. This page stays focused on Butterfly-specific ratio and extension logic.
Valid Structures, Weak Candidates and False Signals
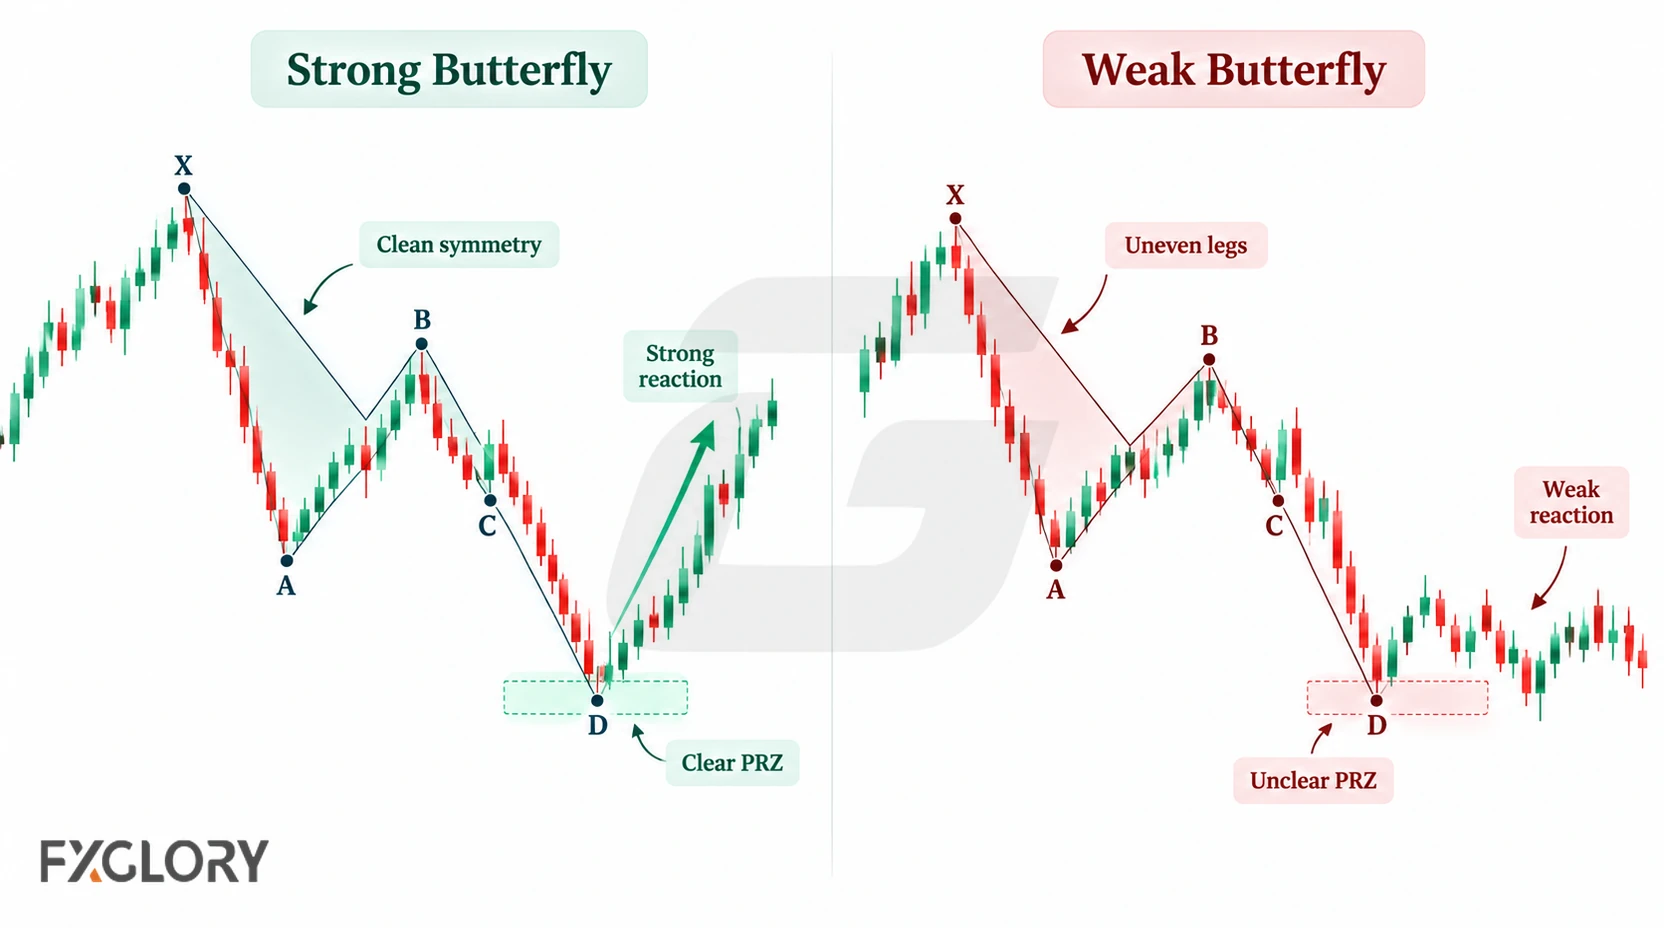
Pattern identification depends on the measured swings, not on whether a later trade wins. The comparison below separates geometric weaknesses from subsequent market outcomes.
| Observation | Classification | Explanation |
|---|---|---|
| Clear XABC, D not yet reached | Unconfirmed candidate | Do not call the structure completed before the specified D condition occurs |
| Forced B, noisy C, or D inside XA | Misidentified or weak Butterfly | Geometry may not satisfy the chosen Butterfly rules |
| Price reaches an appropriately measured D zone | Structurally completed pattern | Completion is geometric, regardless of whether price subsequently reverses |
| Completed D followed by sustained continuation instead of the hoped-for reversal | Completed pattern with an unsuccessful reversal scenario | The later outcome does not erase the earlier geometric completion |
| Scanner label changes with pivots | Potentially unstable detection | Verify swing selection and settings manually |
A clear-looking sketch is not proof of a well-measured pattern. Likewise, an unsuccessful reversal does not by itself prove that the original ratios were false.
Completion, Price Confirmation and Trade Readiness
Candidate: XABC suggests a possible D zone. Completed pattern: the final swing reaches a D level that satisfies the specified harmonic rule set. Confirmed price response: a separately chosen post-D behaviour occurs. Trade-ready setup: the entry, invalidation, stop, size, costs and acceptable account risk have been evaluated. These are successive analytical questions, not interchangeable definitions.
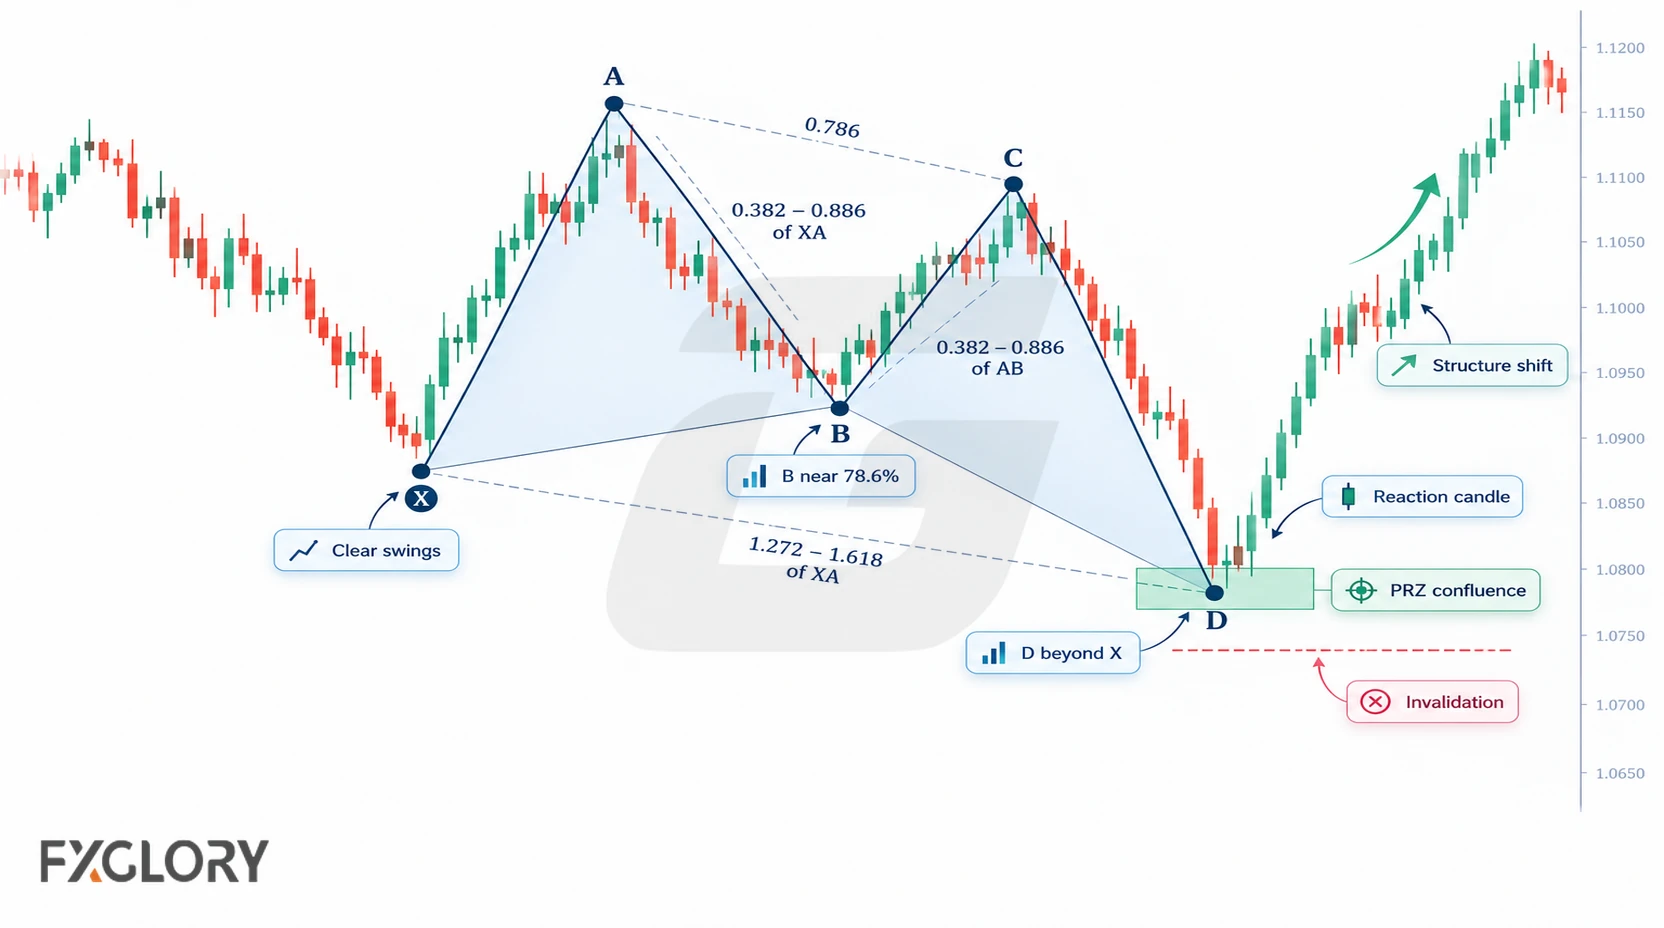
For example, a trader might require a completed candle to close above a designated minor swing high after a bullish D completion, or below a designated minor swing low after a bearish completion. That is one illustrative confirmation rule; a PRZ touch, an intrabar breach, a candle close, a retest and follow-through are distinct observations. A retest or follow-through can add later evidence but need not be compulsory unless the particular strategy says so.
Momentum divergence, a rejection wick or a broken minor trendline can inform the assessment; none is automatically the same as the specified confirmation trigger. Even an observed trigger cannot guarantee the projected direction.
Pattern Failure vs Trade Invalidation
Structural nonqualification: the proposed swings fail the chosen ratio rules, or the projected D never develops; an incomplete candidate is not a failed completed Butterfly. Failed reversal scenario: D meets the pattern specification but subsequent price action does not sustain the anticipated turn. Trade invalidation: a particular trading strategy's conditions for exiting or cancelling a position are met.
These events do not share one automatic price threshold. A strategy may use a price beyond the PRZ, a swing level, a candle-close condition, or a time-based rule, provided its logic and transaction costs are evaluated beforehand. A stop-loss order is part of executing that plan, not part of the mathematical definition of the pattern; slippage can cause execution beyond the stop price.
After selecting an entry and stop, size the position from the stop distance, applicable pip or contract value and predetermined monetary risk. For detailed account-risk methods, see forex risk management. A Butterfly can be structurally completed even when no trade is justified.
Butterfly Pattern Scanner Limitations
Automated scanners can rapidly find XABC candidates or projected D areas, but their output depends on pivot sensitivity, timeframe, price feed and the harmonic conventions programmed into the tool. A scanner may redraw swings or label a candidate as completed before the final D condition is met.
Check the displayed B retracement, XA projection, BC relationship and actual D swing against a stated rule set. A scanner result is a shortlist for analysis, not an entry instruction.
Forex Market Conditions at Point D
Forex Butterfly patterns should be read with market conditions because currency pairs trade across global sessions. A potential reversal zone that looks clean during quiet movement may behave differently during a session overlap, economic release, or fast volatility shift.
- Session behavior: Price reactions around point D may behave differently during active sessions than during thin liquidity.
- News events: Economic releases and central-bank comments can overpower a Fibonacci-based structure quickly.
- Spread and slippage: Fast movement around the PRZ, retest, or invalidation area can affect execution and risk.
- Pair behavior: Different currency pairs may swing, retrace, extend, and react differently around harmonic zones.
- Timeframes: A lower-timeframe Butterfly pattern can conflict with a stronger higher-timeframe trend, support, or resistance area.
- Volume limits: Spot forex does not have one centralized exchange volume figure, so volume-style readings need careful interpretation.
Some traders watch whether tick activity changes around the Butterfly PRZ, but this remains supporting context. When volume-style context matters, tick-volume reading in forex should stay secondary to structure, ratio validation, confirmation, and risk.
Using Indicators and Candles With Butterfly Patterns
Candles, momentum, volatility and nearby support or resistance may help assess price behaviour after D, but none can establish the required Butterfly ratios on its own.
| Tool Type | What It Can Help Read | Careful Use |
|---|---|---|
| Fibonacci tools | Retracement and extension relationships between Butterfly legs | The tool helps measure, but the trader still chooses swing points |
| Momentum indicators | Whether pressure is fading near the PRZ | Divergence can continue for some time and needs structure confirmation |
| Oscillators | Whether price appears stretched near point D | Overbought or oversold readings are not reversal proof |
| Volatility indicators | Whether movement is expanding or contracting around the PRZ | High volatility can make execution and invalidation harder |
| Support and resistance | Whether the Butterfly PRZ aligns with a meaningful chart area | A level does not confirm the pattern by itself |
| Candlestick reactions | Short-term rejection or hesitation near point D | One candle is not the same as Butterfly confirmation |
| Tick activity | Activity around the PRZ, reaction, or retest | It is supporting context, not centralized market volume |
When momentum is part of the reading, MACD momentum context or RSI pressure readings may help organize the analysis. When movement size matters around the completion area, ATR-based volatility context can be useful. When candle reaction matters near point D, candlestick behavior around key areas can add short-term detail.
Hypothetical EUR/GBP Fibonacci Example
Hypothetical illustration, not historical EUR/GBP prices: suppose a bullish structure has X = 0.86000 and A = 0.88000. XA is 0.02000, or 200 pips. A 78.6% retracement gives B = 0.88000 − (0.786 × 0.02000) = 0.86428. Let C = 0.87348, so BC = 0.00920, and C retraces 0.00920 / 0.01572 ≈ 58.5% of AB, within the common C reference range.
| Projection | Calculation | Projected D |
|---|---|---|
| Classical 1.27 XA | 0.88000 − (1.27 × 0.02000) | 0.85460 |
| 2.0 BC extension of CD | 0.87348 − (2.0 × 0.00920) | 0.85508 |
| Confluence interval | Difference between the two projections | 0.85460–0.85508 (4.8 pips) |
An AB=CD equality would project 0.87348 − 0.01572 = 0.85776, above that interval; an alternate AB–CD relationship would need to be evaluated explicitly rather than claimed as confluence. The example therefore illustrates two reasonably close projections, not perfect agreement among every measure.
If EUR/GBP subsequently prints a qualifying low at D, the geometry can be assessed as complete. Whether a trader later requires a candle close above a chosen minor swing high, and where a stop and position size might belong, are separate decisions. Price could also continue lower despite the measured completion. This example is not a backtest, quotation or trading recommendation.
Readers can inspect EUR/GBP market information separately; the prices above are invented only to show the arithmetic.
Beginner Workflow and Common Mistakes
Use one consistent sequence instead of repeatedly revising the swing points to fit a preferred outcome.
- Identify: mark the clearest XA, AB and BC legs, and distinguish an emerging XABC candidate from a complete XABCD pattern.
- Measure: check B and C against a named Butterfly specification, then project D using XA, BC and relevant AB–CD relationships.
- Classify: reject forced pivots, unexplained mixed ratio rules and vague PRZs; record when the D criterion is actually met.
- Observe: if following a reversal strategy, define which post-D price response counts as confirmation and distinguish it from optional retests or follow-through.
- Plan separately: consider sessions, economic releases, spread and slippage; decide whether any entry, stop and position size fit the risk limit.
- Review: document whether the geometry qualified and separately whether the forecast and trade outcome succeeded.
Common errors include copying a scanner label without checking its pivots, mistaking any M/W-like outline for a Butterfly, changing the B point to force a 0.786 reading, assuming the PRZ must reverse, and treating a missing stop as evidence of an incomplete pattern. Similar outlines can instead be studied through the M-shaped resistance reaction or the W-shaped support reaction.
Butterfly Pattern: Key Distinctions
A Butterfly is a specific XABCD harmonic extension pattern: the deep B retracement and measured D completion beyond X distinguish it from other structures. State the ratio convention, measure the PRZ transparently and classify completion separately from any later reversal signal.
Deciding whether to trade involves an additional set of choices: post-D entry criteria, a stop, size, costs and acceptable risk. Neither Fibonacci geometry nor a confirmed price response guarantees the market's next move.