
What Is the W Pattern in Forex?
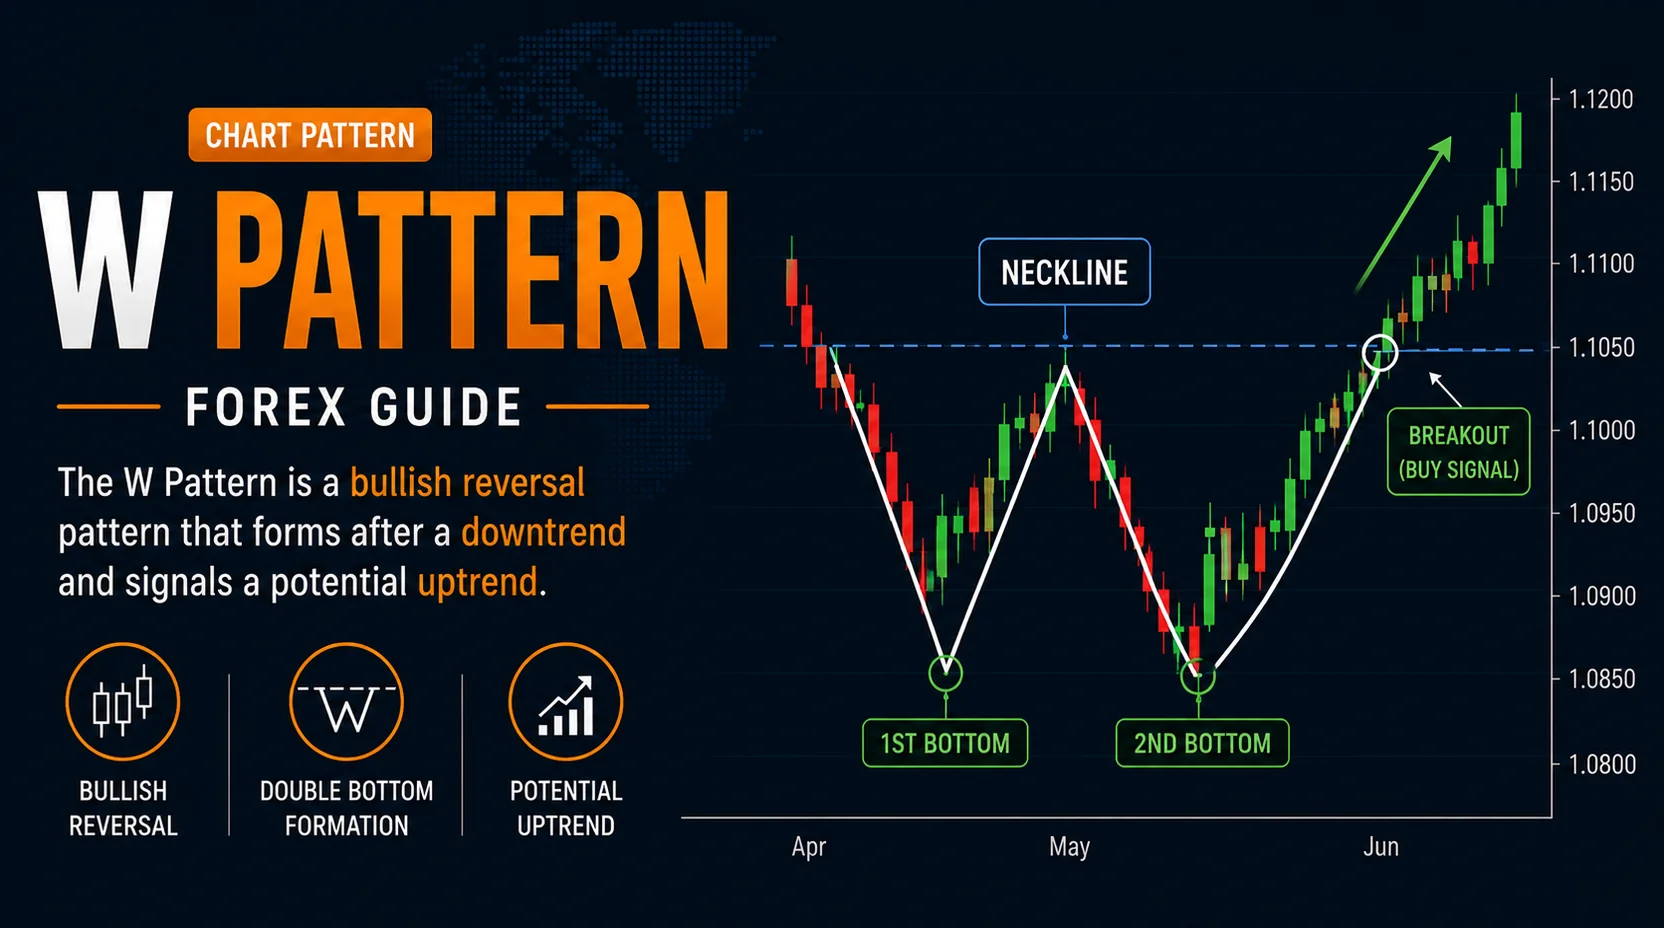
The W pattern in forex is a chart structure that may form after a downward move when price reacts twice near a similar support area. Because the structure often looks like the letter W, many traders also call it the double bottom.
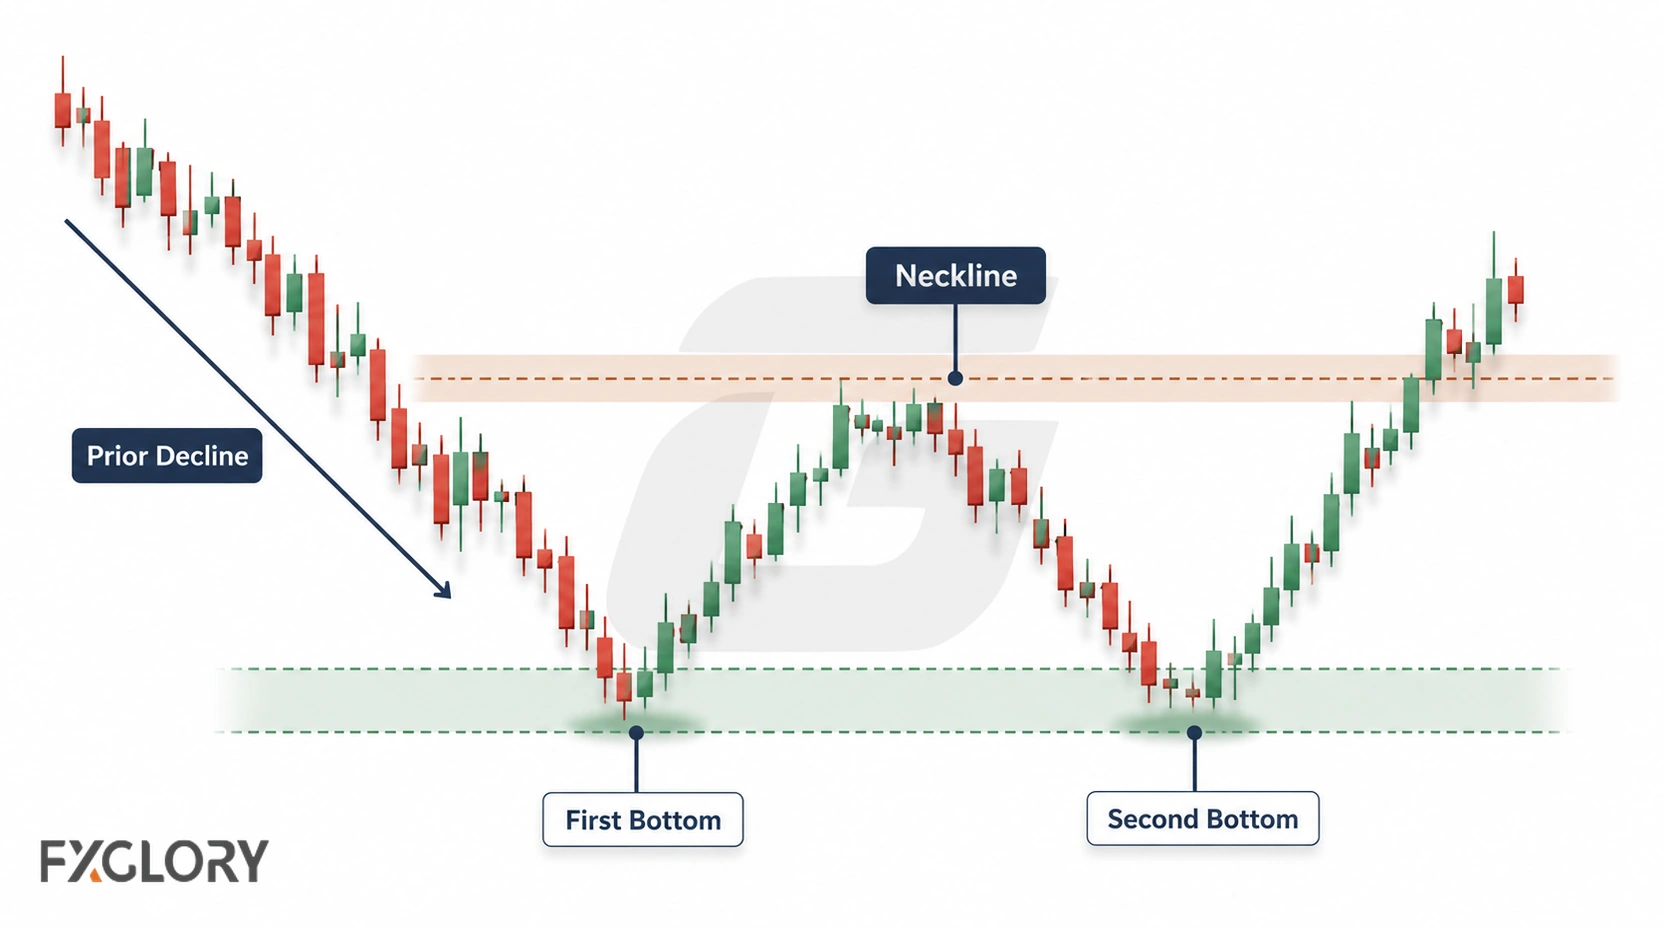
The first bottom shows price reaching a support area. The rebound creates a middle resistance area, often called the neckline. The second bottom shows price testing the lower area again. If price later breaks or holds above the neckline, traders may read the structure as a possible bullish reversal scenario.
The W pattern is not confirmed by two lows alone. Price can still break below support, keep ranging, or continue the earlier decline. For the broader reversal framework, review the trend-exhaustion guide.
How a Forex W Pattern Forms
A forex W pattern usually starts with a downward move. Price reaches a support area, rebounds, then returns toward the same lower zone. If the second attempt fails to make clean downward progress, the chart may begin to form a W-shaped structure.
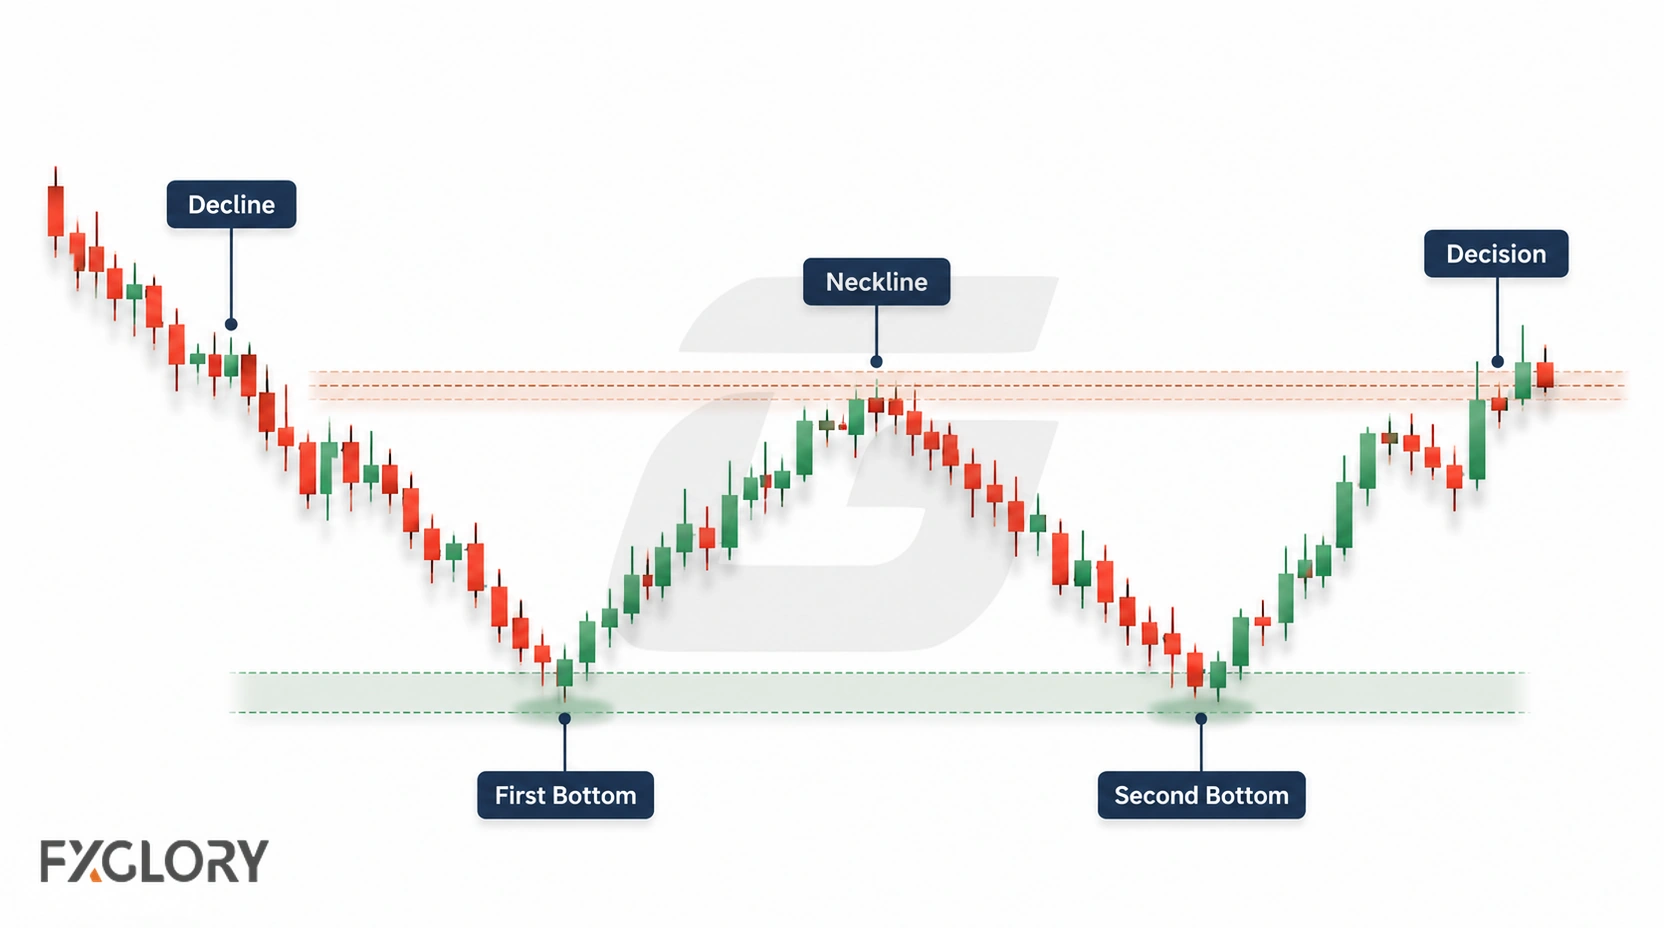
The neckline is the middle resistance area between the two lows. It matters because it shows where sellers previously stepped in after the first rebound. If price later breaks above that area and holds, the pattern becomes more developed. If the neckline rejects price, the structure may remain a range or the old downtrend may continue.
- Prior decline: Price moves downward before the pattern begins.
- First bottom: Price reacts from a support area.
- Middle rebound: Price rises into a resistance area that becomes the neckline reference.
- Second bottom: Price retests the lower area but struggles to continue lower.
- Neckline test: Price returns toward the middle resistance area.
- Confirmation attempt: Price breaks, closes, retests, or holds above the neckline area.
The two lows do not need to be perfectly equal. A small difference between lows can still fit the structure if the support area is clear and the neckline is meaningful.
W Pattern Anatomy
A W pattern becomes easier to read when its parts are clear. The cleaner the structure, the less the pattern depends on imagination.
| Part | What It Means | Why It Matters |
|---|---|---|
| Prior downward move | Price declines before the pattern appears | A reversal pattern needs something to reverse |
| First bottom | The first reaction from support | It creates the lower reference area |
| Middle resistance | The rebound between the two lows | It becomes the neckline or decision area |
| Second bottom | The second reaction near the support area | It tests whether sellers can continue lower |
| Neckline | The resistance area between the lows | It helps separate a possible pattern from a confirmed structure |
| Break or hold | Price behavior around the neckline | It gives more information than the W shape alone |
| Retest area | A broken neckline may become a reference area | It may help organize the scenario, but it is not guaranteed |
W Pattern Map
Use the quick map below to separate the main parts of the W pattern before judging confirmation.
| Stage | Visual Cue | What It Means | Risk Check |
|---|---|---|---|
| 1. Prior decline | Price falls before the structure | There is a downward move that could weaken | If the market was already sideways, the pattern may only be range behavior |
| 2. First bottom | Price reacts from support | The lower reference area appears | One reaction alone is not a W pattern |
| 3. Neckline forms | Price rebounds to middle resistance | The decision area becomes visible | If the neckline is unclear, confirmation is harder to judge |
| 4. Second bottom | Price retests the lower area | Sellers try again near support | If price breaks below and holds, the W-pattern idea weakens |
| 5. Neckline decision | Price tests the middle resistance area again | The pattern either develops or fails | A brief break can still become a false breakout |
W Pattern vs M Pattern in Forex
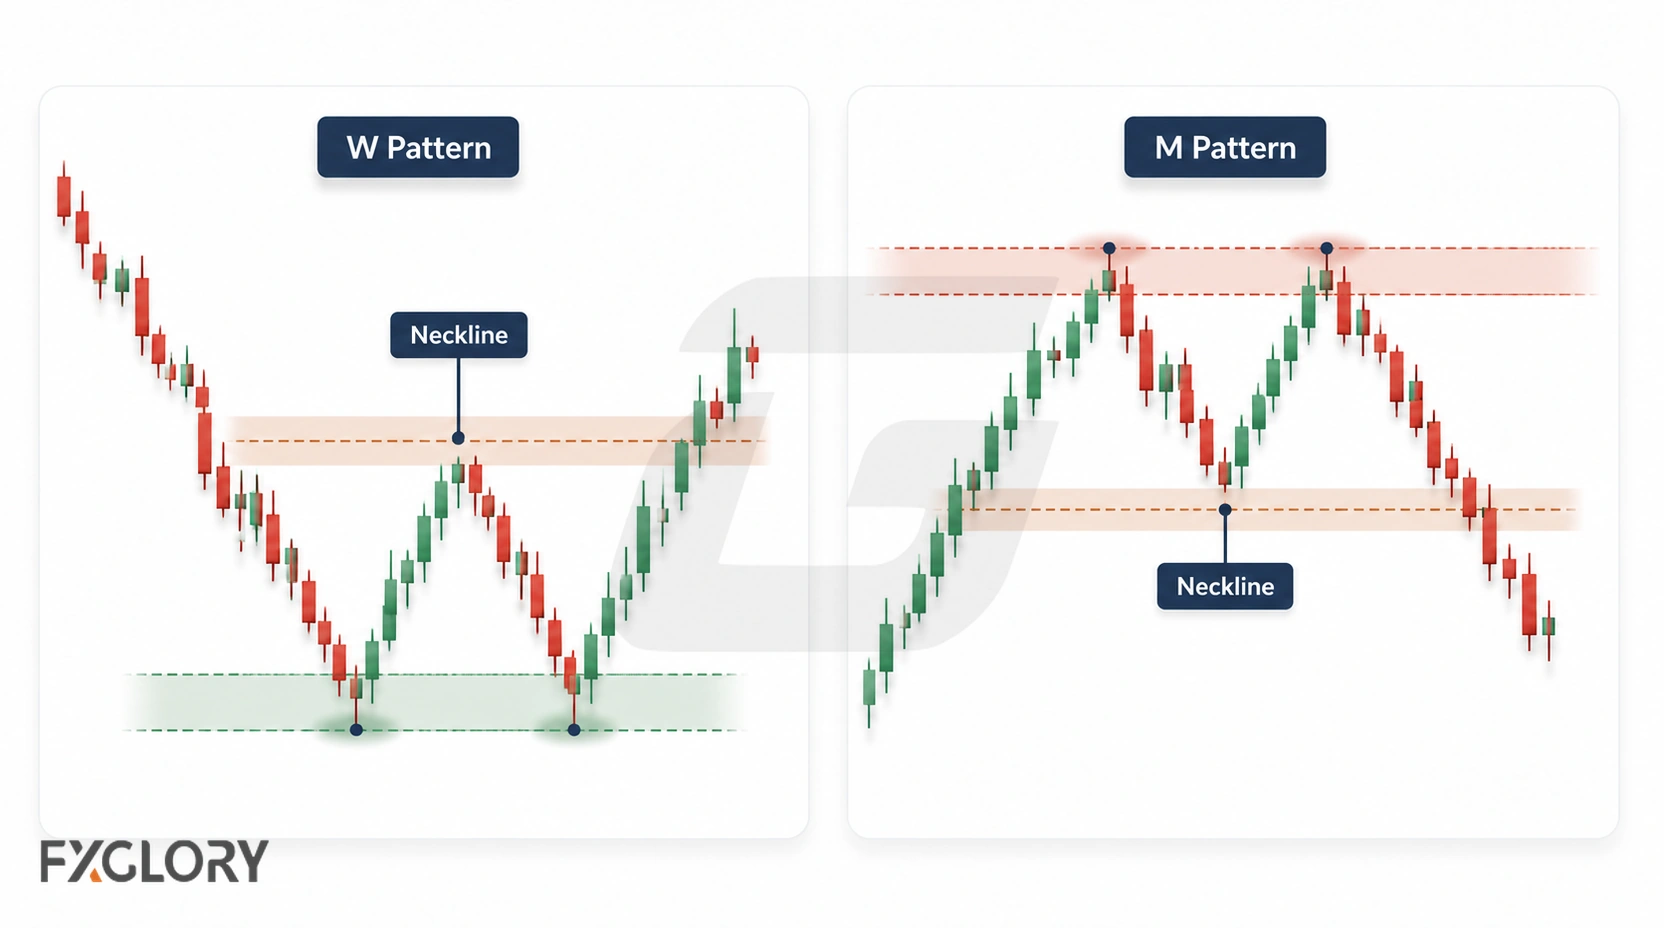
The W pattern and M pattern are mirror structures, but they should not be mixed together.
| Pattern | Usual Context | Possible Reading | Confirmation Area |
|---|---|---|---|
| W pattern / double bottom | After a downward move | Selling pressure may be weakening | Middle resistance or neckline area |
| M pattern / double top | After an upward move | Buying pressure may be weakening | Middle support or neckline area |
This page focuses on the W-shaped double bottom. When the chart shows repeated resistance after a rise instead, the M-shaped resistance reaction is the closer structure.
Strong vs Weak W Patterns
A strong W pattern is not just two lows on a chart. It has a prior downward move, a meaningful support area, a visible neckline, and a clear point where the bullish idea becomes wrong.
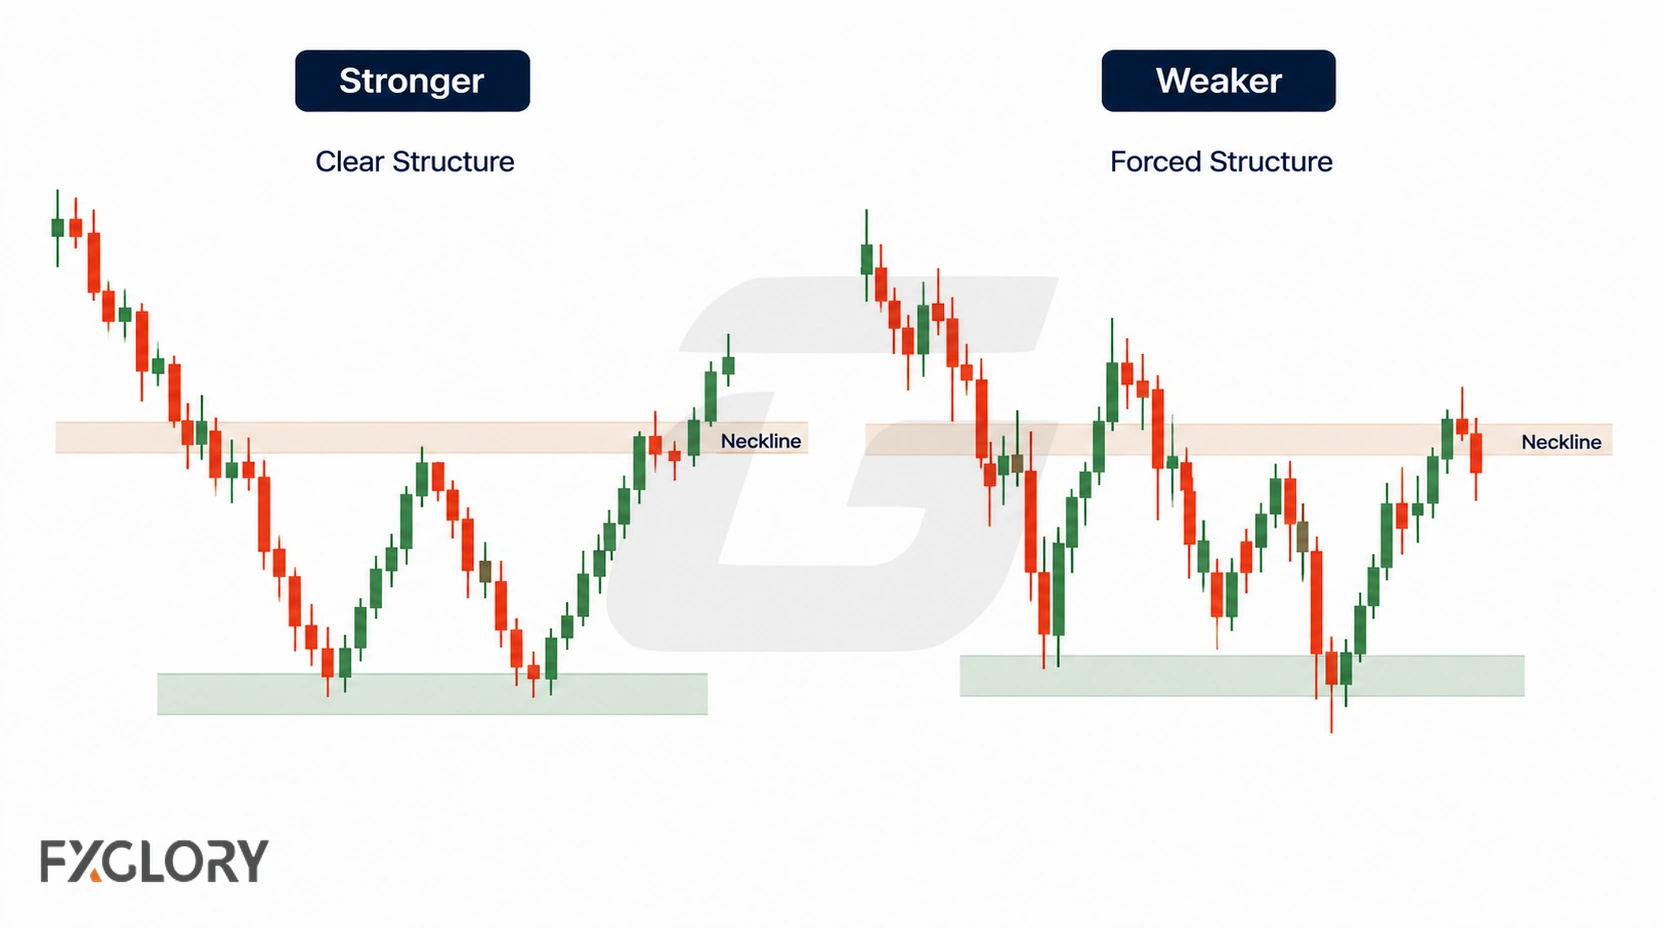
| Chart Factor | Stronger W Pattern Condition | Weaker W Pattern Condition |
|---|---|---|
| Prior move | Price clearly declines before the pattern appears | The market was already sideways or choppy |
| Support area | Both lows react near a visible lower zone | The lows are far apart or not tied to a clear area |
| Neckline | The middle resistance area is easy to identify | The neckline depends on one isolated wick or forced level |
| Second bottom behavior | Price struggles to continue below the lower area | Price holds near the low and keeps pressing downward |
| Confirmation | Price breaks, closes, retests, or holds above the neckline | The trader reacts before neckline behavior is clear |
| Timeframe alignment | The reversal idea does not fight stronger higher-timeframe structure | A small W shape appears inside a larger downtrend without support from context |
| Risk plan | Invalidation and position risk are defined before acting | The trader focuses on the expected rise but not the wrong point |
How to Confirm a Forex W Pattern
Confirmation helps separate a visible W shape from a more developed bullish reversal scenario. It does not prove that price will keep rising, but it gives more information than the two lows alone.
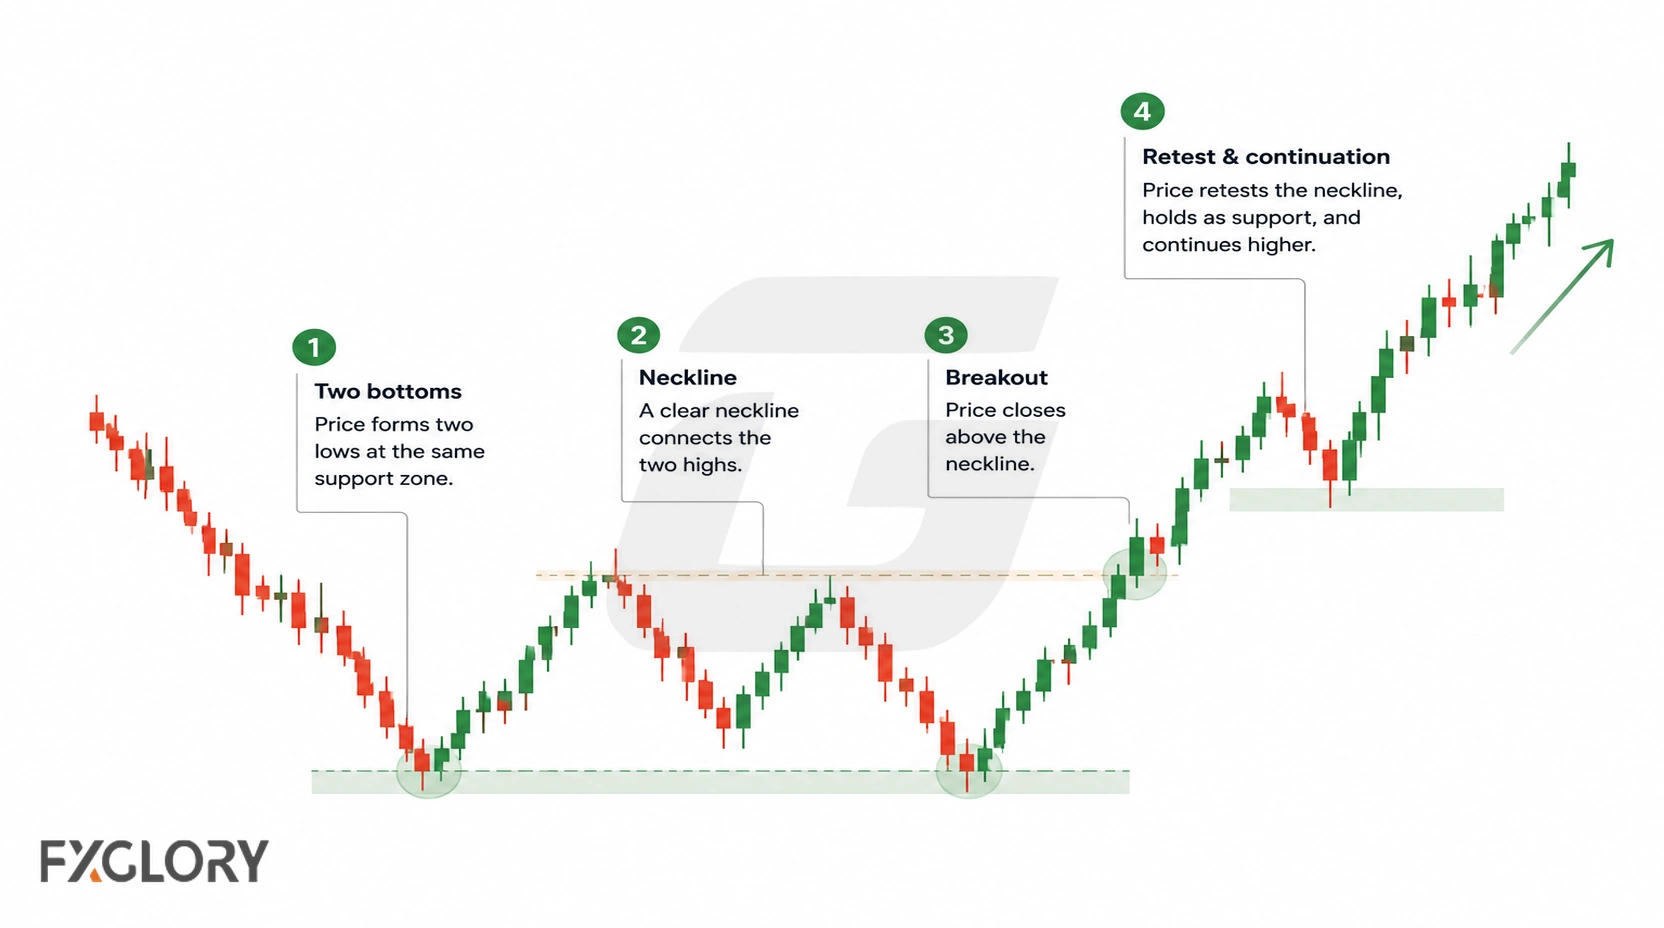
- Start with the prior move: Was price clearly falling before the structure?
- Mark the support area: Are both lows reacting near a similar lower zone?
- Find the neckline: Is the middle resistance area visible without forcing it?
- Watch the second bottom: Does price struggle near support or break below and hold?
- Watch the neckline test: Does price return to the middle resistance area?
- Check the break: Does price move above the neckline?
- Check the close or hold: Does price stay above the area or snap back below it?
- Watch the retest: If price returns to the broken neckline, does the area still matter?
- Define invalidation: Decide what price behavior cancels the W-pattern idea.
After a neckline break, the broken resistance area may become a reference area during a retest, but this is not guaranteed. A W pattern becomes more useful when the trader can explain the prior decline, support area, neckline, confirmation behavior, invalidation, and risk without forcing the chart.
Invalidation: When the W Pattern Idea Fails
Invalidation is the condition that shows the W pattern idea is no longer useful. It should be defined before the trader focuses on any possible target or bullish scenario.
- No neckline break: Price reacts from the second bottom but the middle resistance area holds.
- False neckline break: Price breaks above the neckline, then returns below it and holds.
- Support breakdown: Price breaks below the bottom area and holds there.
- Range behavior: Price keeps rotating between the support and neckline areas without a clear decision.
- Higher-timeframe conflict: The bullish scenario forms against a stronger resistance, trend, or broader structure.
- News-driven shift: A high-impact event changes volatility and overwhelms the pattern.
- No clear wrong point: The trader cannot explain where the W pattern idea becomes invalid.
Some W pattern methods use the distance between the support area and neckline to estimate possible target zones. This can help organize a scenario, but target planning should come after invalidation, not before it. Price may move only part of the way, retest the neckline, range, reverse again, or fail immediately.
False W Patterns in Forex
A false W pattern happens when the chart looks like a double bottom, but price does not confirm a bullish reversal or quickly invalidates the idea. Two lows near the same area are only a warning sign, not a completed pattern.
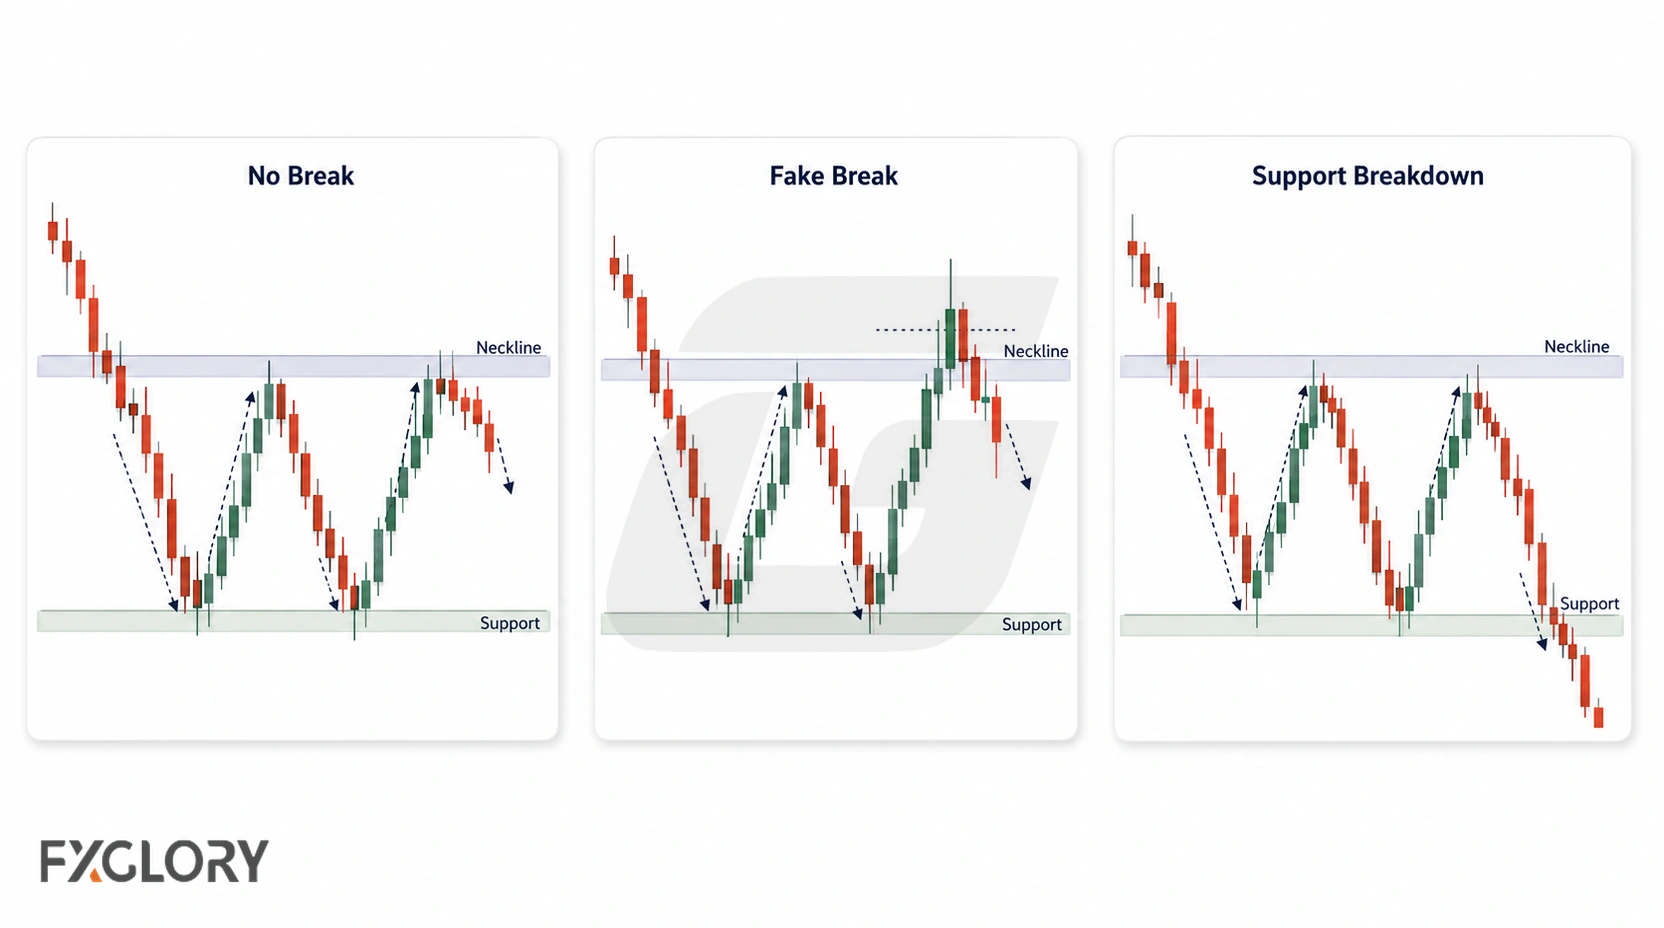
If price keeps testing the same support area more than twice, the structure may become a broader range or a triple-bottom-style structure instead of a clean W pattern.
| False Signal | What It Looks Like | Careful Reading |
|---|---|---|
| Early W label | Price reacts twice near support but never breaks the neckline | The structure may still be a range |
| Fake neckline break | Price pushes above resistance briefly, then returns below it | The break may be a liquidity sweep or false move |
| Continuation below support | Price breaks below the two lows and holds | The bullish reversal idea weakens or fails |
| Weak prior trend | The pattern appears after choppy movement, not a clear decline | The chart may not have enough reversal context |
| News distortion | A fast event-driven move breaks levels suddenly | Wait for structure to rebuild before judging the pattern |
W Pattern vs Range
A W pattern and a range can both show repeated reactions near support. The difference is that a W pattern needs prior downward context and a meaningful neckline decision, while a range can keep rotating between support and resistance without confirming a reversal.
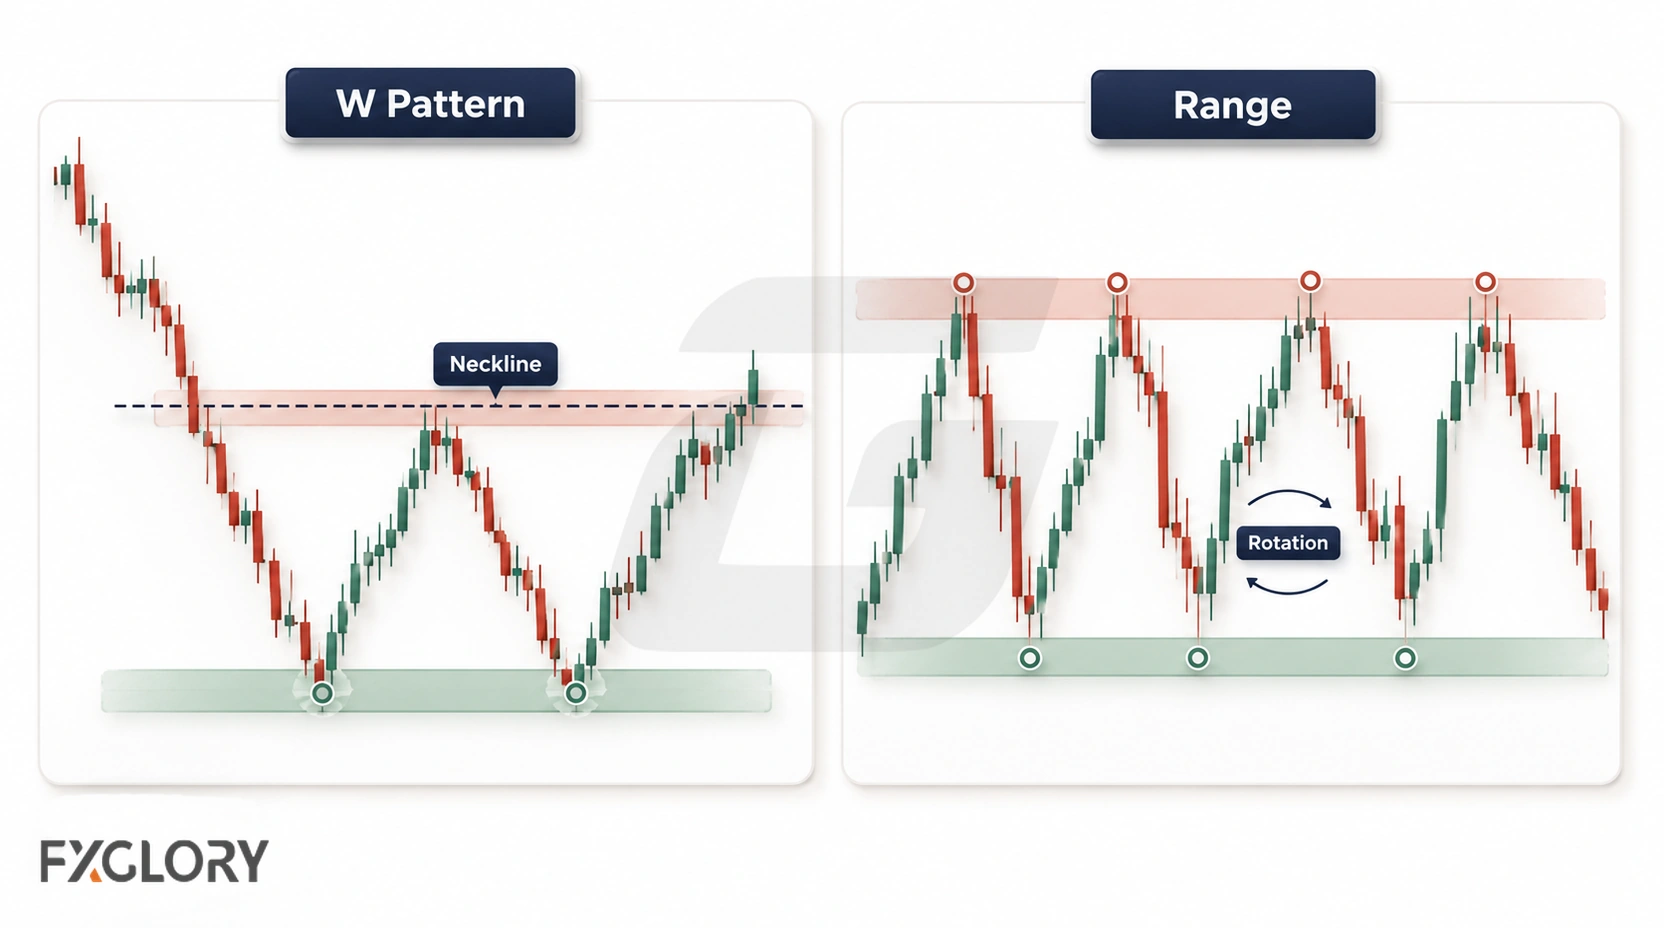
| Question | W Pattern Clue | Range Clue |
|---|---|---|
| What came before? | A clear downward move appears before the two lows | Price was already moving sideways or choppy |
| What does support show? | Repeated support may show selling pressure weakening | Support is simply the lower side of the range |
| What does the neckline do? | Price breaks, closes, retests, or holds above the middle resistance area | Price keeps rejecting from the upper side of the range |
| What weakens the reversal idea? | Price loses the neckline or breaks below support | Price continues rotating between support and resistance |
| Better reading | Possible bullish reversal scenario after confirmation | Sideways structure until one side clearly fails |
Forex Context: Sessions, News, Spread, Slippage, and Volume
Forex W patterns should be read with market conditions because currency pairs trade across global sessions. A support reaction that looks clean during quiet movement may behave differently during a session overlap, economic release, or fast volatility shift.
- Session behavior: Neckline breaks during active sessions may behave differently from moves during thin liquidity.
- News events: Economic releases and central-bank comments can overpower a technical structure quickly.
- Spread and slippage: Fast movement around the neckline, retest, or support area can affect execution and risk.
- Pair behavior: Different currency pairs may react differently around repeated support and resistance areas.
- Timeframes: A lower-timeframe W pattern can conflict with a stronger higher-timeframe trend or resistance area.
- Volume limits: Spot forex does not have one centralized exchange volume figure, so volume-style readings need careful interpretation.
Some traders watch whether tick activity changes near the second bottom or around the neckline break, but this remains supporting context. When volume-style context matters, tick-volume reading in forex should stay secondary to structure, confirmation, and risk.
Using Indicators and Candles With W Patterns
Indicators and candlestick reactions can support W-pattern analysis, but they should not replace price structure. The pattern still needs a prior decline, support reaction, neckline behavior, confirmation, and invalidation.
| Tool Type | What It Can Help Read | Careful Use |
|---|---|---|
| Momentum indicators | Whether downward pressure is fading near the second bottom | Divergence can continue for some time and needs structure confirmation |
| Trend-strength indicators | Whether the old downward move is weakening or still strong | They may lag after price has already moved |
| Oscillators | Whether price appears stretched near the lower area | RSI or Stochastic readings can support context, but oversold conditions are not reversal proof |
| Volatility indicators | Whether movement expands around the neckline or retest | High volatility can increase execution risk |
| Bollinger Bands context | Whether price is reacting near an outer band or returning toward a middle area | Band reactions need structure and confirmation; they are not reversal proof |
| Candlestick reactions | Short-term rejection or hesitation near support or neckline areas | One candle is not the same as a full W pattern structure |
| Tick activity | Activity around the second bottom, neckline break, or retest | It is supporting context, not centralized market volume |
When momentum is part of the W-pattern reading, MACD momentum context or RSI pressure readings may help organize the analysis. When oscillator context matters near the second bottom, Stochastic context may add another supporting view. When price reacts near a band area, Bollinger Bands context should still be checked against the W structure, neckline behavior, and invalidation. When trend strength matters, ADX trend-strength context can be useful. When candle reaction matters near support, candlestick behavior around key areas can add short-term detail.
Example: Reading a W Pattern on EUR/CHF
Suppose EUR/CHF has been moving downward, then price reacts from a support area, rebounds, and later returns toward the same lower zone. A trader may first describe the market as a prior decline followed by repeated support, without assuming the pattern is confirmed.
If price breaks above the middle resistance area and holds, that may create a bullish reversal scenario. If price breaks below the support area and holds, the W-pattern idea weakens. If price stays between support and the middle resistance area, the structure may remain a range rather than a completed W pattern.
The useful questions are simple: Was there a clear prior decline? Are the two lows reacting near a meaningful area? Is the neckline visible? Does price confirm above it? Where is the W-pattern idea wrong?
Common Mistakes With Forex W Patterns
W-pattern mistakes often happen when traders see two lows and assume the market must reverse.
- Entering before neckline confirmation: The trader reacts to the second bottom before the structure has developed.
- Expecting perfect symmetry: The two lows do not need to be identical, but the support area should be explainable.
- Ignoring the prior trend: The trader labels a sideways range as a reversal pattern.
- Forcing the neckline: The middle resistance area is drawn from one weak wick or adjusted too much.
- Ignoring false breaks: Price breaks the neckline briefly, then returns below it.
- Missing higher-timeframe context: A small W pattern fights a larger trend or resistance area.
- Overusing volume assumptions: Volume-style clues are treated as if spot forex had one centralized exchange volume figure.
- No invalidation: The trader knows the expected upside scenario but not the point where the idea is wrong.
Beginner Workflow for the W Pattern
A clear process helps keep the W pattern from becoming guesswork.
- Start with the prior decline: Check whether price was clearly moving downward before the structure.
- Mark the support area: Identify the zone where the first bottom and second bottom react.
- Find the neckline: Mark the middle resistance area between the two lows.
- Check the second bottom: Decide whether price is truly struggling near support or simply pausing.
- Wait for evidence: Look for neckline break, close, retest, hold, or supporting context.
- Define invalidation: Mark where the W-pattern idea becomes wrong.
- Check forex conditions: Consider session, news, spread, slippage, volatility, and pair behavior.
- Review the outcome: Whether the idea works or fails, check if the W-pattern reading was actually clear.
This process keeps the focus on structure, confirmation, invalidation, and risk instead of treating the W pattern as an automatic bullish signal.
A Safer Way to Read the Forex W Pattern
The W pattern helps traders organize a possible bullish reversal after a downward move. It is often called the double bottom because of its two lower reactions and middle neckline area.
The strongest W-pattern ideas begin with a clear prior decline, two reactions near a meaningful support area, a visible neckline, confirmation behavior, and a defined invalidation point. If these parts are missing, the pattern may not be ready for a trading decision.
W-pattern analysis becomes more useful when it is read with context. Session behavior, news, spread, slippage, volatility, timeframe alignment, pair behavior, position size, and account risk still matter.