
What Is the Head and Shoulders Pattern in Forex?
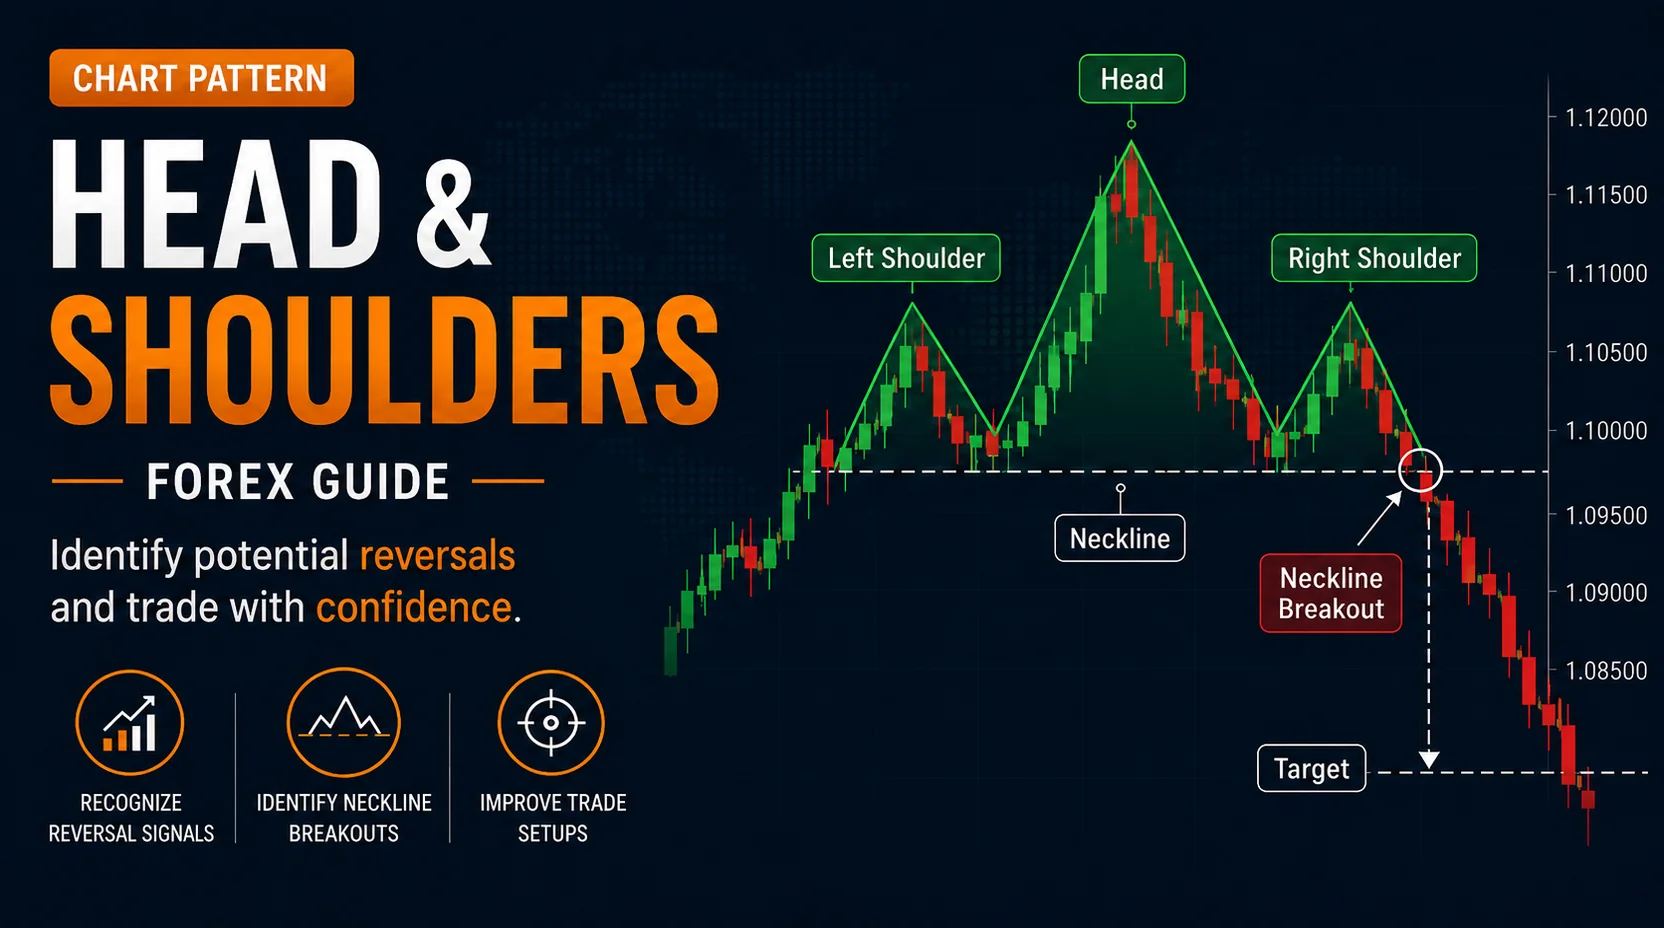
The head and shoulders pattern in forex is a chart structure made of three main swing points: a left shoulder, a head, and a right shoulder. In the standard version, the head is higher than the two shoulders, and the neckline connects the pullback areas between them.
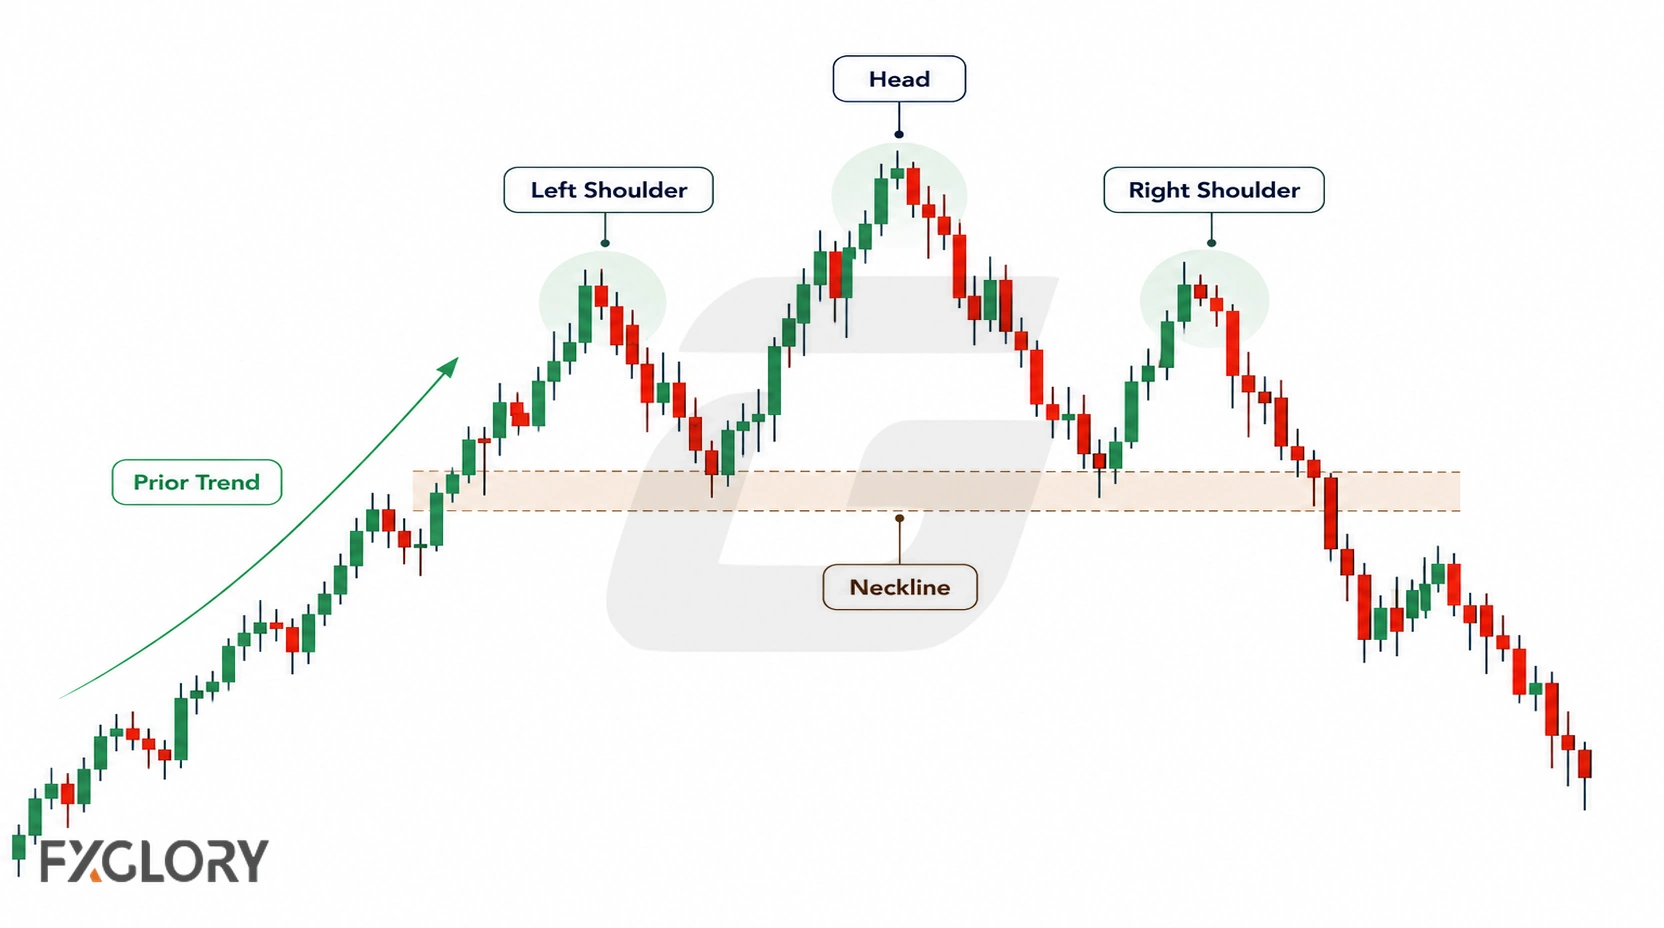
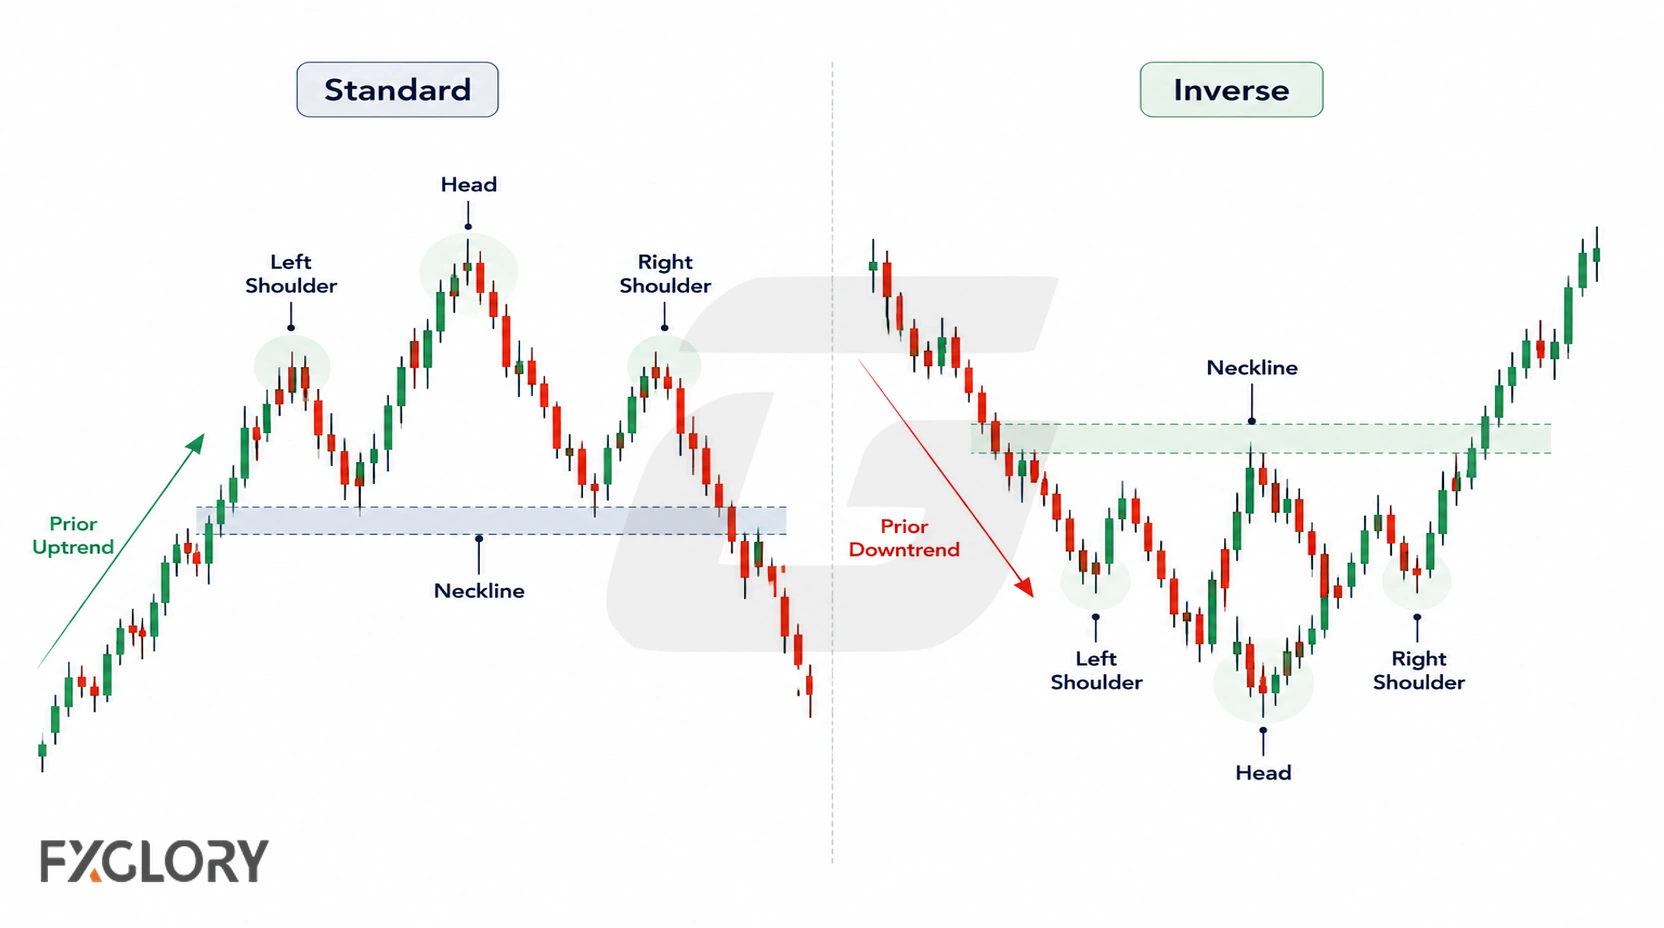
The standard head and shoulders pattern usually appears after an upward move and is studied as a possible bearish reversal scenario. The inverse head and shoulders pattern usually appears after a downward move and is studied as a possible bullish reversal scenario.
The pattern is not confirmed by three swing points alone. The neckline matters because it shows whether the market has actually changed structure or whether price is only moving inside a noisy range. For the broader reversal framework, review the trend-exhaustion guide.
How a Forex Head and Shoulders Pattern Forms
A standard head and shoulders pattern usually starts with an upward move. Price forms a first peak, pulls back, then makes a higher peak. After another pullback, price tries to rise again but fails to reach the head area. That lower final peak becomes the right shoulder.
The neckline is drawn through the pullback areas between the left shoulder, head, and right shoulder. If price later breaks below the neckline and holds, traders may read the structure as a possible bearish reversal scenario. If the neckline holds or price breaks above the right shoulder area, the idea may weaken or fail.
- Prior trend: Price moves upward before the standard pattern or downward before the inverse version.
- Left shoulder: The first swing creates an early reference point.
- Head: Price pushes beyond the shoulder area and forms the largest swing.
- Right shoulder: Price tries again but fails to match the head.
- Neckline: The swing lows in the standard pattern, or swing highs in the inverse version, create the decision area.
- Confirmation attempt: Price breaks, closes, retests, or holds beyond the neckline.
The shoulders do not need to be perfectly equal. A small difference can still fit the structure if the pattern is clear, the neckline is meaningful, and the chart does not need forced drawing.
Head and Shoulders Pattern Anatomy
A head and shoulders pattern becomes easier to read when each part is visible. The cleaner the structure, the less the pattern depends on imagination.
| Part | What It Means | Why It Matters |
|---|---|---|
| Prior trend | The move that comes before the pattern | A reversal pattern needs something to reverse |
| Left shoulder | The first major swing point | It begins the structure and creates an early reference area |
| Head | The middle swing that extends beyond the shoulders | It shows the strongest push before the structure weakens |
| Right shoulder | The final swing that fails to match the head | It may show weakening pressure in the prior trend direction |
| Neckline | The decision line connecting the relevant pullback areas | It helps separate a possible pattern from a more developed structure |
| Break or hold | Price behavior around the neckline | It gives more information than the shape alone |
| Retest area | A broken neckline may become a reference area | It may help organize the scenario, but it is not guaranteed |
Head and Shoulders Visual Map
Use the quick map below to separate the main parts of the pattern before judging confirmation.
| Stage | Visual Cue | What It Means | Risk Check |
|---|---|---|---|
| 1. Prior trend | Price moves clearly before the pattern | There is a trend that could weaken | If price was already sideways, the pattern may only be range behavior |
| 2. Left shoulder | First swing point forms | The early reference area appears | One swing alone is not a pattern |
| 3. Head | Middle swing extends beyond the shoulder | The strongest push appears | If price keeps making clean progress, reversal evidence is weak |
| 4. Right shoulder | Final swing fails to match the head | Prior trend pressure may be weakening | If price breaks beyond the head area, the pattern weakens |
| 5. Neckline decision | Price tests the neckline | The pattern either develops or fails | A brief break can still become a false breakout |
Standard vs Inverse Head and Shoulders
The standard and inverse versions use the same logic, but they appear in opposite market contexts.
| Pattern | Usual Context | Possible Reading | Neckline Decision |
|---|---|---|---|
| Standard head and shoulders | After an upward move | Buying pressure may be weakening | Price breaks, closes, retests, or holds below the neckline |
| Inverse head and shoulders | After a downward move | Selling pressure may be weakening | Price breaks, closes, retests, or holds above the neckline |
The standard version should not be treated as automatically bearish, and the inverse version should not be treated as automatically bullish. Both need context, neckline behavior, invalidation, and risk control.
For the inverse version, flip the structure: prior decline, left shoulder, lower head, right shoulder, and a neckline decision above the pattern rather than below it.
Neckline Types in Forex
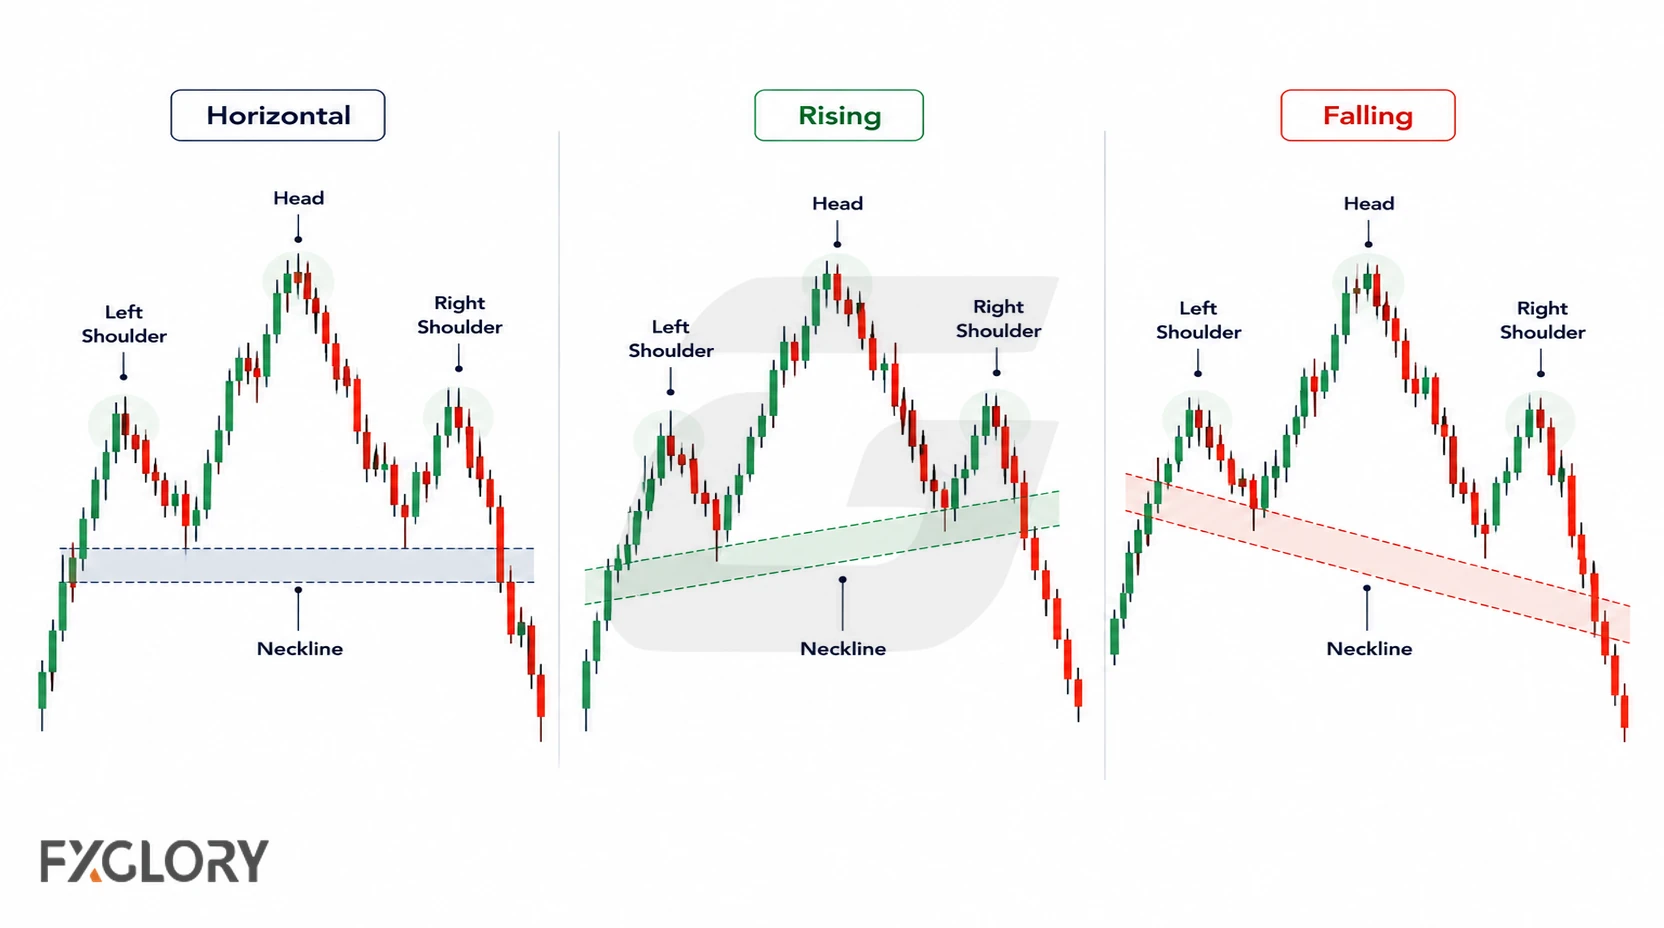
The neckline is the decision area of the head and shoulders pattern. It can be horizontal, rising, or falling. A sloped neckline can still be useful if it connects the relevant swing areas clearly and is not forced.
| Neckline Type | What It Looks Like | Careful Reading |
|---|---|---|
| Horizontal neckline | The pullback areas sit near a similar level | Often easier to read, but still needs confirmation |
| Rising neckline | The neckline slopes upward | May show that the old trend still has some pressure; confirmation matters |
| Falling neckline | The neckline slopes downward | May break earlier or look more aggressive; false breaks still matter |
| Unclear neckline | The line depends on forced points or one isolated wick | The pattern may not be clear enough to use |
A neckline should be treated as an area rather than an exact line. In forex, spread, volatility, and fast movement can make exact-line interpretation unreliable.
Strong vs Weak Head and Shoulders Patterns
A strong head and shoulders pattern is not just three peaks or three troughs. It has a prior trend, a clear head, explainable shoulders, a useful neckline, and a defined point where the idea becomes wrong.
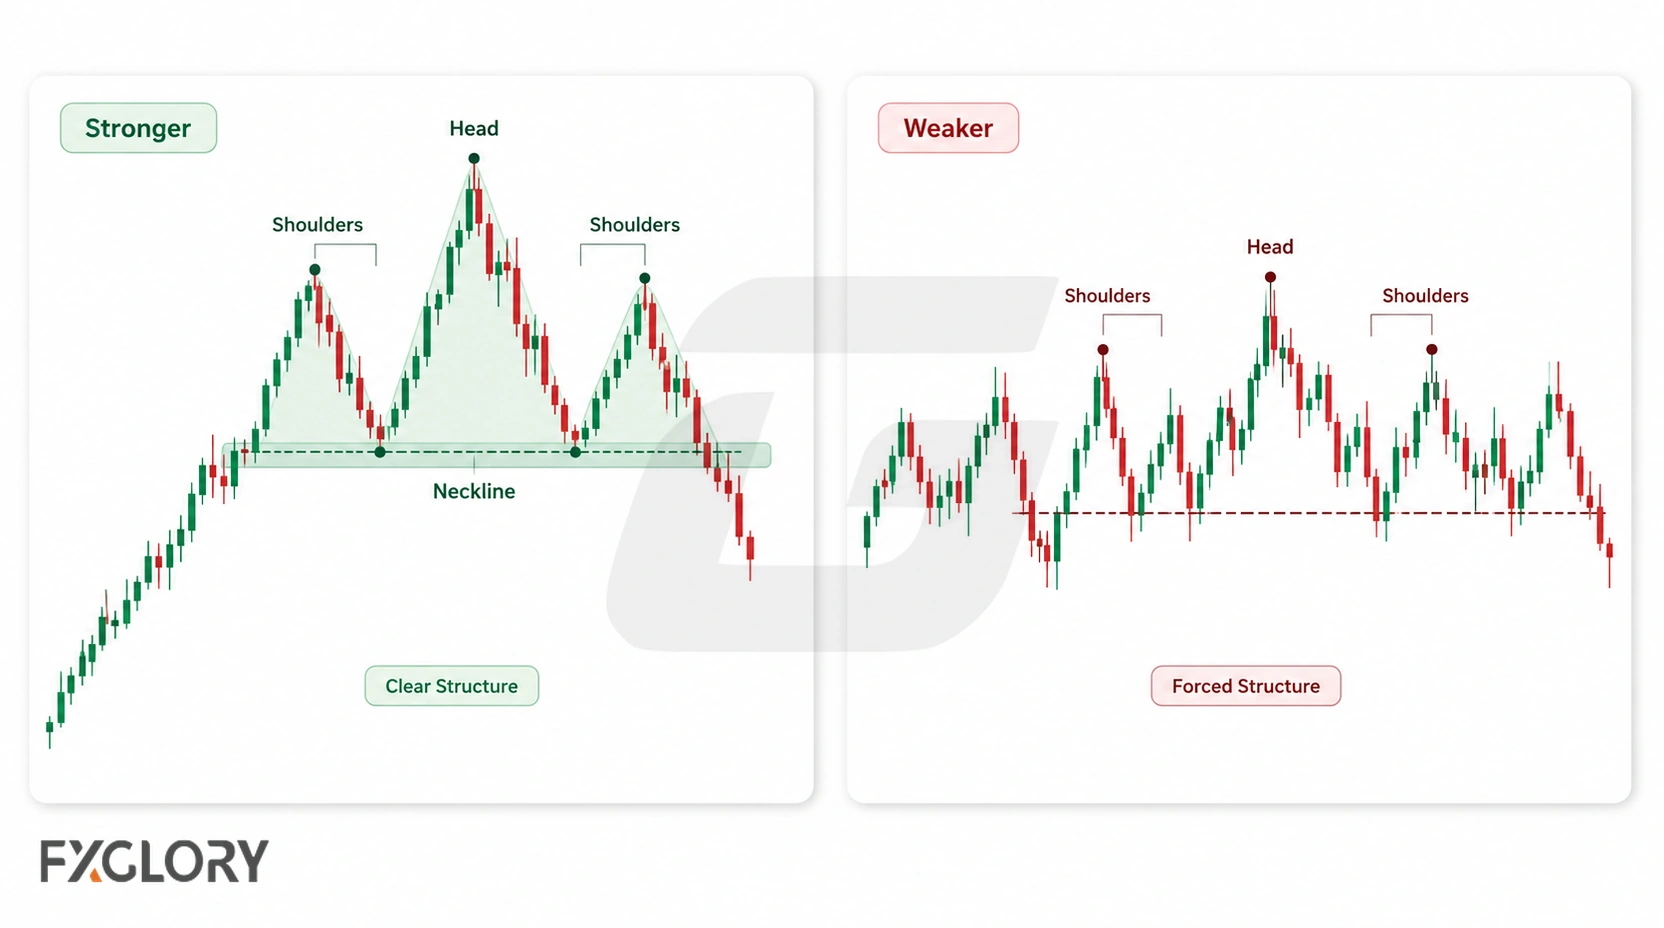
| Chart Factor | Stronger Condition | Weaker Condition |
|---|---|---|
| Prior trend | Price clearly trends before the pattern appears | The market was already sideways or choppy |
| Head | The middle swing clearly extends beyond both shoulders | The head is barely different from the shoulders |
| Shoulders | The left and right shoulders are explainable without needing perfect symmetry | The shoulders are forced from random swings |
| Neckline | The decision area connects meaningful pullback points | The neckline depends on one wick or repeated adjustment |
| Right shoulder behavior | Price struggles to continue in the old trend direction | Price keeps pressing toward the head area with strong pressure |
| Confirmation | Price breaks, closes, retests, or holds beyond the neckline | The trader reacts before neckline behavior is clear |
| Timeframe alignment | The reversal idea does not fight stronger higher-timeframe structure | A small pattern appears against a stronger larger trend |
| Risk plan | Invalidation and position risk are defined before acting | The trader focuses on the expected reversal but not the wrong point |
How to Confirm a Forex Head and Shoulders Pattern
Confirmation helps separate a visible head and shoulders shape from a more developed reversal scenario. It does not prove that price will continue after the break, but it gives more information than the shape alone.
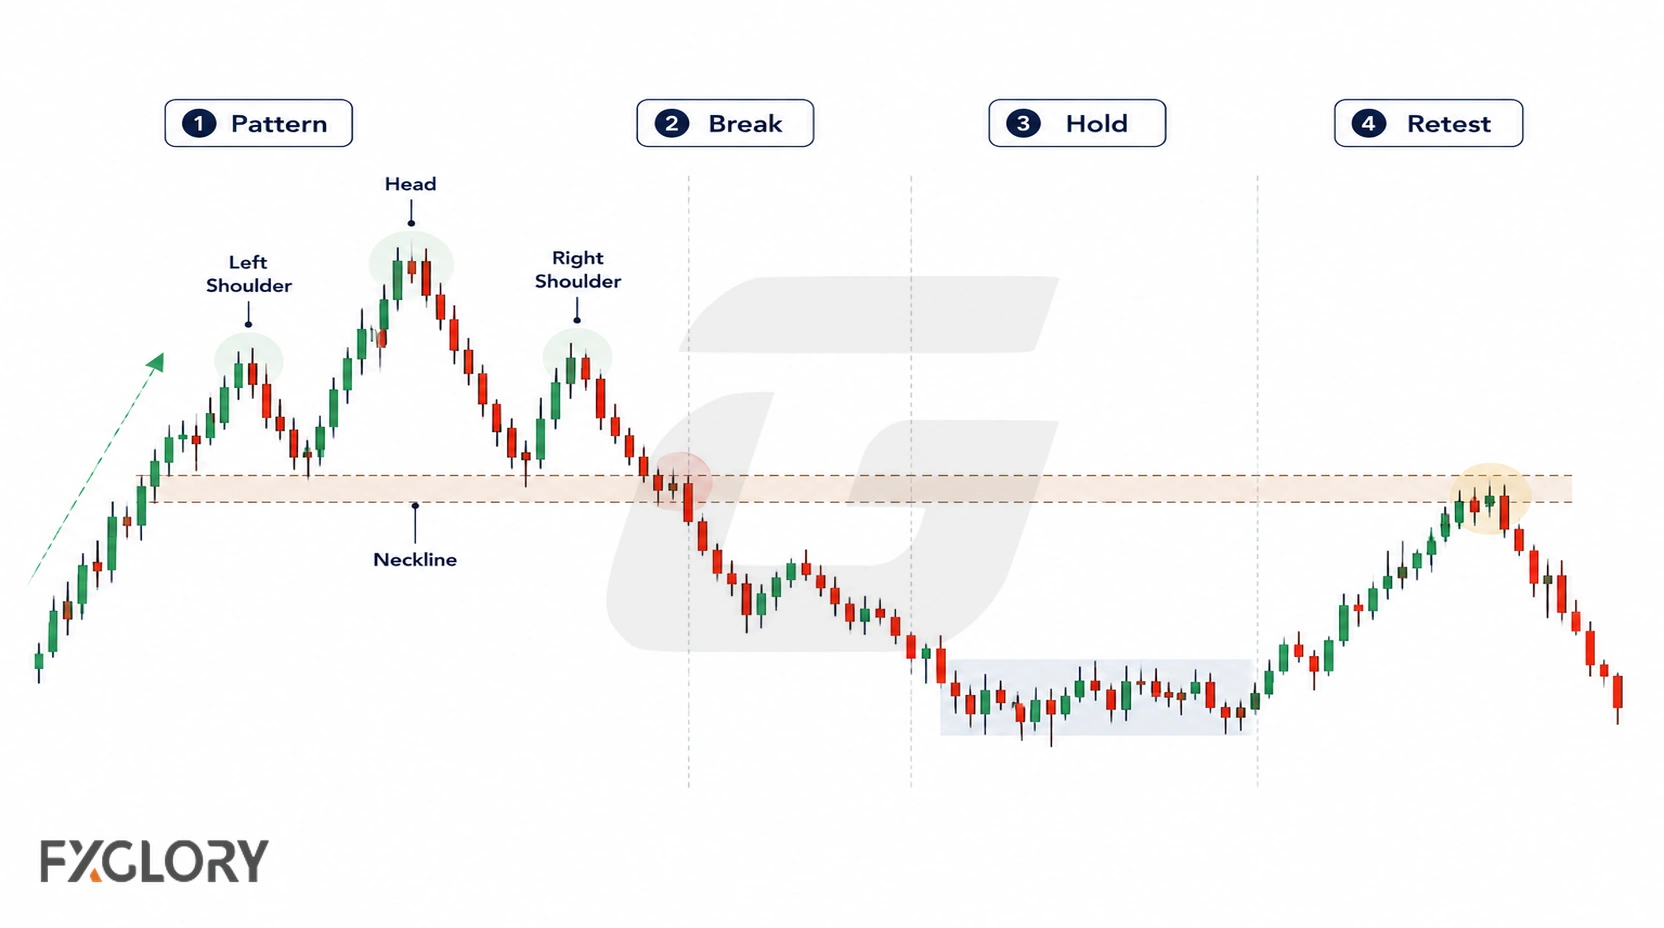
- Start with the prior trend: Was price clearly rising before the standard pattern or falling before the inverse version?
- Identify the left shoulder: Is there a visible first swing point?
- Check the head: Does the middle swing clearly extend beyond the shoulders?
- Watch the right shoulder: Does price fail to match the head area?
- Mark the neckline: Can the decision area be explained without forcing the line?
- Check the break: Does price move beyond the neckline?
- Check the close or hold: Does price remain beyond the area or snap back inside?
- Watch the retest: If price returns to the broken neckline, does the area still matter?
- Define invalidation: Decide what price behavior cancels the pattern idea.
After a neckline break, the broken neckline may become a reference area during a retest, but this is not guaranteed. A head and shoulders pattern becomes more useful when the trader can explain the prior trend, shoulder structure, head, neckline, confirmation behavior, invalidation, and risk without forcing the chart.
Invalidation: When the Pattern Idea Fails
Invalidation is the condition that shows the head and shoulders idea is no longer useful. It should be defined before the trader focuses on any possible target or reversal scenario.
- No neckline break: Price forms a possible right shoulder, but the neckline holds.
- False neckline break: Price breaks the neckline, then returns inside the structure and holds there.
- Right shoulder failure: In a standard pattern, price breaks above the right shoulder area and holds. In an inverse pattern, price breaks below the right shoulder area and holds.
- Head-area break: Price moves beyond the head area in the old trend direction and weakens the reversal idea.
- Range behavior: Price keeps rotating around the neckline and shoulder areas without a clear decision.
- Higher-timeframe conflict: The reversal scenario forms against a stronger support, resistance, trend, or broader structure.
- News-driven shift: A high-impact event changes volatility and overwhelms the pattern.
- No clear wrong point: The trader cannot explain where the pattern idea becomes invalid.
Some head and shoulders methods use the distance between the head and the neckline to estimate possible target zones. This can help organize a scenario, but target planning should come after invalidation, not before it. Price may move only part of the way, retest the neckline, range, reverse again, or fail immediately.
False Head and Shoulders Patterns
A false head and shoulders pattern happens when the chart looks like the structure, but price does not confirm a reversal or quickly invalidates the idea. Three swing points are only a warning sign, not a completed reversal pattern.
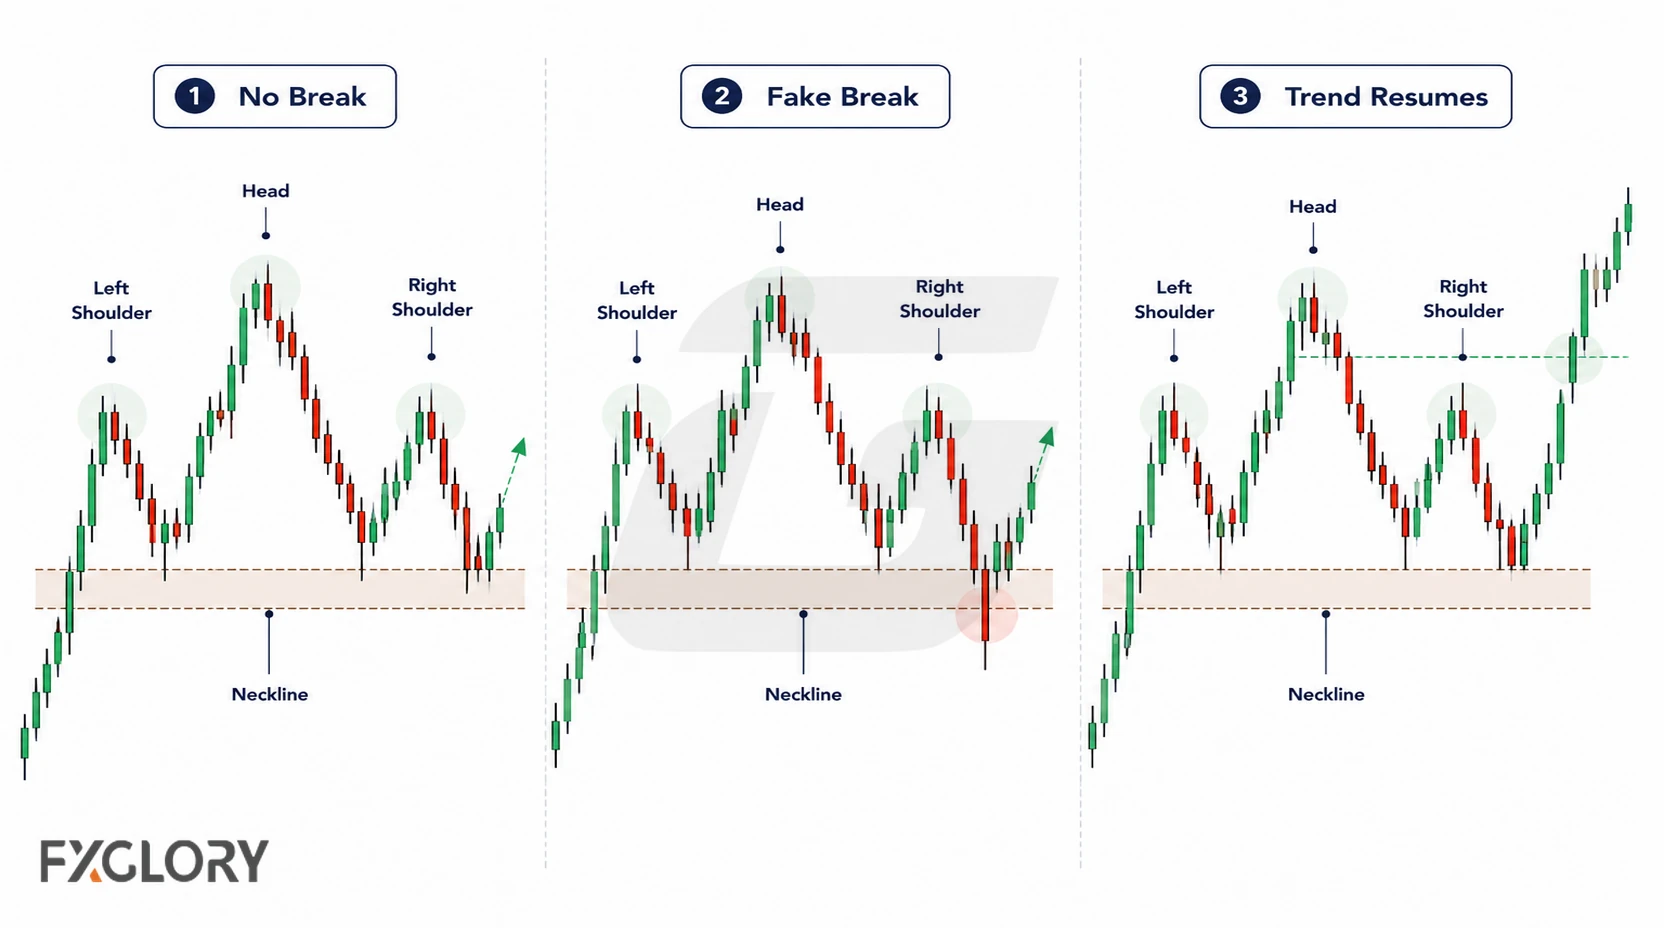
| False Signal | What It Looks Like | Careful Reading |
|---|---|---|
| Early label | Left shoulder, head, and right shoulder appear, but the neckline never breaks | The structure may still be a range or complex pullback |
| Fake neckline break | Price moves beyond the neckline briefly, then returns inside | The break may be a false move or liquidity sweep |
| Old trend resumes | Price breaks beyond the right shoulder or head area in the prior trend direction | The reversal idea weakens or fails |
| Unclear neckline | The neckline depends on forced points or one extreme wick | Confirmation becomes unreliable |
| Weak prior trend | The pattern appears after choppy movement, not a clear trend | The chart may not have enough reversal context |
| News distortion | A fast event-driven move breaks levels suddenly | Wait for structure to rebuild before judging the pattern |
Head and Shoulders vs Range or Complex Pullback
A head and shoulders pattern, a range, and a complex pullback can all include several swing points. The difference is that head and shoulders needs a clear prior trend, an explainable shoulder-head-shoulder structure, and a meaningful neckline decision. Without those pieces, the chart may only be rotating or correcting.
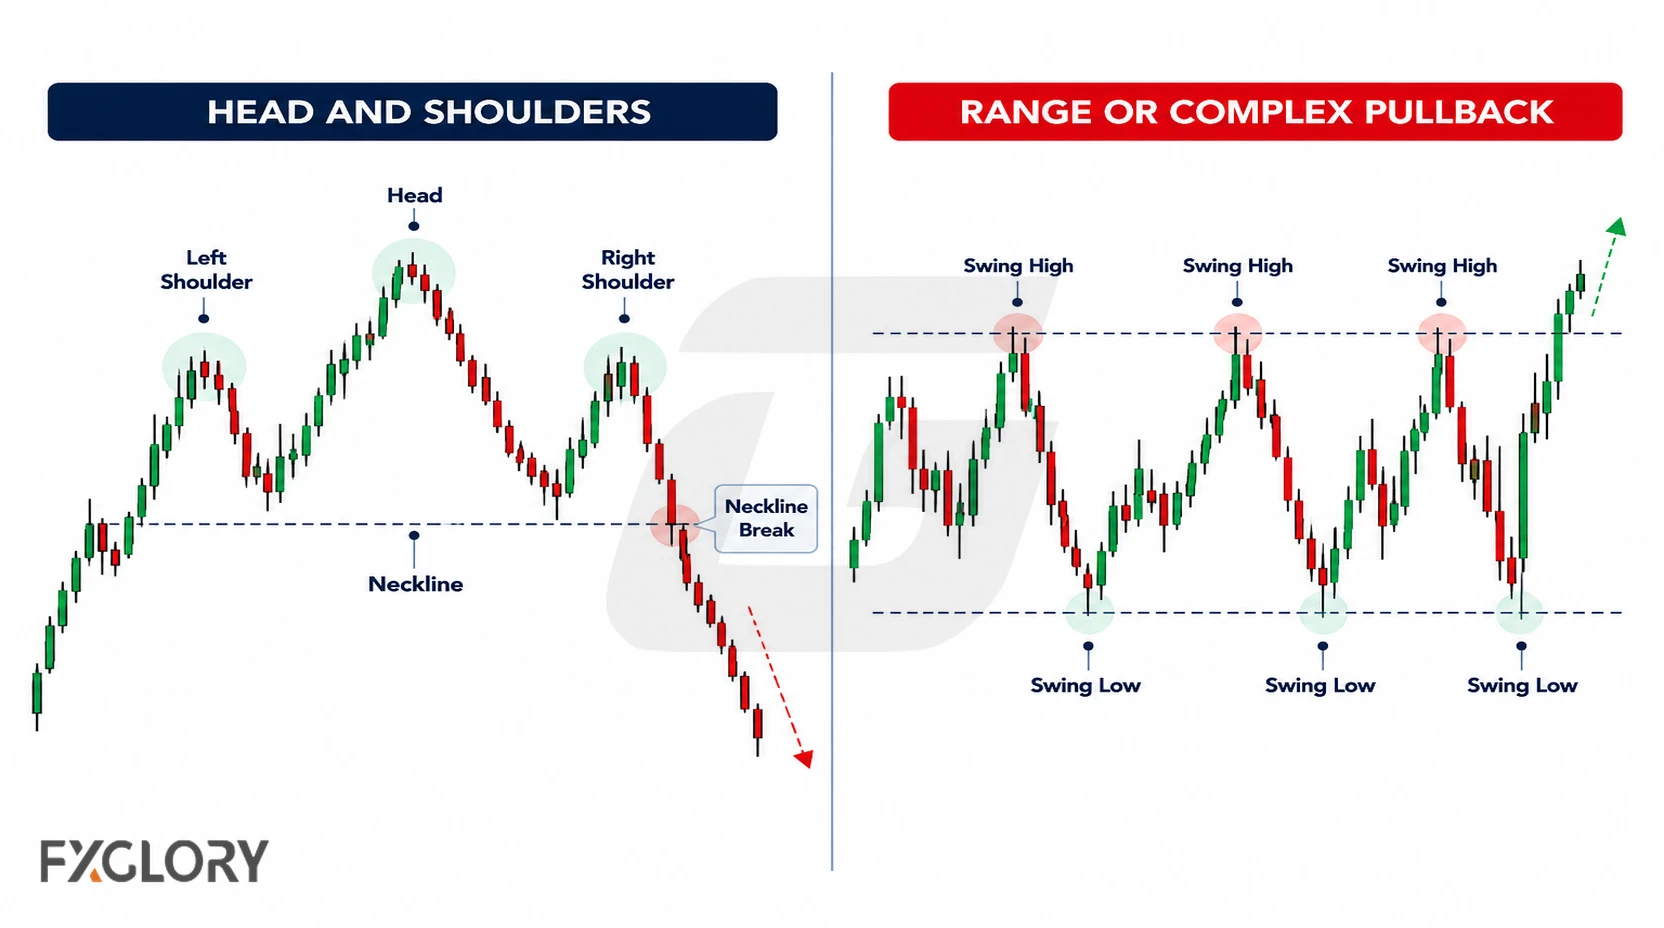
| Question | Head and Shoulders Clue | Range or Complex Pullback Clue |
|---|---|---|
| What came before? | A clear trend appears before the structure | Price was already sideways, mixed, or choppy |
| Is the head clear? | The middle swing clearly extends beyond both shoulders | The middle swing is only one of several similar swings |
| What does the neckline do? | Price breaks, closes, retests, or holds beyond a meaningful neckline area | Price keeps rotating around the same support and resistance areas |
| What weakens the reversal idea? | Price returns inside the structure or breaks beyond the right shoulder or head area | Price continues moving sideways without a clear structure failure |
| Better reading | Possible reversal scenario after neckline confirmation | Range or complex pullback until one side clearly fails |
Head and Shoulders vs Double Top
Head and shoulders and double top patterns can both appear near the end of an upward move, but they are not the same structure.
| Pattern | Main Structure | Decision Area | Careful Reading |
|---|---|---|---|
| Head and shoulders | Left shoulder, higher head, right shoulder | Neckline connecting pullback areas | Focus on three-swing structure and right-shoulder failure |
| Double top / M pattern | Two resistance reactions near a similar upper area | Middle support or neckline area | Focus on repeated resistance and neckline behavior |
When the structure has two main resistance tests instead of a clear shoulder-head-shoulder sequence, the M-shaped resistance reaction may be the closer pattern. When the structure forms after a downward move with repeated support, the W-shaped support reaction may be more relevant.
Forex Context: Sessions, News, Spread, Slippage, and Volume
Forex head and shoulders patterns should be read with market conditions because currency pairs trade across global sessions. A neckline break that looks clean during quiet movement may behave differently during a session overlap, economic release, or fast volatility shift.
- Session behavior: Neckline breaks during active sessions may behave differently from moves during thin liquidity.
- News events: Economic releases and central-bank comments can overpower a technical structure quickly.
- Spread and slippage: Fast movement around the neckline, retest, right shoulder, or head area can affect execution and risk.
- Pair behavior: Different currency pairs may react differently around repeated swing points and neckline areas.
- Timeframes: A lower-timeframe head and shoulders pattern can conflict with a stronger higher-timeframe trend, support, or resistance area.
- Volume limits: Spot forex does not have one centralized exchange volume figure, so volume-style readings need careful interpretation.
Some traders watch whether tick activity changes around the right shoulder or neckline break, but this remains supporting context. When volume-style context matters, tick-volume reading in forex should stay secondary to structure, confirmation, and risk.
Using Indicators and Candles With Head and Shoulders
Indicators and candlestick reactions can support head-and-shoulders analysis, but they should not replace price structure. The pattern still needs a prior trend, a clear head, explainable shoulders, neckline behavior, confirmation, and invalidation.
| Tool Type | What It Can Help Read | Careful Use |
|---|---|---|
| Momentum indicators | Whether pressure is fading around the head or right shoulder | Divergence can continue for some time and needs structure confirmation |
| Trend-strength indicators | Whether the old trend is weakening or still strong | They may lag after price has already moved |
| Oscillators | Whether price appears stretched near a shoulder or head area | Overbought or oversold readings are not reversal proof |
| Moving-average context | Whether price is shifting around a broader trend reference | A moving average does not confirm the pattern by itself |
| Bollinger Bands context | Whether price is reacting near an outer band or returning toward a middle area | Band reactions need neckline and structure confirmation |
| Candlestick reactions | Short-term rejection or hesitation near the right shoulder or neckline | One candle is not the same as a full head and shoulders structure |
| Tick activity | Activity around the right shoulder, neckline break, or retest | It is supporting context, not centralized market volume |
When momentum is part of the reading, MACD momentum context or RSI pressure readings may help organize the analysis. When trend strength matters, ADX trend-strength context can be useful. When price reacts near a band area, Bollinger Bands context should still be checked against the neckline and invalidation. When candle reaction matters near the neckline, candlestick behavior around key areas can add short-term detail.
Example: Reading Head and Shoulders on EUR/GBP
Suppose EUR/GBP has been moving upward, then price forms a swing high, pulls back, forms a higher swing high, pulls back again, and later fails to match the higher swing. A trader may first describe the market as an upward move followed by a possible shoulder-head-shoulder structure, without assuming the pattern is confirmed.
If price breaks below the neckline area and holds, that may create a bearish reversal scenario. If price breaks above the right shoulder or head area and holds, the head-and-shoulders idea weakens. If price keeps rotating around the neckline, the structure may remain a range or complex pullback rather than a completed reversal pattern.
The useful questions are simple: Was there a clear prior trend? Is the head clearly beyond both shoulders? Is the neckline visible? Does price confirm beyond it? Where is the pattern idea wrong?
Common Mistakes With Head and Shoulders in Forex
Head-and-shoulders mistakes often happen when traders see three swings and assume a reversal must follow.
- Entering before neckline confirmation: The trader reacts to the right shoulder before the structure has developed.
- Forcing symmetry: The shoulders do not need to be identical, but the structure should still be explainable.
- Ignoring the prior trend: The trader labels sideways movement as a reversal pattern.
- Forcing the neckline: The neckline is drawn from one weak wick or adjusted too much.
- Ignoring false breaks: Price breaks the neckline briefly, then returns inside the structure.
- Confusing it with a double top: A two-peak M shape is treated as a full shoulder-head-shoulder structure.
- Missing higher-timeframe context: A small pattern fights a larger trend or major level.
- Overusing volume assumptions: Volume-style clues are treated as if spot forex had one centralized exchange volume figure.
- No invalidation: The trader knows the expected reversal scenario but not the point where the idea is wrong.
Beginner Workflow for Head and Shoulders
A clear process helps keep the head and shoulders pattern from becoming guesswork.
- Start with the prior trend: Check whether price was clearly rising before the standard pattern or falling before the inverse version.
- Identify the left shoulder: Mark the first visible swing point.
- Find the head: Check whether the middle swing clearly extends beyond the shoulder area.
- Check the right shoulder: Decide whether price is truly failing to match the head or simply pausing.
- Draw the neckline carefully: Treat it as an area, not an exact prediction line.
- Wait for evidence: Look for neckline break, close, retest, hold, or supporting context.
- Define invalidation: Mark where the pattern idea becomes wrong.
- Check forex conditions: Consider session, news, spread, slippage, volatility, and pair behavior.
- Review the outcome: Whether the idea works or fails, check if the structure was actually clear.
This process keeps the focus on structure, neckline behavior, confirmation, invalidation, and risk instead of treating the head and shoulders pattern as an automatic reversal signal.
A Safer Way to Read Head and Shoulders in Forex
The head and shoulders pattern helps traders organize a possible trend-exhaustion scenario. The standard version is usually studied after an upward move, while the inverse version is usually studied after a downward move.
The strongest head-and-shoulders ideas begin with a clear prior trend, an explainable left shoulder, a distinct head, a meaningful right shoulder, a visible neckline, confirmation behavior, and a defined invalidation point. If these parts are missing, the pattern may not be ready for a trading decision.
Head-and-shoulders analysis becomes more useful when it is read with context. Session behavior, news, spread, slippage, volatility, timeframe alignment, pair behavior, position size, and account risk still matter.