

What Is Forex Market Structure?
In technical analysis, forex market structure is the arrangement of important swing highs and swing lows on a currency-pair chart. Traders use that arrangement to describe whether price is trending, ranging, transitioning, or unclear.
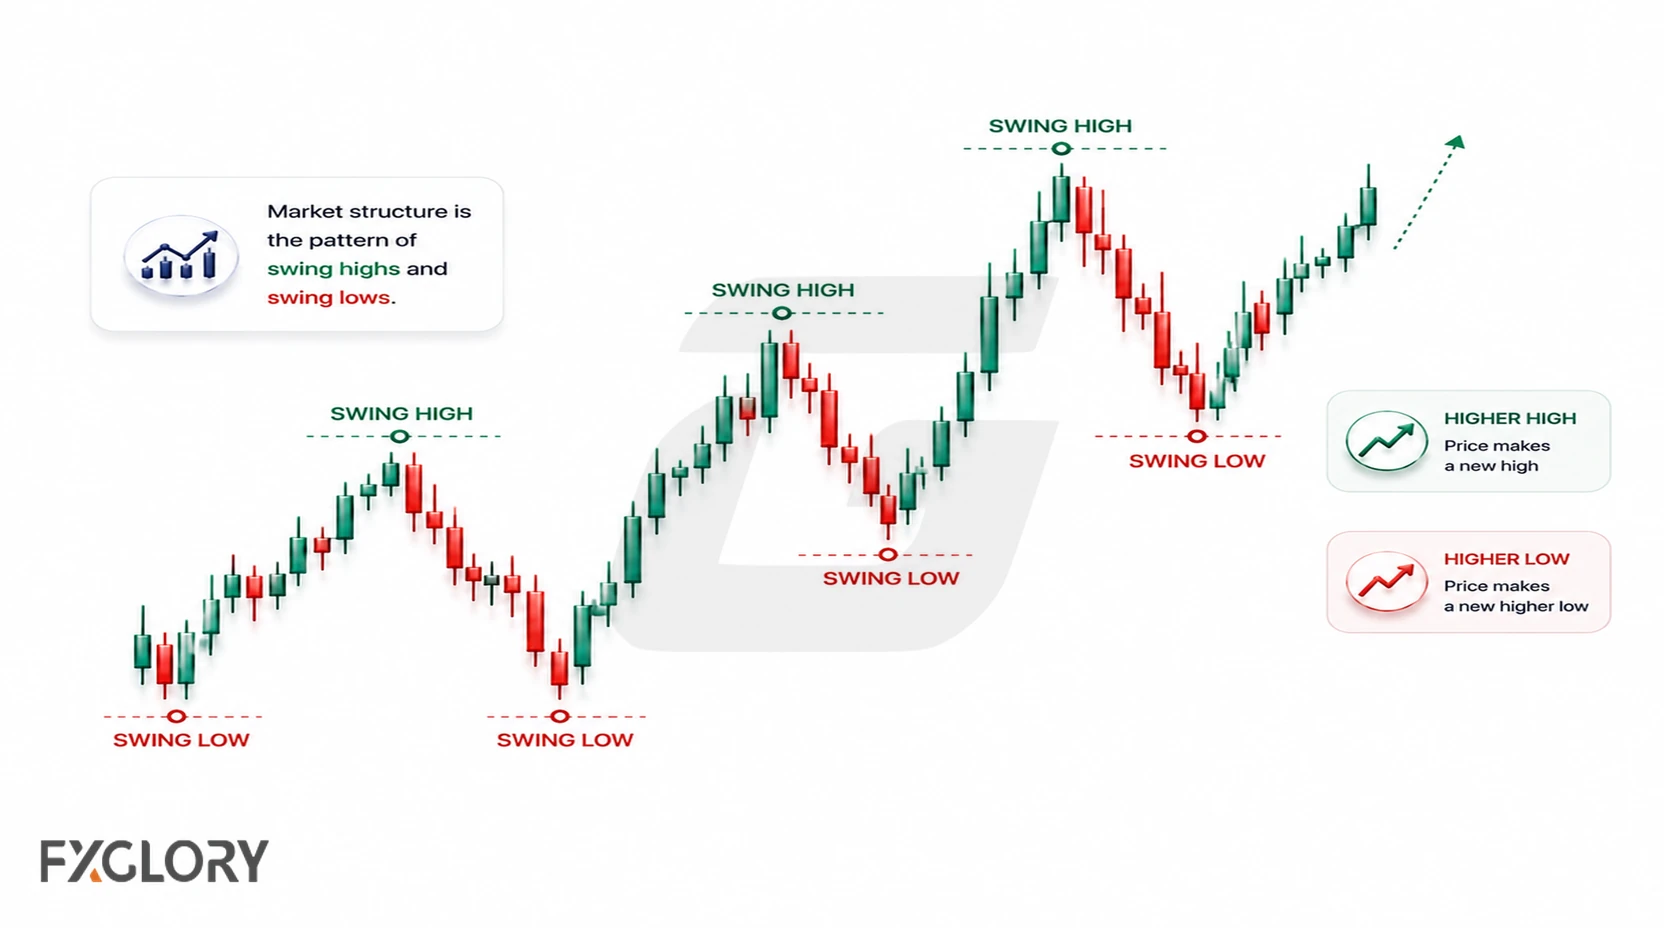
Structure gives individual candles, levels, and patterns a broader context. Instead of judging one move in isolation, a trader can compare the current swing with prior swings and ask whether price is making directional progress, moving sideways, or changing behavior.
For the broader chart-reading framework around this topic, see technical analysis forex.
Two Meanings of Forex Market Structure
The term forex market structure is used in two different ways, and separating them prevents confusion:
- Structure of the forex market: How the global foreign-exchange market is organized, including banks, brokers, liquidity providers, spot markets, forwards, futures, and retail participants.
- Chart-based market structure: How major price swings form trends, ranges, breaks, failed breaks, and structural changes on a chart.
The rest of this guide uses the chart-based meaning because it is the one relevant to technical analysis and chart reading.
Why Forex Market Structure Matters
Market structure matters because it gives price movement context. Instead of reacting to one candle, level, or breakout attempt, a trader can assess whether the broader swing arrangement is continuing, weakening, ranging, or changing.
- Describe market condition: Structure helps distinguish trending, ranging, transitional, and unclear price behavior.
- Track directional progress: Successive higher or lower swings show whether price is continuing to make progress in one direction.
- Identify important reference points: Prior swing highs and lows provide locations for comparing current price behavior with earlier turns.
- Define invalidation: A structural view becomes more useful when the trader can state what price behavior would make that view no longer valid.
- Reduce isolated decision-making: A broader structure can keep one candle, indicator reading, or breakout from being interpreted without context.
How Swing Highs and Lows Form Forex Market Structure
A swing high is an area where price rises and then turns lower. A swing low is an area where price falls and then turns higher. Comparing successive swings is the foundation of a basic forex market structure chart.
The important question is not whether every minor high or low can be marked, but whether the swings being compared are meaningful on the chosen timeframe.
- Higher high (HH): Price pushes above a previous important high.
- Higher low (HL): A pullback turns higher above the prior important low.
- Lower low (LL): Price pushes below a previous important low.
- Lower high (LH): A rally turns lower below the prior important high.
- Overlapping swings: Highs and lows repeatedly overlap without a clean directional sequence.
These relationships make it easier to describe structure consistently. A single higher high or lower low, however, does not automatically define the entire market condition; it should be read in relation to the surrounding swings.
Forex Market Structure Patterns: Bullish, Bearish, Ranging, and Transitional
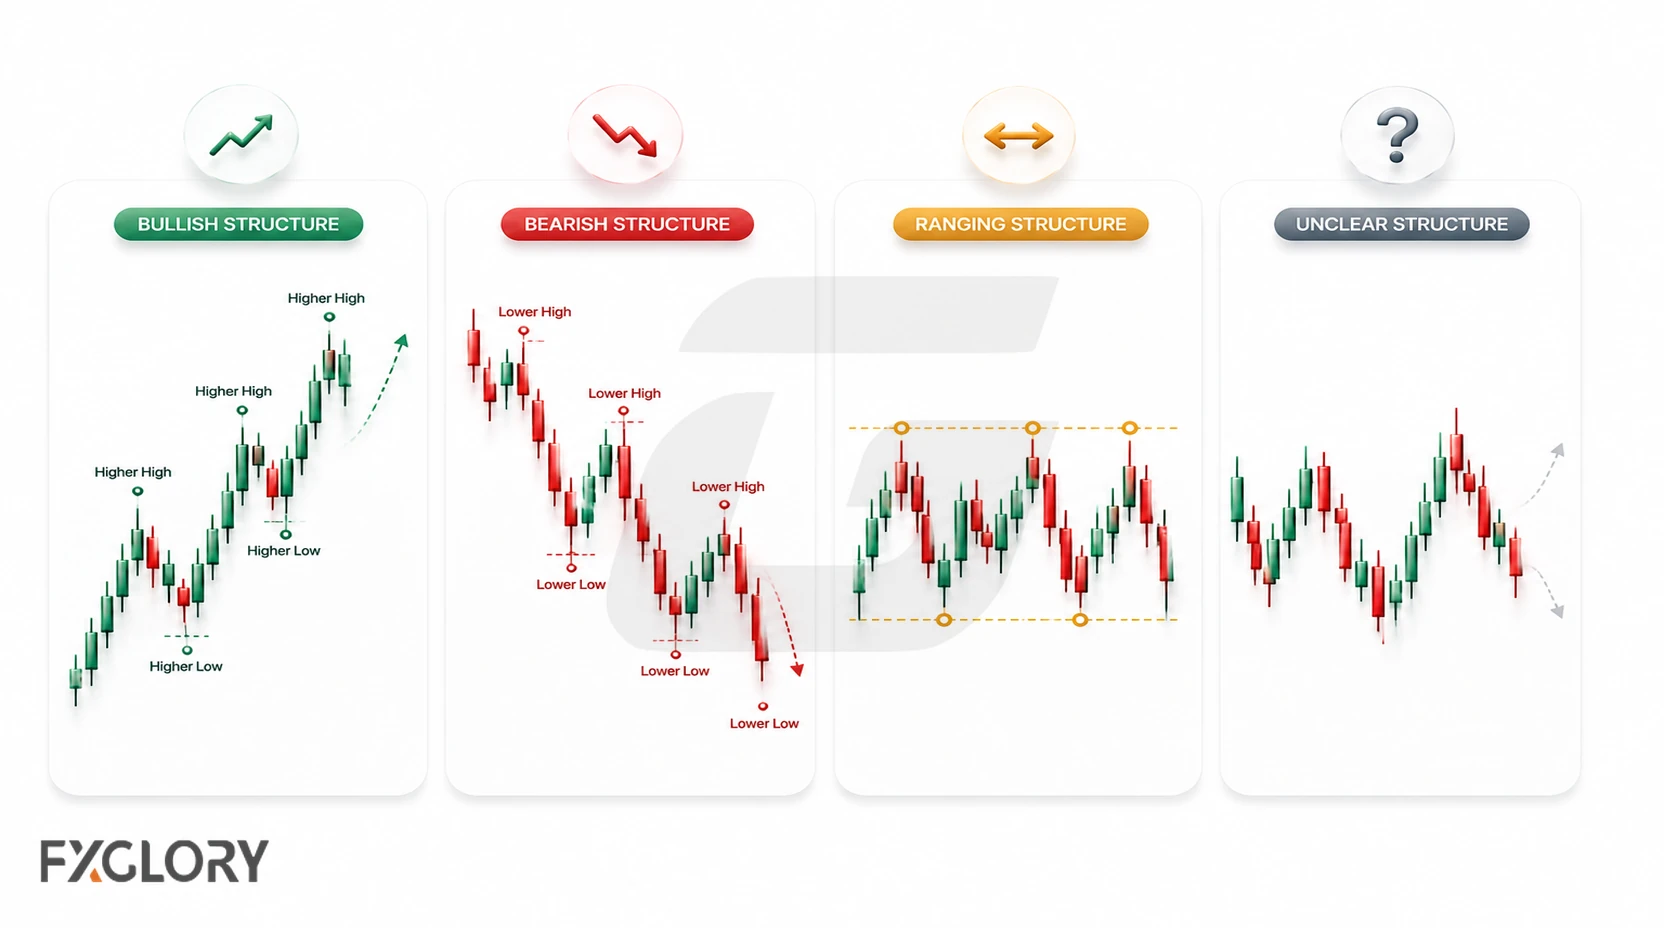
Common forex market structure patterns are based on how successive highs and lows relate to one another. The labels describe the current arrangement of price, not a guaranteed next move.
| Structure Type | Typical Swing Sequence | What It Describes | What Can Change the Read |
|---|---|---|---|
| Bullish structure | Higher highs and higher lows | Price is making upward structural progress | A key higher low fails and the swing sequence changes |
| Bearish structure | Lower lows and lower highs | Price is making downward structural progress | A key lower high fails and the swing sequence changes |
| Ranging structure | Overlapping or similar highs and lows | Price is moving sideways rather than building a clean trend | A sustained move outside the range changes the structure |
| Transitional or unclear structure | Mixed swings or a broken prior sequence | The previous condition may be weakening or reorganizing | New swings establish a clearer trend or range |
If a structure label requires ignoring obvious contradictory swings, the chart may be better described as transitional or unclear until a cleaner sequence develops.
BOS, CHOCH, MSS, Continuation, and Structure Shifts
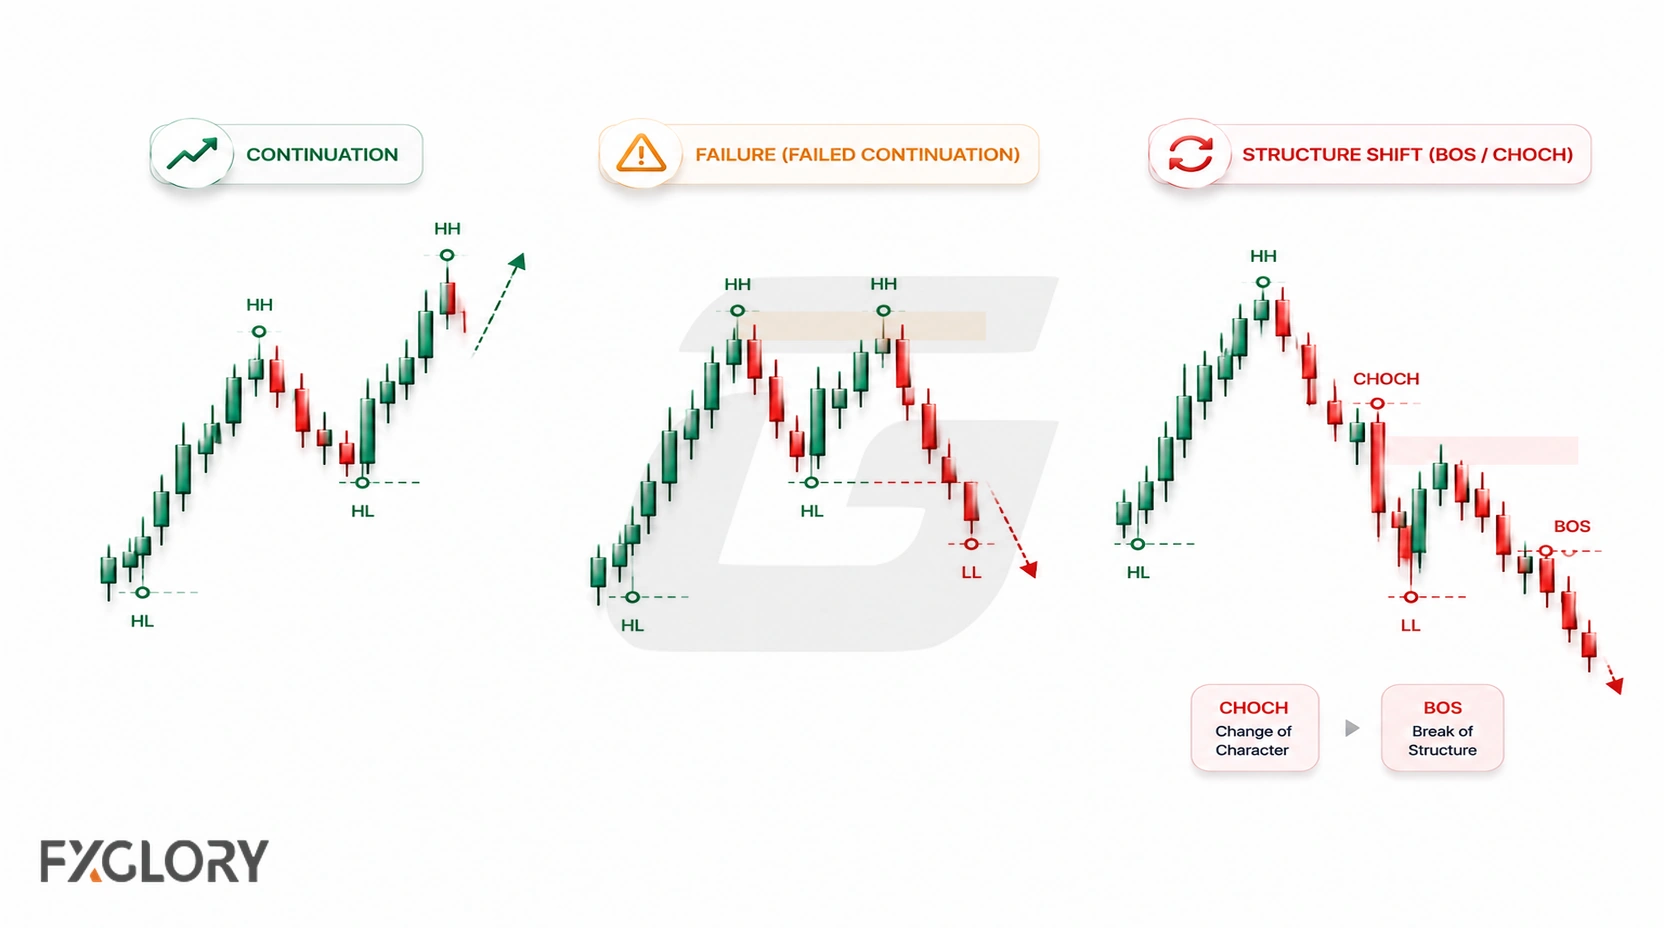
Traders use terms such as break of structure (BOS), change of character (CHOCH), and market structure shift (MSS) to describe what price does around prior structural highs and lows. Definitions can vary between trading frameworks, so the surrounding swing sequence matters more than the label alone.
| Term or Behavior | How It Is Commonly Used | What to Check |
|---|---|---|
| Continuation | Price breaks a structural point and continues building in the same direction | Whether the next swings preserve the existing sequence |
| Failed continuation | Price moves beyond a structural point but returns into the prior structure | Whether the break was temporary and whether the chart becomes a range |
| BOS | A break of a prior structural high or low | Trend context, timeframe, and whether price holds beyond the broken point |
| CHOCH | Behavior that differs from the previous swing pattern and may warn of change | Whether later swings confirm that the old sequence has weakened |
| MSS | A broader label for a possible shift from one structural condition to another | How the new highs and lows reorganize after the initial change |
Market Structure and Reaction Zones
Previous structural highs and lows often become reference areas when price returns to them. A broken swing, failed-break area, or earlier turning point can therefore be watched as a reaction zone within the wider structure.
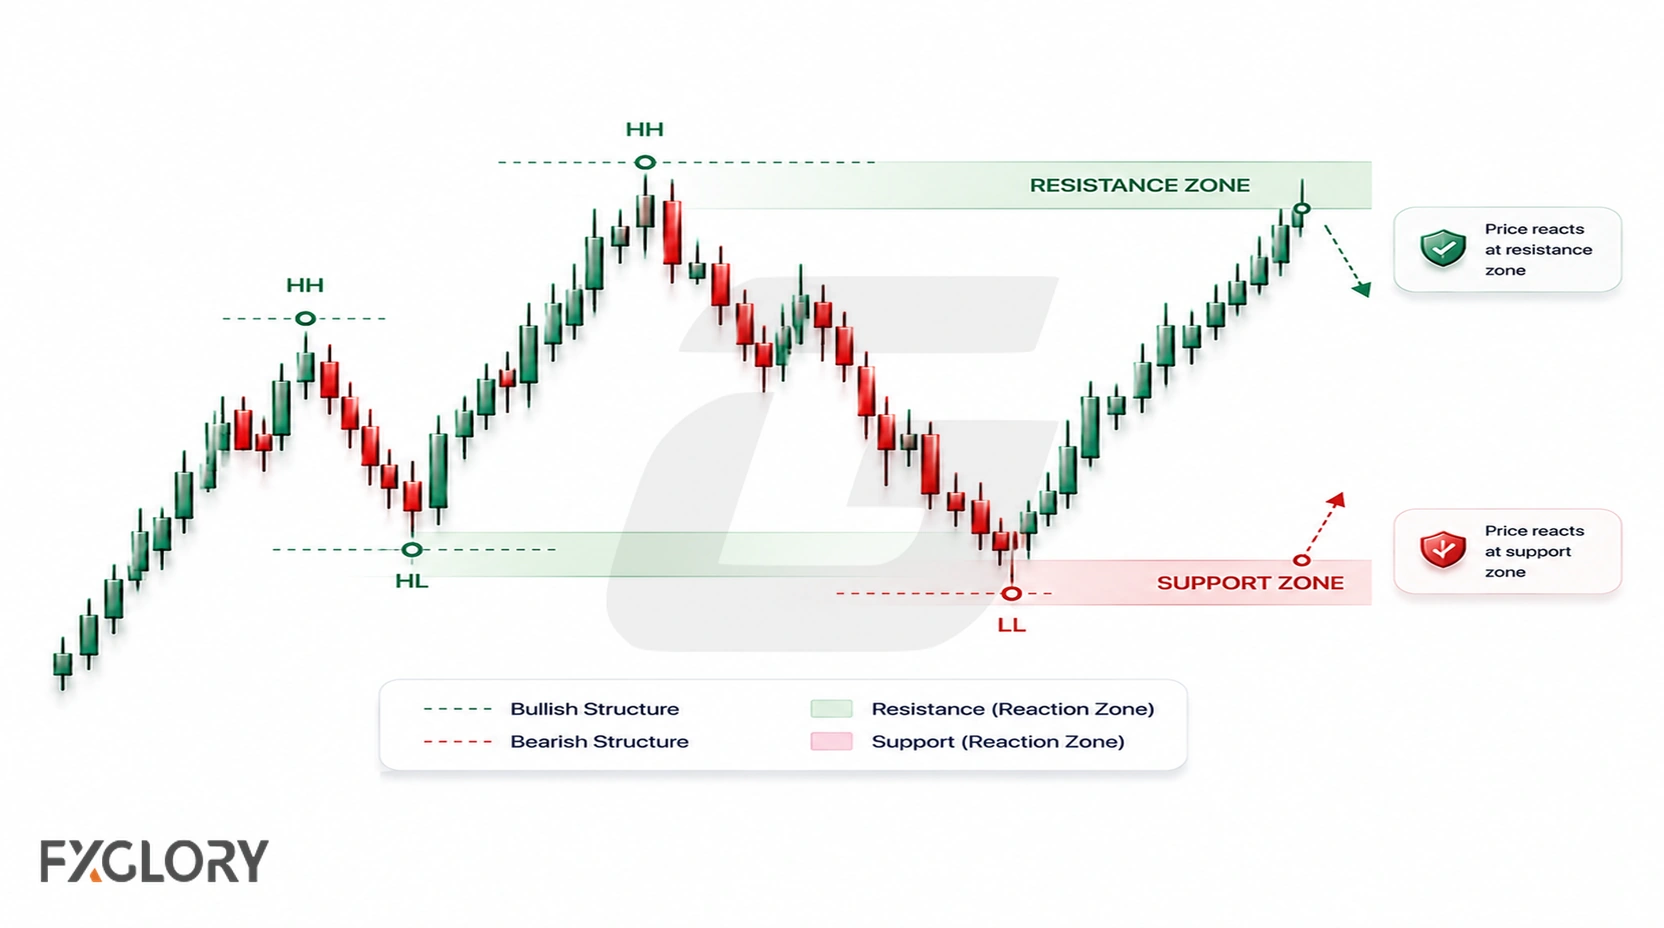
A reaction zone is a reference area, not a promise that price will hold there. Price can pause, reject, break through, retest, or move through the zone with little response. For a deeper guide to these areas, see support and resistance in forex.
How to Read and Understand Forex Market Structure
To read forex market structure, start with the clearest swings and build the interpretation in a fixed order. This reduces the temptation to change the structure label every time a minor candle moves against the current swing.
- Choose the pair and timeframe: Structure is timeframe-dependent, so define what chart you are actually reading.
- Mark the major swing highs and lows: Focus on obvious turning points rather than every small fluctuation.
- Compare the swing sequence: Look for HH-HL, LL-LH, overlapping swings, or a mixed sequence.
- Name the current condition: Describe it as bullish, bearish, ranging, transitional, or unclear.
- Watch the active swing: Ask whether price is continuing the sequence, failing to extend it, or breaking an important structural point.
- Note relevant reaction zones: Use previous structural highs, lows, and broken areas as context for the current move.
- Define invalidation: State what price behavior would make the current structural interpretation no longer valid.
- Apply the trading plan separately: Position sizing, risk limits, execution rules, spreads, and other trading decisions are not supplied by structure alone.
Multi-Timeframe Market Structure
Forex market structure can look different on different timeframes. For example, a lower timeframe can show a short-term bullish sequence while a higher timeframe remains bearish or range-bound.
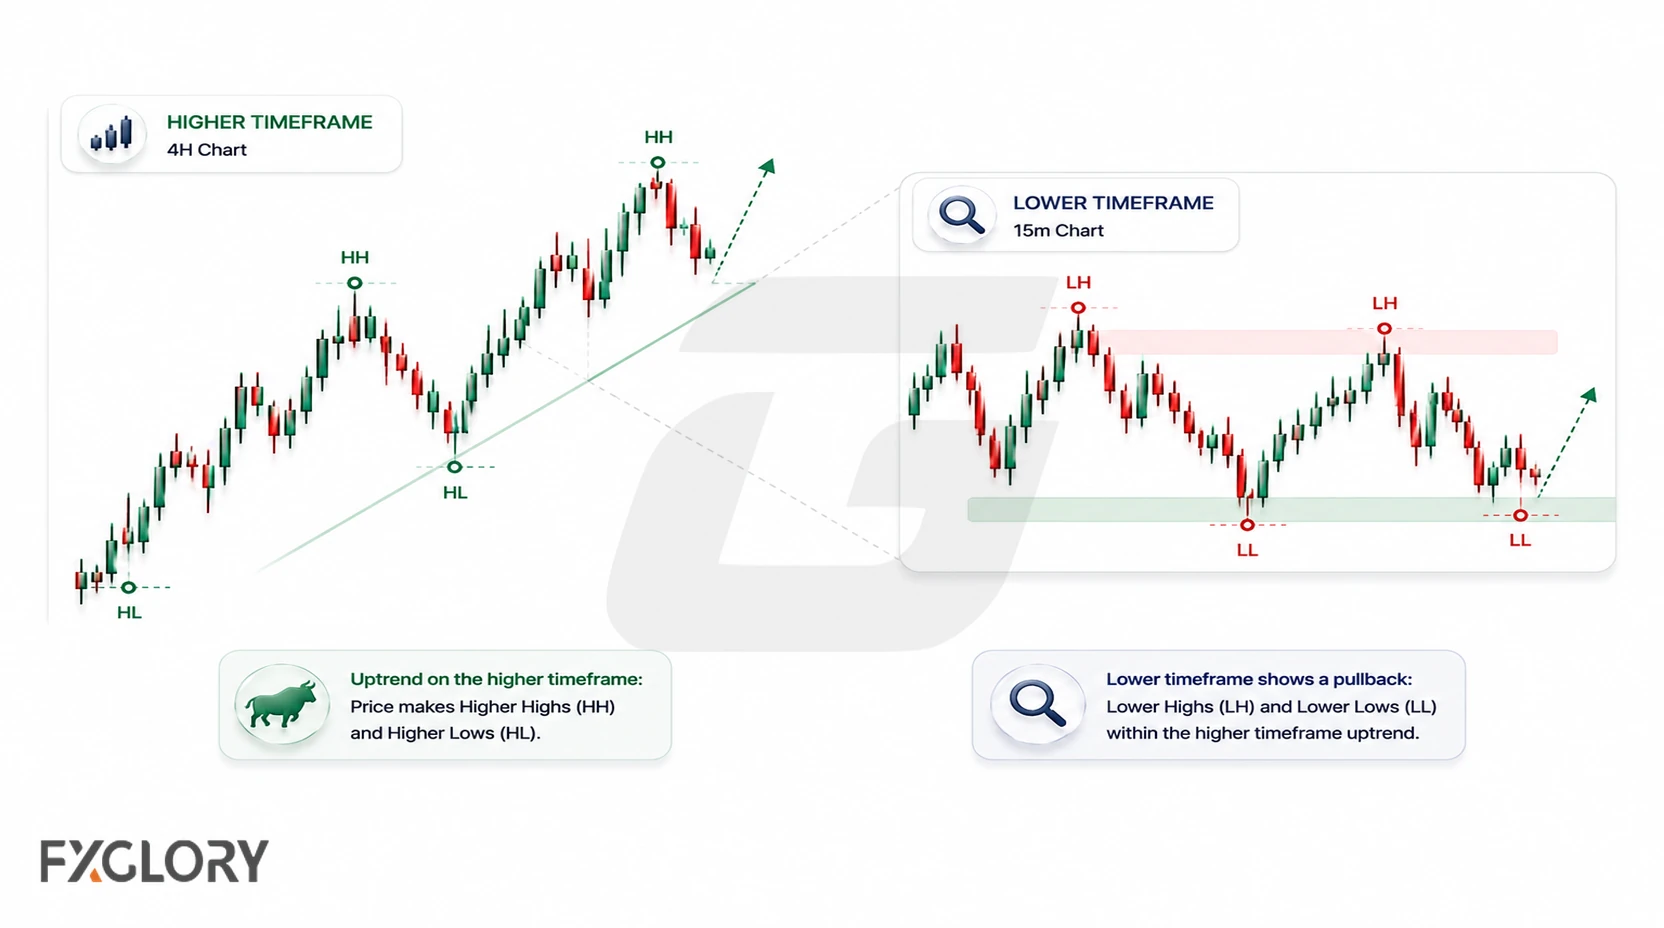
- Higher timeframe: Shows broader swings and the larger market condition.
- Lower timeframe: Reveals more detail inside those larger swings.
- Conflicting structure: Occurs when the lower-timeframe sequence points in a different direction from the higher-timeframe structure.
A top-down read can help separate a local counter-swing from a broader structural shift. The timeframes used should remain consistent with the trader's method rather than being changed simply to find a preferred interpretation.
Market Structure vs Price Action, Chart Patterns, and SMC
Market structure overlaps with several chart-reading concepts, but the terms are not interchangeable.
- Market structure: The broader arrangement of major swings, trends, ranges, breaks, and shifts.
- Price action: The direct reading of how price behaves inside and around that structure. Learn more in what is price action in forex.
- Chart patterns: Named formations such as triangles, flags, double tops, double bottoms, and head and shoulders. Learn more in forex chart patterns.
- SMC: Smart Money Concepts may combine market structure with additional ideas such as liquidity, order blocks, sweeps, and imbalances.
This article stays with the basic structure framework rather than teaching a complete SMC system or a mechanical trading strategy.
When Forex Market Structure Is Unclear
Some charts do not offer a clean structural read. Treating uncertainty as a valid conclusion can be more accurate than forcing every chart into a bullish or bearish label.
- Weak swing points: Highs and lows are too small or too close together to establish a useful sequence.
- Overlapping movement: Price repeatedly crosses the same area without sustained directional progress.
- Conflicting timeframes: Short-term structure points one way while the broader timeframe points another.
- Fast news-driven movement: Sudden volatility can break multiple levels before a stable structure forms.
- Thin liquidity: Price can move sharply or irregularly when market depth is reduced.
Common Mistakes When Reading Forex Market Structure
Most market-structure errors come from inconsistent swing selection or from treating a structural event as a complete trading decision.
- Marking every minor swing: Too many points obscure the sequence that matters on the chosen timeframe.
- Changing timeframe mid-analysis: A structure label loses consistency when the reference timeframe keeps changing.
- Ignoring higher-timeframe context: A lower-timeframe break can be a small counter-move inside a larger structure.
- Assuming every break confirms direction: Price can break a swing and quickly return into the previous structure.
- Using BOS, CHOCH, or MSS without defining the swings: Acronyms do not replace a clear explanation of what price actually broke or changed.
- Forcing extra SMC concepts: Liquidity, order blocks, and sweeps can complicate the chart if the basic swing structure is not clear first.
- Leaving invalidation undefined: Without a condition that would make the structural view wrong, the analysis becomes difficult to test consistently.
Forex Market Structure Example: EUR/USD
Suppose EUR/USD is making a sequence of higher highs and higher lows on the timeframe being studied. That sequence can be described as bullish market structure.
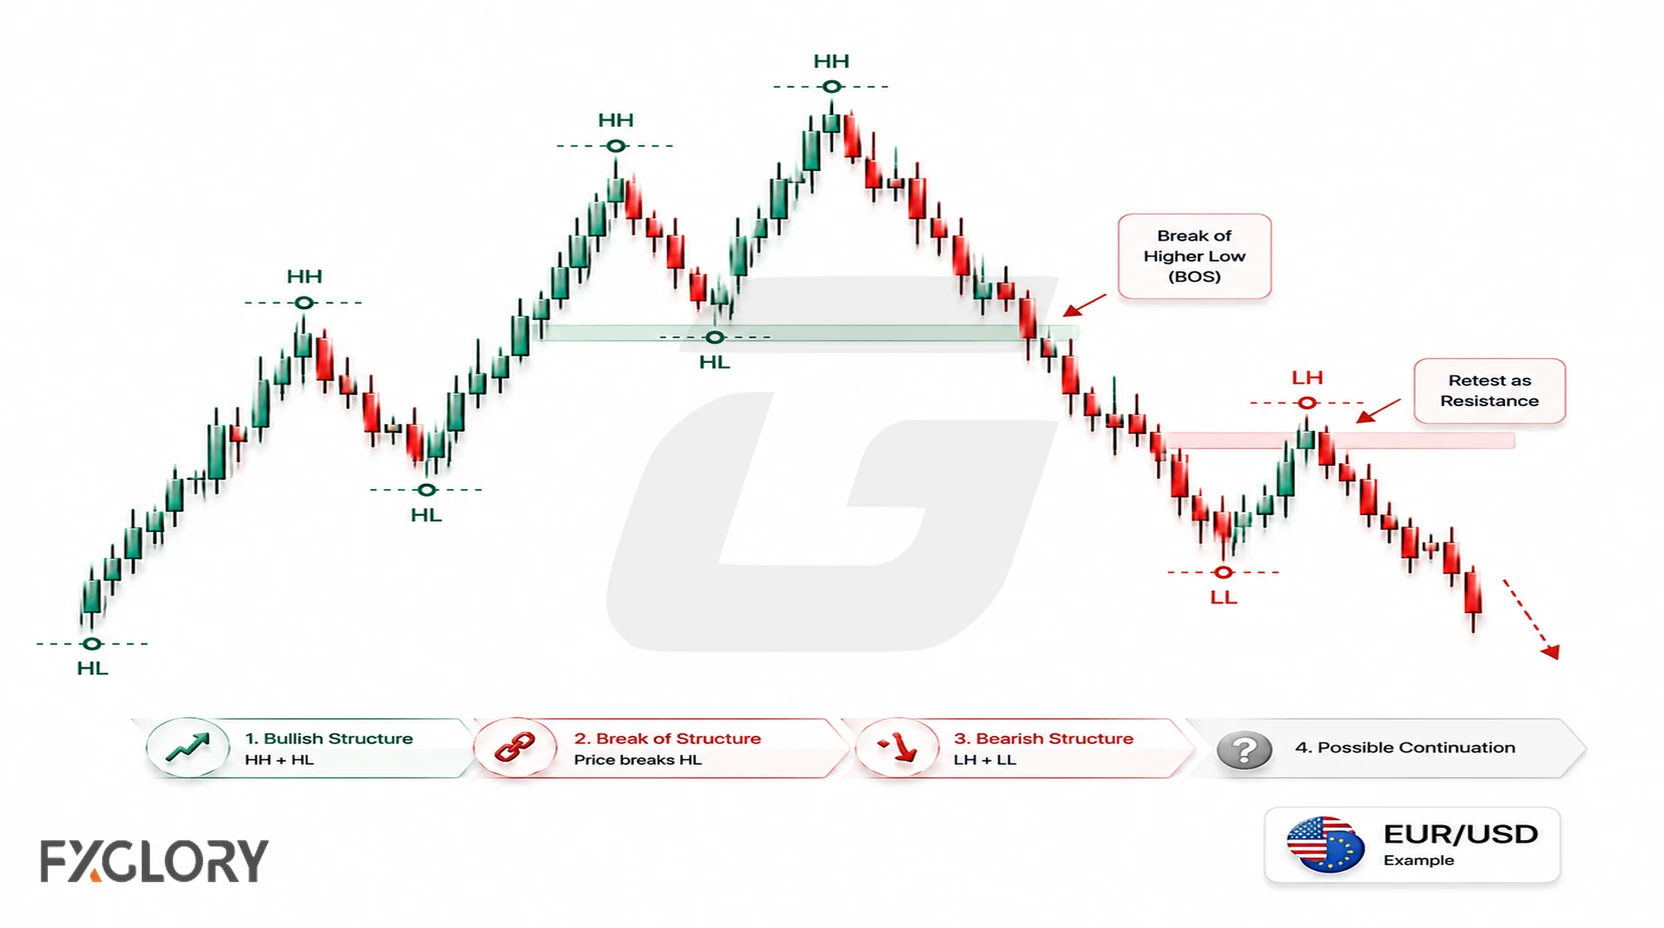
Now suppose price fails to make another higher high and then breaks below a recent higher low. The original bullish sequence has been interrupted. At that point, the chart may be described as transitional rather than immediately bearish because a single break does not necessarily establish a full lower-high, lower-low sequence.
If price quickly recovers above the broken area, the break may prove temporary. If subsequent swings form lower highs and lower lows, the evidence for bearish structure becomes stronger. The useful part of the example is the sequence of observations: identify the prior structure, note what changed, and wait for later swings to clarify the new condition.
A Practical Framework for Forex Market Structure
A consistent market-structure read starts with the timeframe and major swing points. From there, classify the swing sequence, watch how the current move behaves around prior structural points, and define what would invalidate the interpretation. If the swings remain mixed or contradictory, describing the structure as ranging, transitional, or unclear is more useful than forcing a directional label.