
What Is Price Action in Forex?
Price action in forex means reading how a currency pair moves on the chart through its own price behavior. It focuses on candles, swings, highs, lows, trends, ranges, reaction zones, breakouts, failed moves, and changes in momentum.
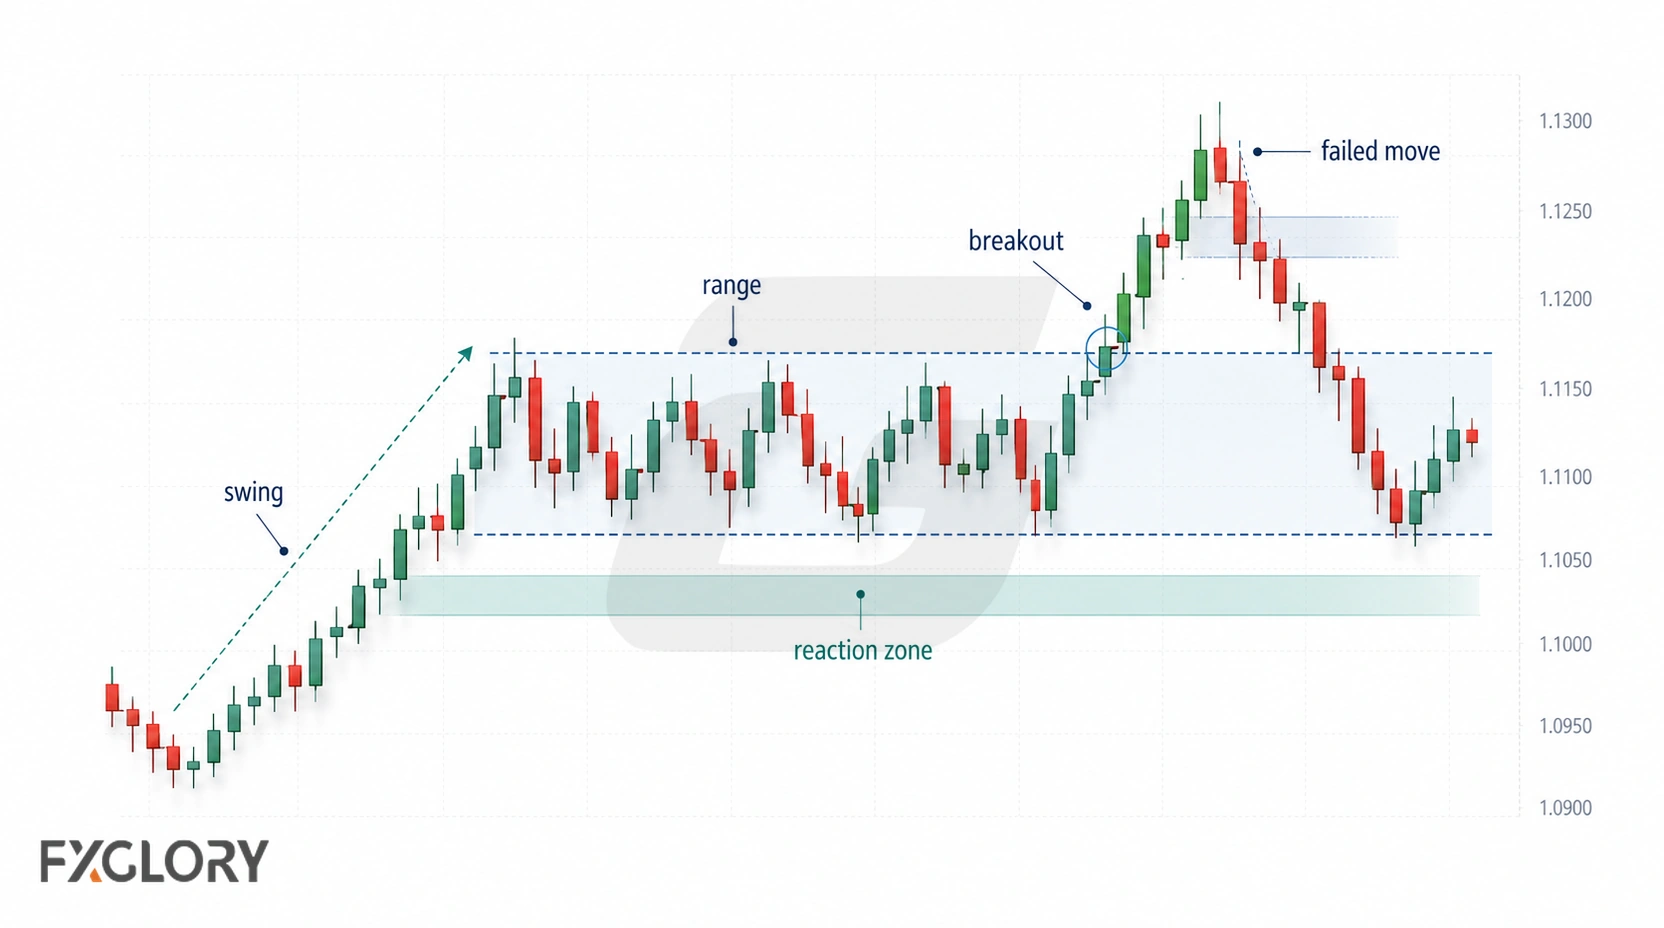
A price-action trader studies what price is doing before adding extra tools. The goal is to describe what price is doing now, what scenario that creates, and where that scenario fails.
Price action sits within the broader discipline of technical analysis forex, which can also include indicators, candlestick patterns, chart patterns, and other chart-based tools.
Price Action vs Indicators
Price action reads movement and structure directly from the chart. Indicators apply calculations to market data and display the result as a line, oscillator, band, or other chart tool.
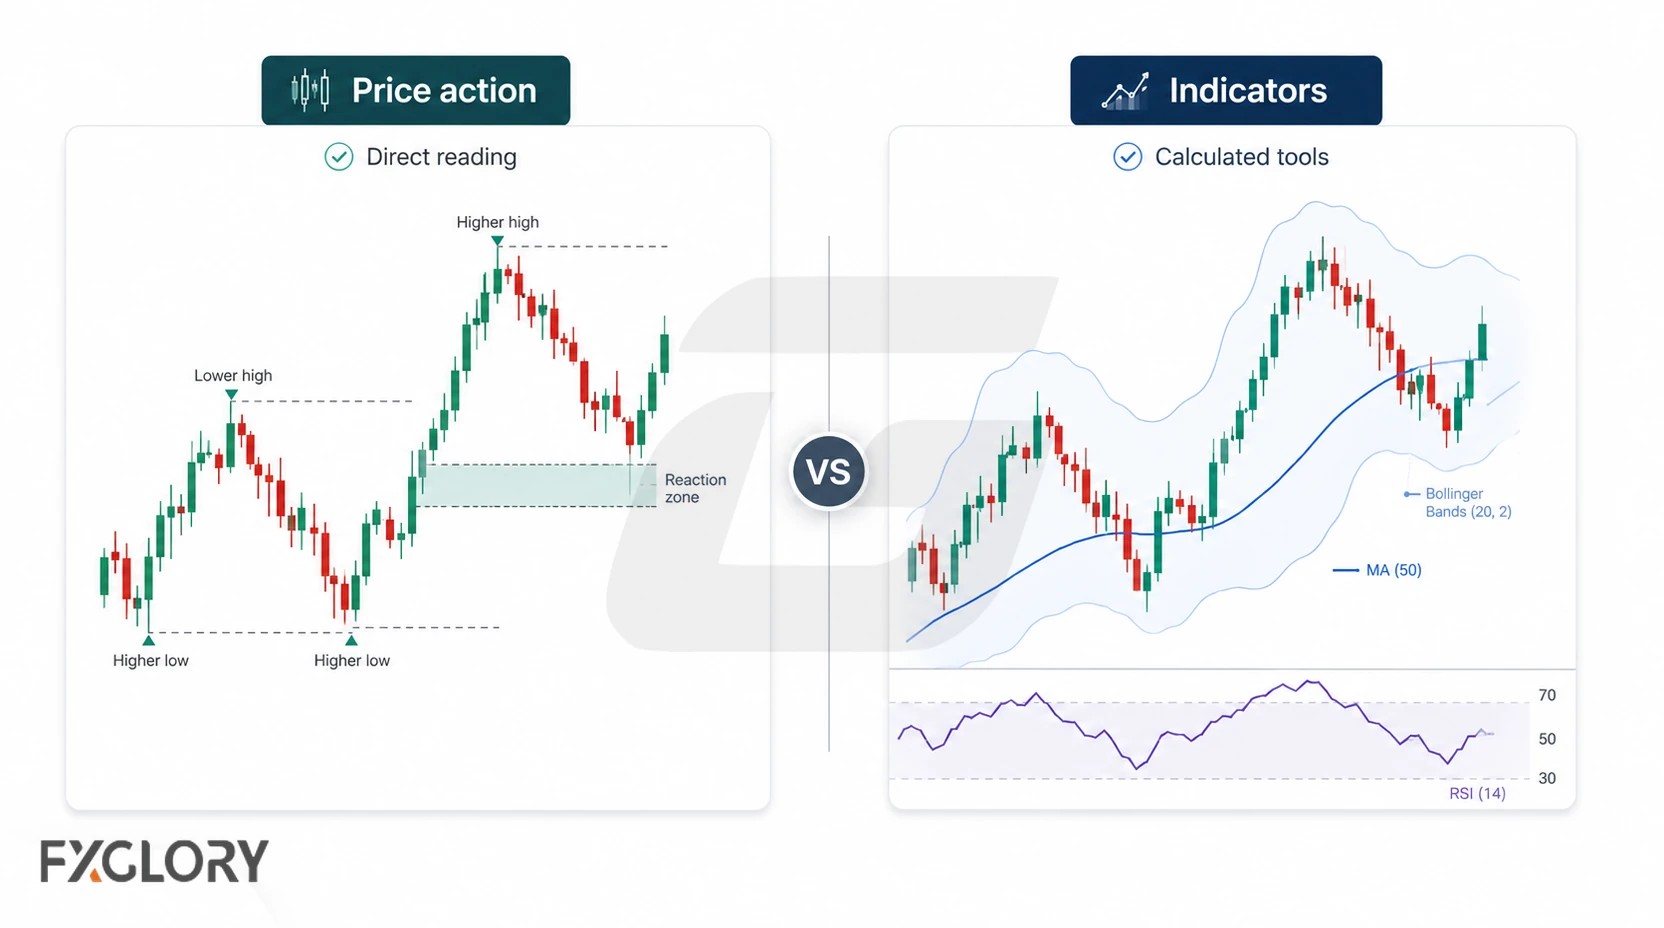
Using price action does not require avoiding indicators. Price action can be used on its own or alongside indicators when those tools help answer a specific question about trend, momentum, volatility, or another market condition.
- Price action: Reads movement, structure, swings, reactions, and failed moves directly from the chart.
- Indicators: Calculate information from available data to describe trend, momentum, volatility, or other conditions.
- Risk control: Still required whether the trader uses price action, indicators, or both.
Price Action vs Candlestick and Chart Patterns
Price action is broader than a single candlestick pattern or named chart pattern. Candlestick patterns and chart patterns can be part of price-action analysis, but they do not replace the full chart context.
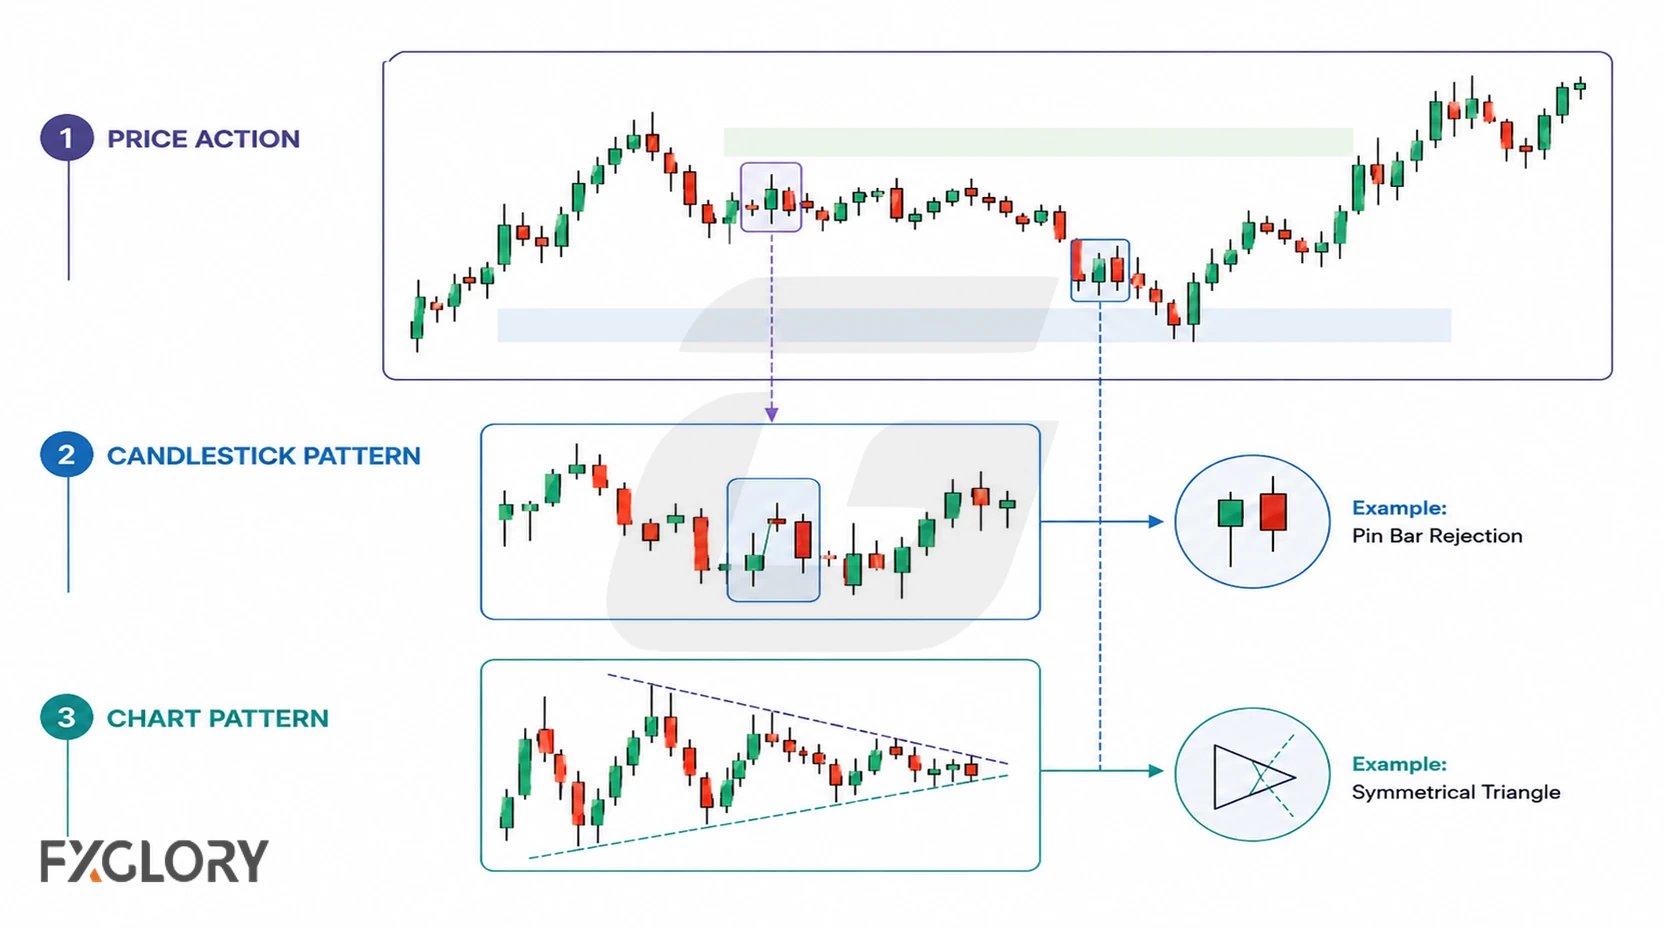
- Price action: Broad reading of price movement, structure, swings, reactions, and failed moves.
- Candlestick patterns: Specific candle formations such as doji, engulfing candles, hammers, or shooting stars. Learn more in forex candlestick patterns.
- Chart patterns: Larger structures such as triangles, flags, double tops, double bottoms, or head and shoulders. Learn more in forex chart patterns.
A candle or named pattern should be interpreted with the surrounding market condition, location, and structure rather than treated as meaningful in isolation.
Building Blocks of Forex Price Action
Forex price action is easier to read when the main building blocks are separated. These blocks describe raw price behavior without turning the chart into a list of signals.
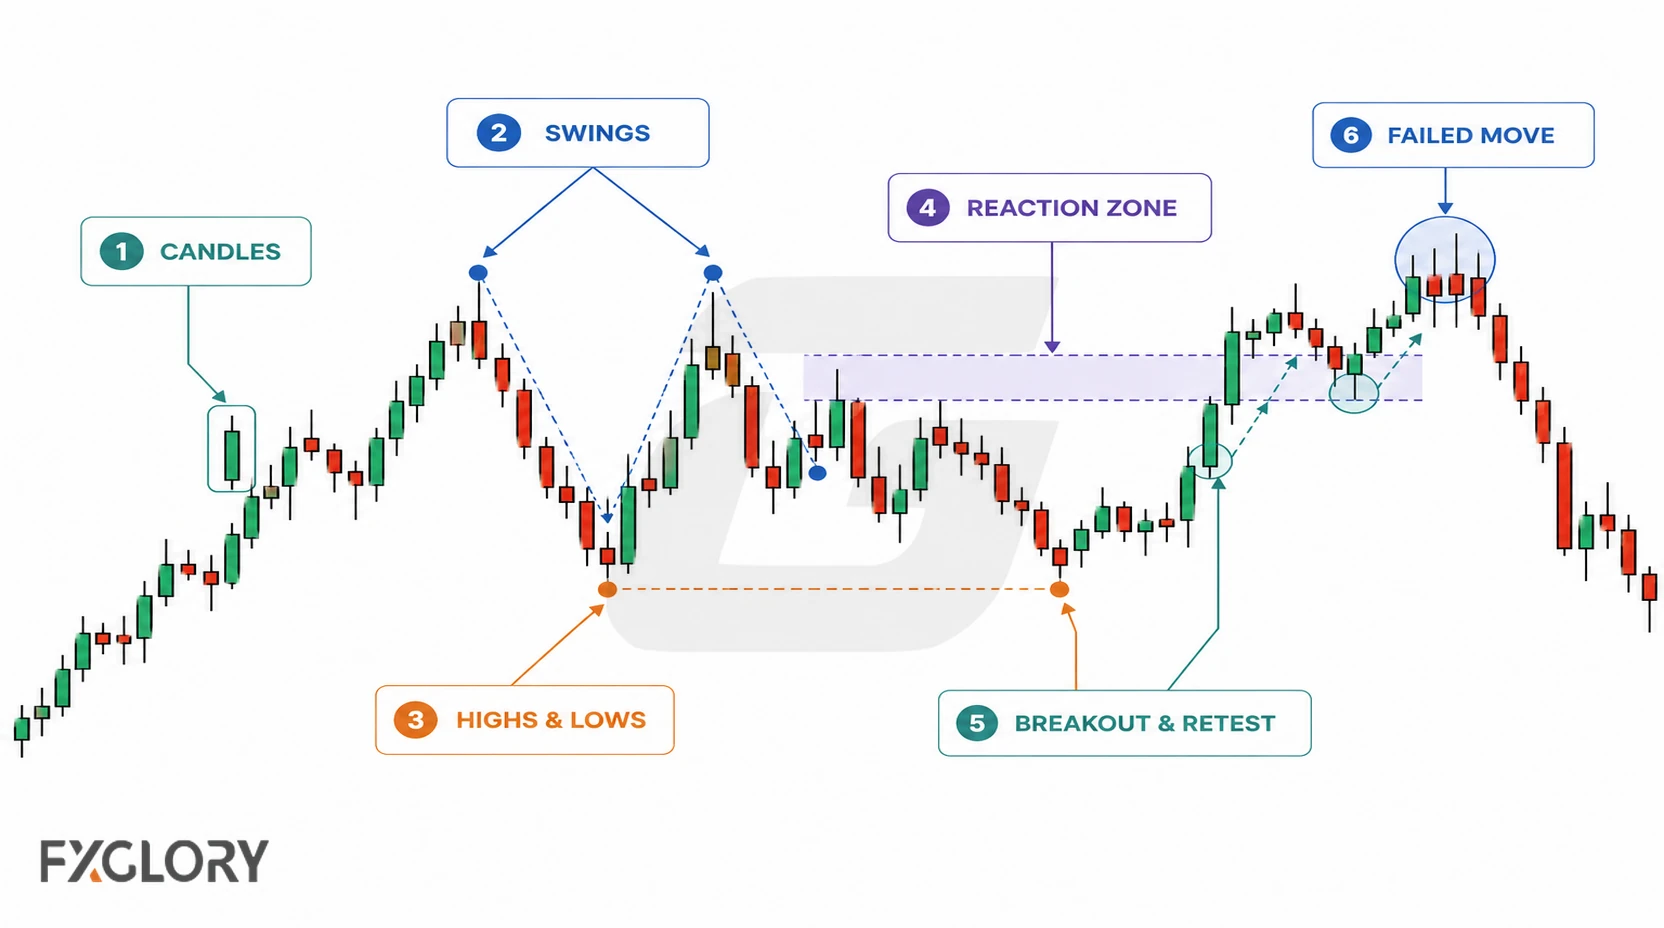
| Building Block | What It Helps Read | Main Risk |
|---|---|---|
| Candles | Short-term movement, rejection, hesitation, or momentum | One candle can be misleading without context |
| Swings | How price moves from one high or low to another | Small swings may be noise on lower timeframes |
| Highs and lows | Whether structure is rising, falling, or mixed | Structure can change quickly during volatility |
| Reaction zones | Areas where price has reacted before | Zones can fail or break |
| Breakouts and retests | Whether price moves beyond a prior area and reacts again | Price can return inside the prior area after a breakout |
| Failed moves | When price attempts one direction but returns back | A failed move can still become choppy instead of clear |
Reaction zones can add context to price-action reading. For a deeper guide to those areas, see support and resistance in forex.
Price Action Questions to Ask
Price action is easier to use when the trader turns observations into questions. The chart should answer what price is doing, where it is reacting, and where the idea fails.
- Market condition: Is price trending, ranging, compressing, or unclear?
- Structure: Are highs and lows rising, falling, or mixed?
- Current swing: Is price moving strongly, slowing, pulling back, or failing to continue?
- Reaction area: Is price near a zone where it has reacted before?
- Candle behavior: Are candles expanding, shrinking, overlapping, or rejecting an area?
- Breakout behavior: Did price break a level, hold beyond it, or return back inside?
- Invalidation: What price behavior would prove the scenario wrong?
These observations become more useful when they can be combined into one clear, conditional scenario.
A Beginner Price Action Workflow
A simple workflow helps beginners avoid reacting to one candle or one movement without enough chart context.
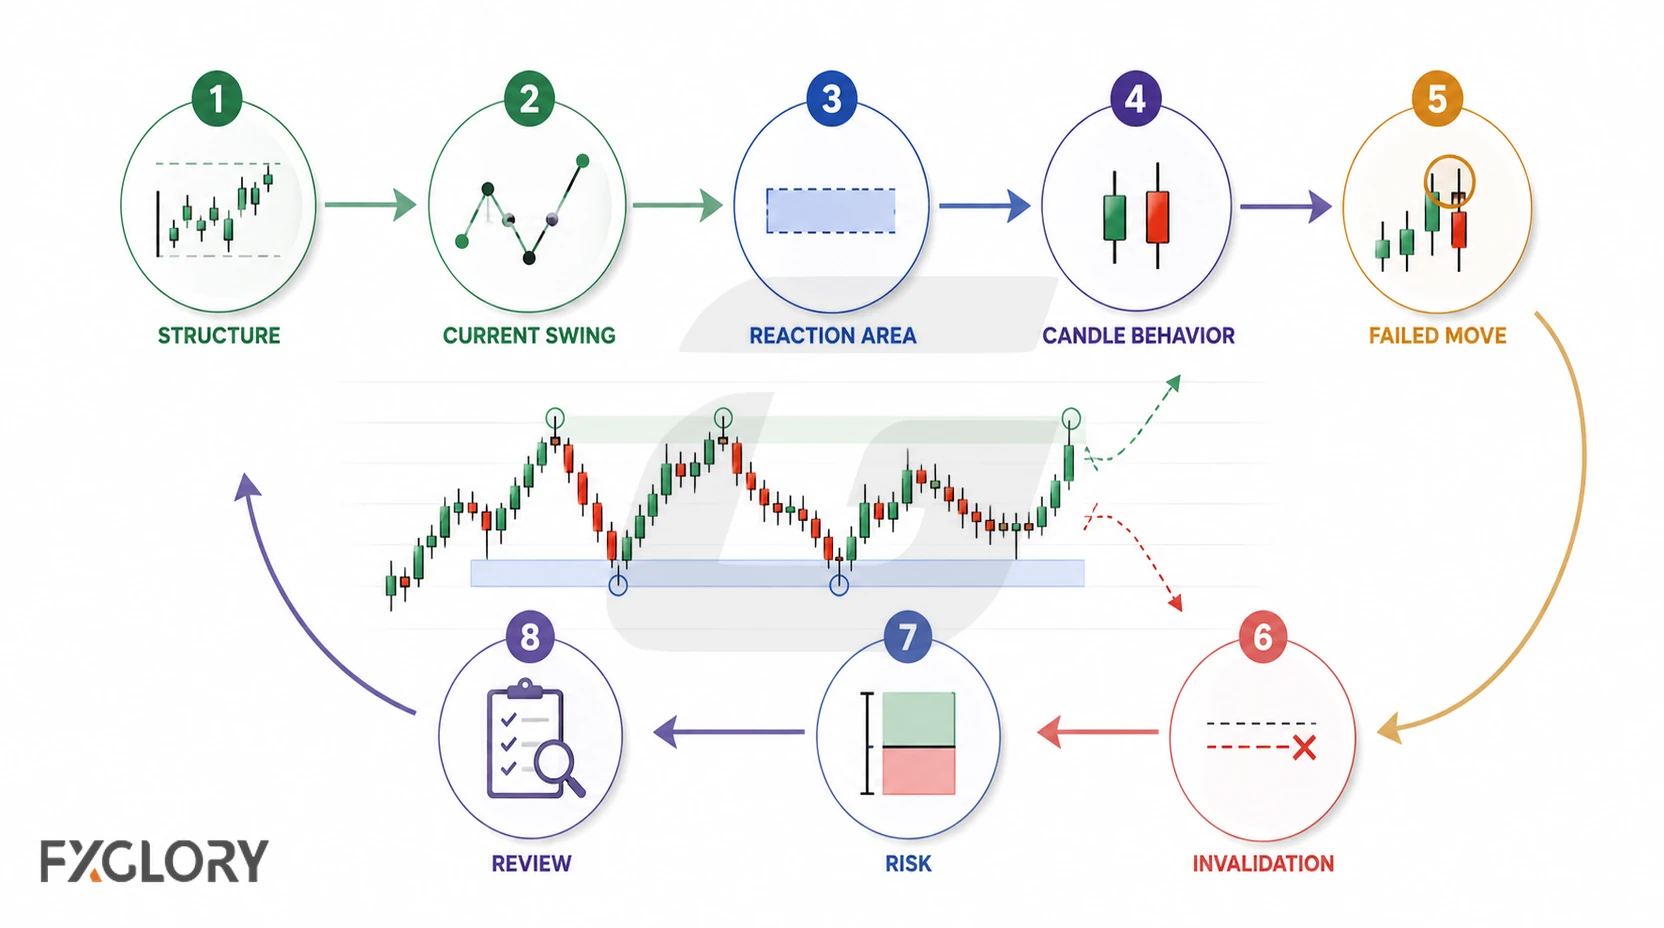
- Read the structure: Check whether highs, lows, and swings show rising, falling, sideways, or unclear movement.
- Locate the current swing: Identify whether price is pushing, pulling back, stalling, or failing to continue.
- Check the reaction area: Look at whether price is near an obvious zone where it has reacted before.
- Read current candle behavior: Watch whether candles show rejection, continuation, compression, or overlap.
- Watch for failed movement: Notice when price breaks or pushes in one direction but returns back.
- Define invalidation: Decide what price behavior would show that the price-action idea is wrong.
- Size the risk: Identify the invalidation level first, measure the distance from a possible entry to that level, then size the position so the potential loss fits the account's chosen risk limit.
- Review the outcome: Compare the original read with what price actually did.
When Price Action Is Not Clear Enough
Price action is not always readable. Some charts are too messy, fast, or compressed to support a clear scenario.
- Overlapping candles: Price keeps moving back and forth without clear direction.
- No visible structure: Highs, lows, and reaction areas are difficult to explain.
- Mid-range noise: Price is between important areas with no clear edge.
- News volatility: Fast movement can overwhelm normal chart structure.
- Quieter trading periods: Price can behave differently when market participation is lower.
- Conflicting timeframes: A short-timeframe idea conflicts with broader structure.
- No invalidation point: The trader cannot explain where the idea is wrong.
Forex Context: Sessions, News, Liquidity, and Pairs
Forex price action should be read with market context because currency pairs trade across global sessions. Price behavior can change during active sessions, quiet periods, session overlaps, and high-impact news.
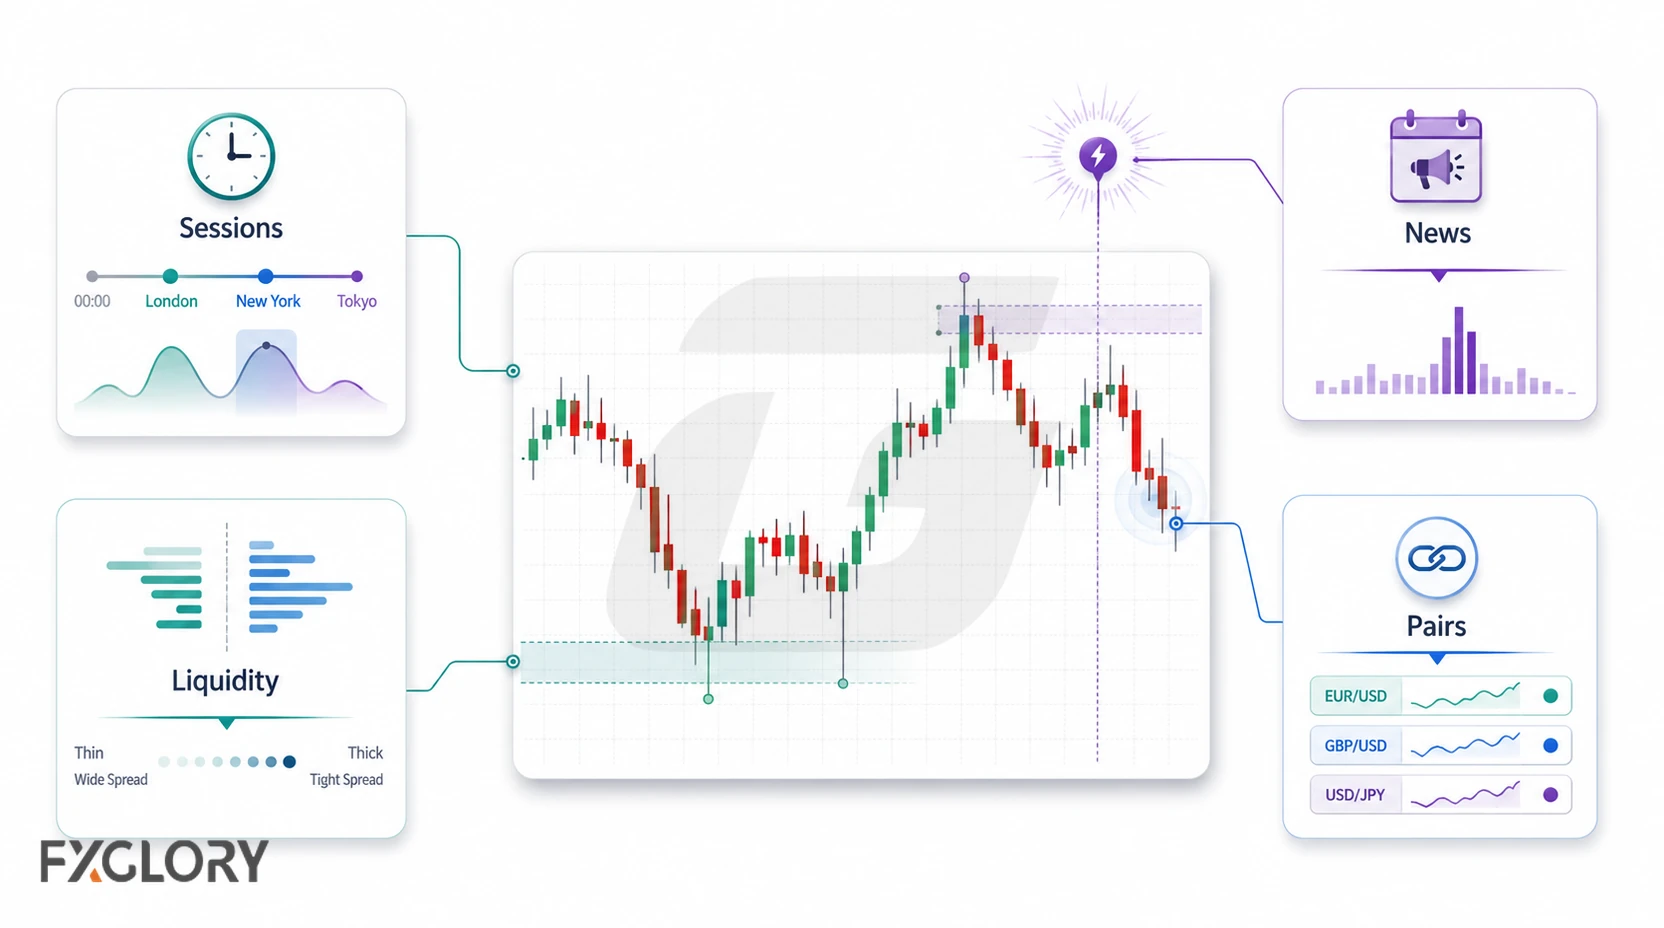
- Session behavior: A move during an active session may carry different context from a move during a quieter trading period.
- News events: Economic releases and central-bank events can quickly change price behavior.
- Spread and slippage: Fast movement can affect entries, exits, and risk control.
- Timeframes: A lower-timeframe move may conflict with higher-timeframe structure.
- Pair behavior: Different currency pairs can show different volatility and reaction patterns.
For that reason, the same chart formation can carry different context when session activity, news, liquidity conditions, or transaction costs change.
Common Mistakes With Forex Price Action
Price-action mistakes often come from treating one candle, one level, or one move as a complete trading reason.
- Calling every move a setup: Not every rejection, breakout, or pullback creates a usable scenario.
- Ignoring market condition: A price-action idea needs different context in a trend, range, or unclear market.
- Focusing only on candles: Candle behavior matters, but structure and location matter too.
- Drawing too many levels: Marking every minor turn can make the underlying structure and more important reaction areas harder to interpret.
- Undefined confirmation: The trader acts without clear rules for what would confirm the scenario.
- Ignoring news and liquidity: Fast or thin conditions can distort normal price behavior.
- No invalidation: The trader cannot explain where the price-action idea is wrong.
Example: Reading Price Action on EUR/USD
Suppose EUR/USD is making higher highs and higher lows on the timeframe being studied. A beginner may describe that as rising structure.
If price then slows near a previous reaction area, the trader may watch how price behaves there. Large rejection candles, overlapping candles, a failed breakout, or a clean break and retest may each create a different scenario.
Before turning those observations into a trade plan, define the condition that would confirm the scenario, the price behavior that would invalidate it, and a position size consistent with the chosen risk limit.
A Practical Way to Use Price Action in Forex
Price action organizes what the chart is currently showing through structure, swings, reactions, candle behavior, breakouts, and failed moves. Its value comes from connecting those observations into conditional scenarios rather than treating an isolated candle or pattern as a complete setup.
A complete price-action plan needs clear conditions and a position size that keeps the potential loss within the chosen risk limit. When the structure is unclear, the scenario can remain untraded until the conditions become easier to define.