
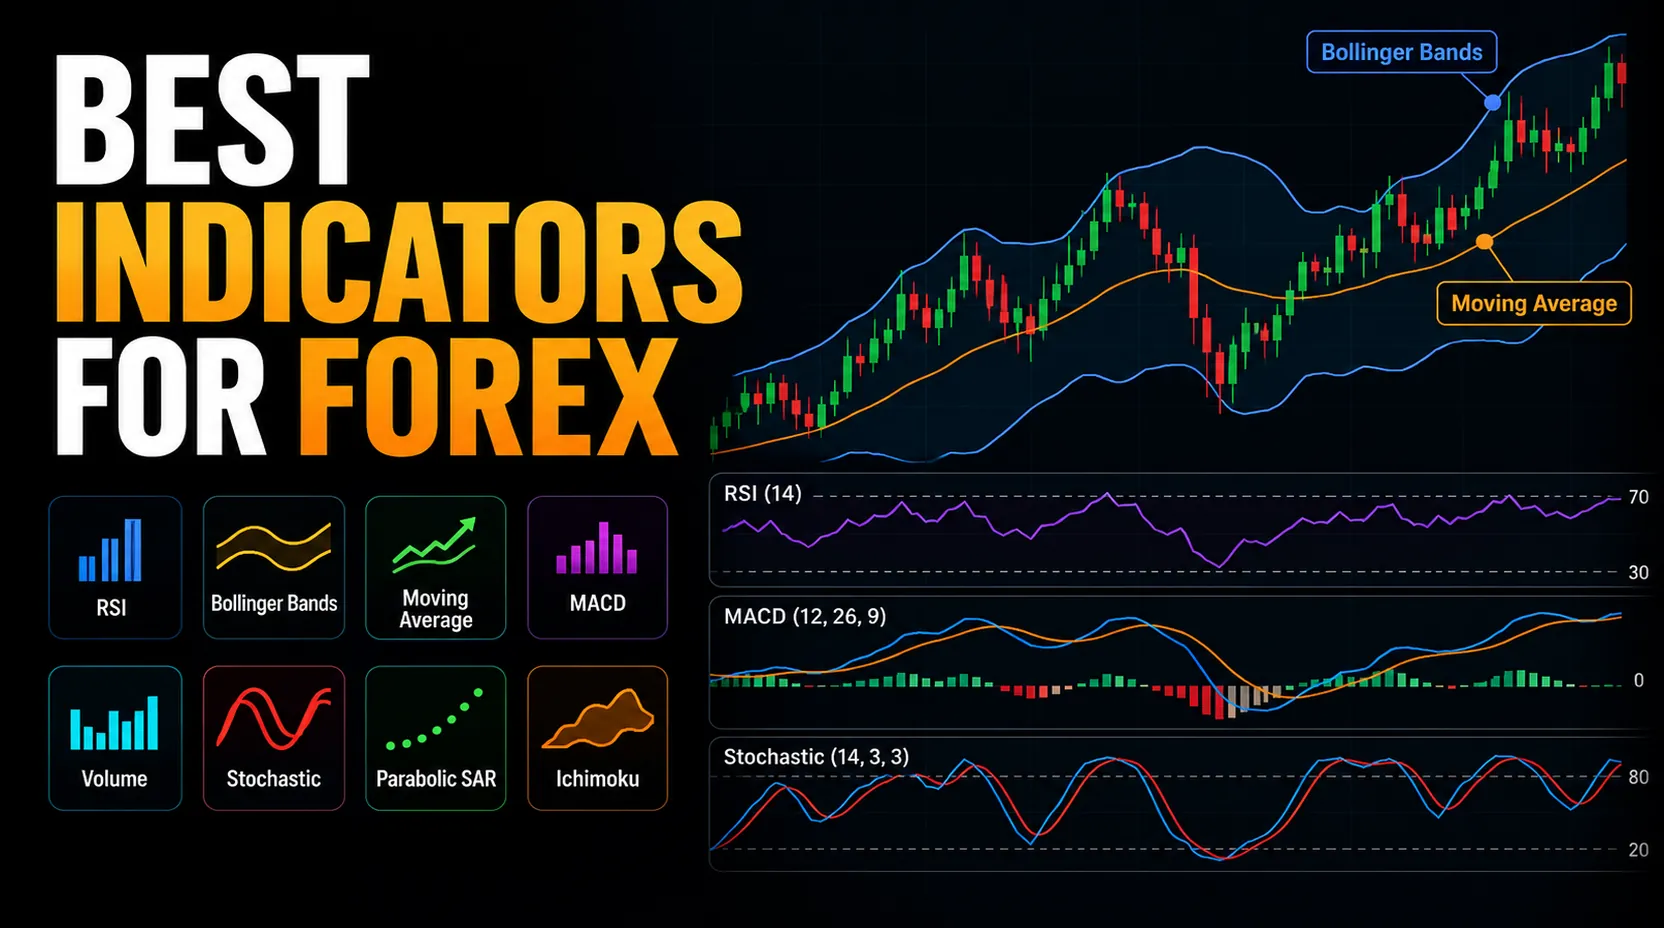
How to Choose the Best Forex Indicator for the Current Chart
The most useful indicator depends on the decision the chart needs to support. Trend direction, range behavior, breakout conditions, momentum, and volatility are different questions, so they often call for different tools.
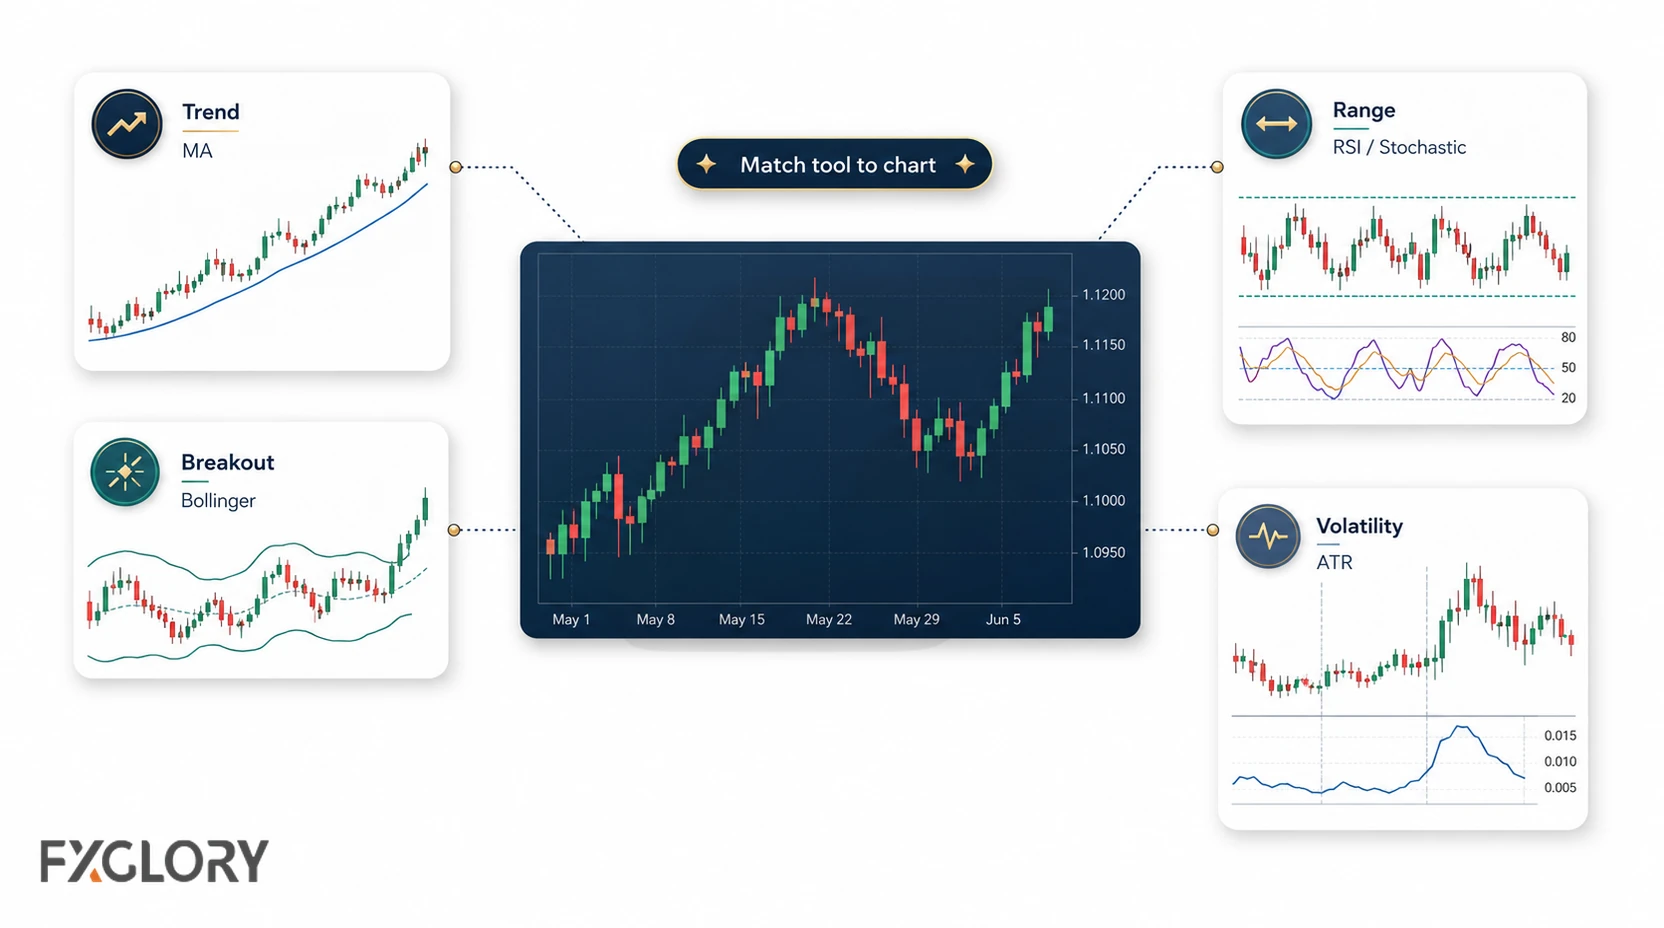
If the question is direction, a trend tool may help. If the question is movement size, a volatility tool may help. If the question is momentum pressure, an oscillator may be more useful. The wrong tool can make the chart look busy without making the decision clearer.
For a broader explanation of trend, momentum, volatility, strength, and activity-style tools, see the forex technical indicators guide.
Quick Comparison of Popular Forex Indicators
Use this comparison to match the chart question with the indicator type.
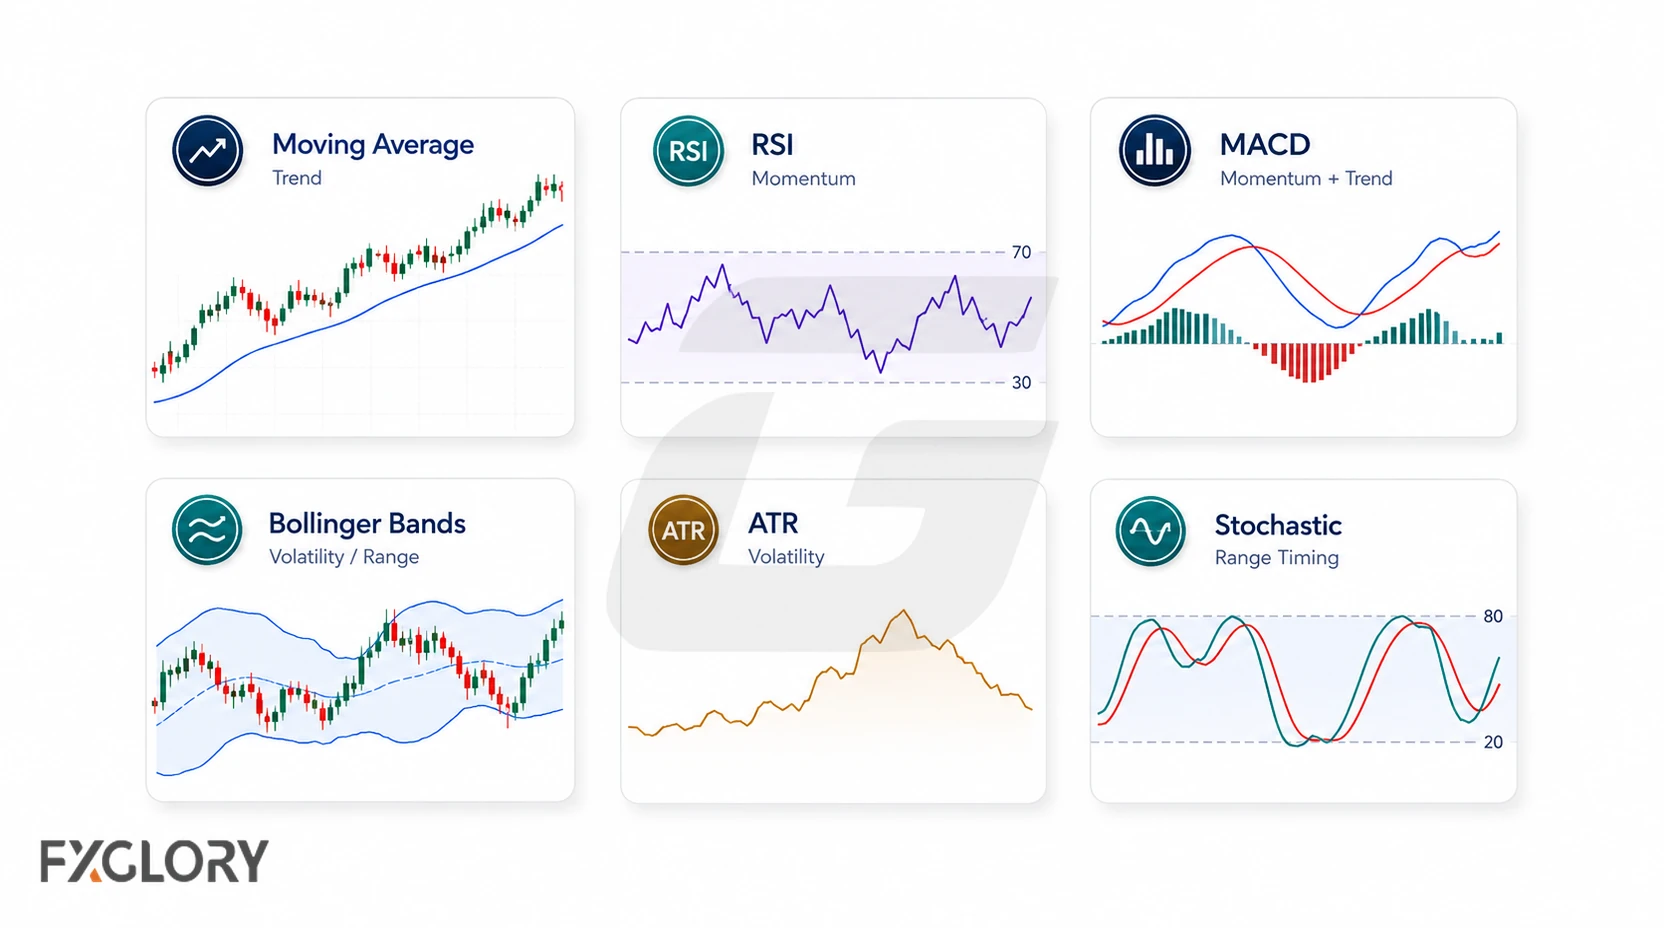
- Moving Average: Commonly used for trend context. It can provide a smoother direction reference, but becomes less informative when price repeatedly crosses a flat average.
- RSI: Commonly used to review momentum pressure. It can add context near a range edge, pullback area, or reaction zone, but strong trends can keep RSI stretched for extended periods.
- MACD: Commonly used to review the relationship between trend and momentum. Repeated crossovers in sideways conditions can make it less useful.
- ATR: Commonly used to measure recent volatility. It can help assess movement size and stop-distance pressure, but it does not indicate direction.
- ADX: Commonly used to assess trend strength. It can help distinguish stronger directional movement from quieter conditions, but ADX does not show direction by itself.
- Bollinger Bands: Commonly used to review volatility and range behavior. They can show expansion, contraction, and price position relative to the bands, but a band touch is not a complete signal by itself.
- Stochastic: Commonly used to review momentum in ranging conditions. In strong trends it can remain stretched or produce repeated counter-trend readings.
- CCI: Commonly used to review deviation from a typical price and momentum swings. Noisy charts can produce frequent readings that need additional price context.
Other Popular Technical Tools Traders Compare
Some traders also compare broader technical tools with standard indicators. These tools should still be matched to the chart question instead of being treated as complete signals.
- Ichimoku Cloud: Useful for trend context, momentum, and support/resistance-style structure. Use carefully when the chart is too crowded or the trader cannot explain each line's role. Related guide: Ichimoku Forex.
- Fibonacci Retracement: Useful for pullback and retracement planning. Use carefully when the levels are used without price confirmation or structure. Related guide: Fibonacci in Forex Trading.
- Pivot Points: Useful for session reference levels and possible reaction zones. Use carefully when the levels are treated as automatic reversal points. Related context: support and resistance zones.
- Parabolic SAR: Useful as a trailing reference and directional review. Use carefully when the market is sideways and the dots flip repeatedly. Related context: forex trend context.
Best Indicators by Market Condition
The useful indicator often changes when the market condition changes. A trend-following indicator can become confusing in a range. A range oscillator can become misleading when the market trends strongly.
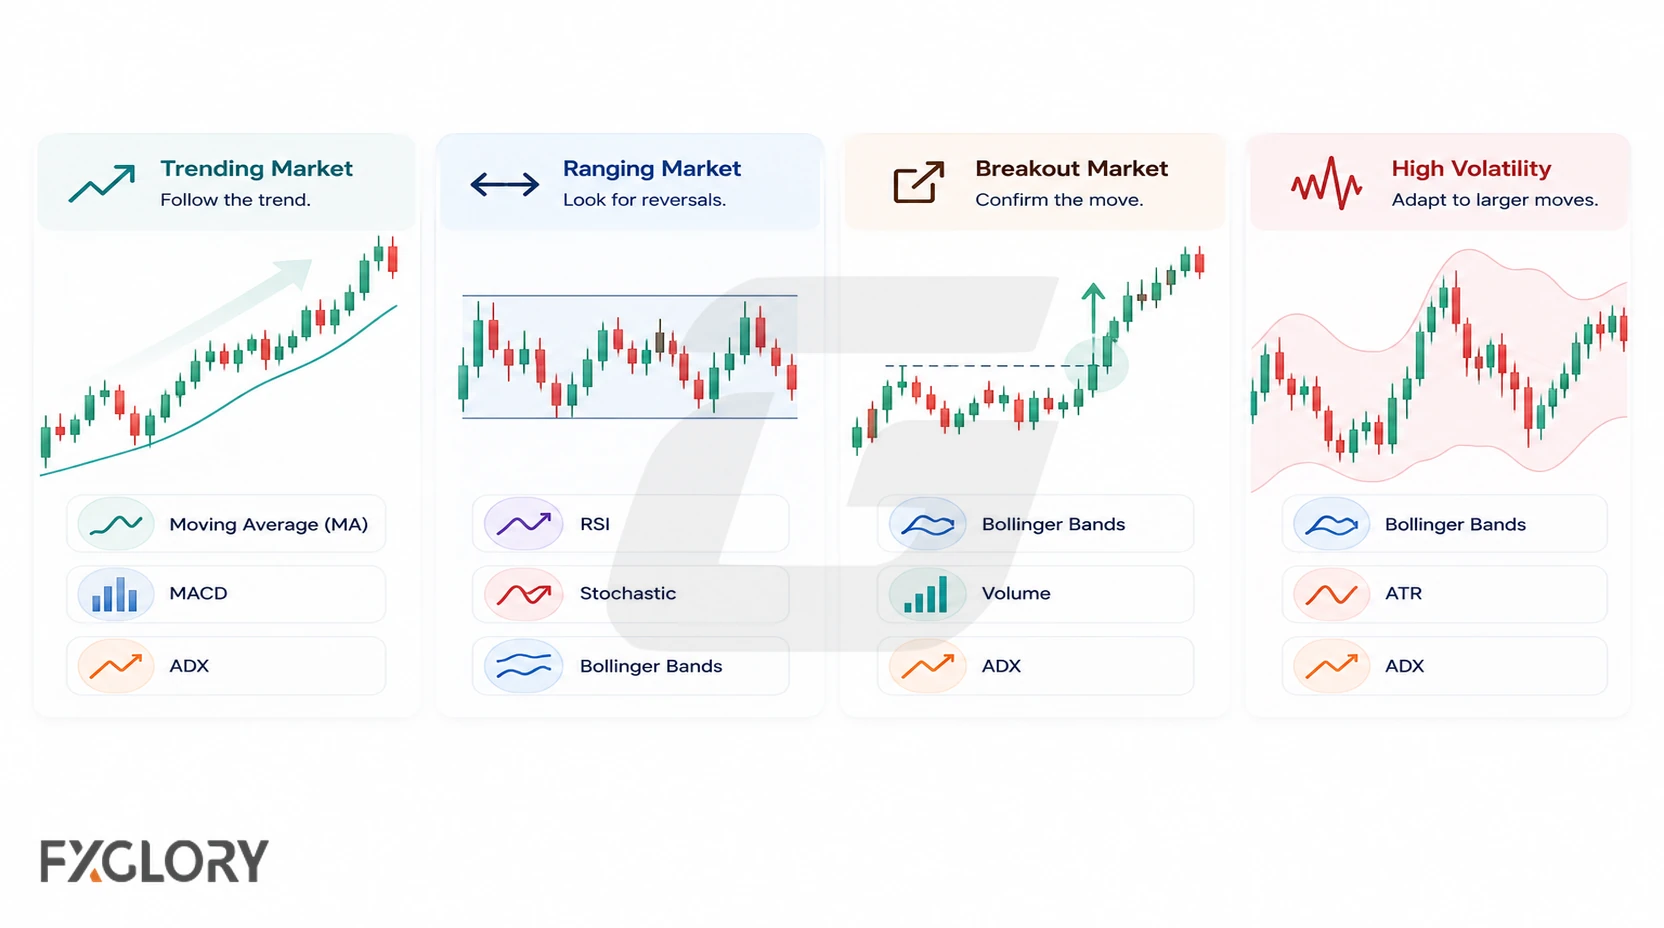
- Clear trend: Consider Moving Average, MACD, ADX, or Alligator to review direction, slope, separation, and trend strength.
- Pullback in a trend: Consider Moving Average, RSI, MACD, or CCI to review pullback depth, momentum pressure, and continuation risk.
- Sideways range: Consider RSI, Stochastic, Bollinger Bands, or CCI to review range edges, overextension, and false breaks.
- Compression: Consider Bollinger Bands, ATR, or ADX to review volatility contraction, possible expansion, and movement strength.
- High volatility: Consider ATR, Bollinger Bands, or Average Daily Range to review movement size, range expansion, and stop-distance pressure.
- Divergence review: Consider RSI, MACD, Stochastic, or CCI to review price and momentum disagreement near a meaningful chart level.
- Unclear or choppy market: Consider ADX, ATR, and price structure to decide whether standing aside is better than forcing a signal.
When the chart condition is unclear, an indicator should not be used to invent confidence. Review forex market structure, support and resistance zones, and price action in forex before relying on the indicator reading.
Best 3 Forex Indicators for Beginners
A beginner-friendly chart does not need many indicators. A simple setup can use one tool for direction, one for momentum, and one for volatility.
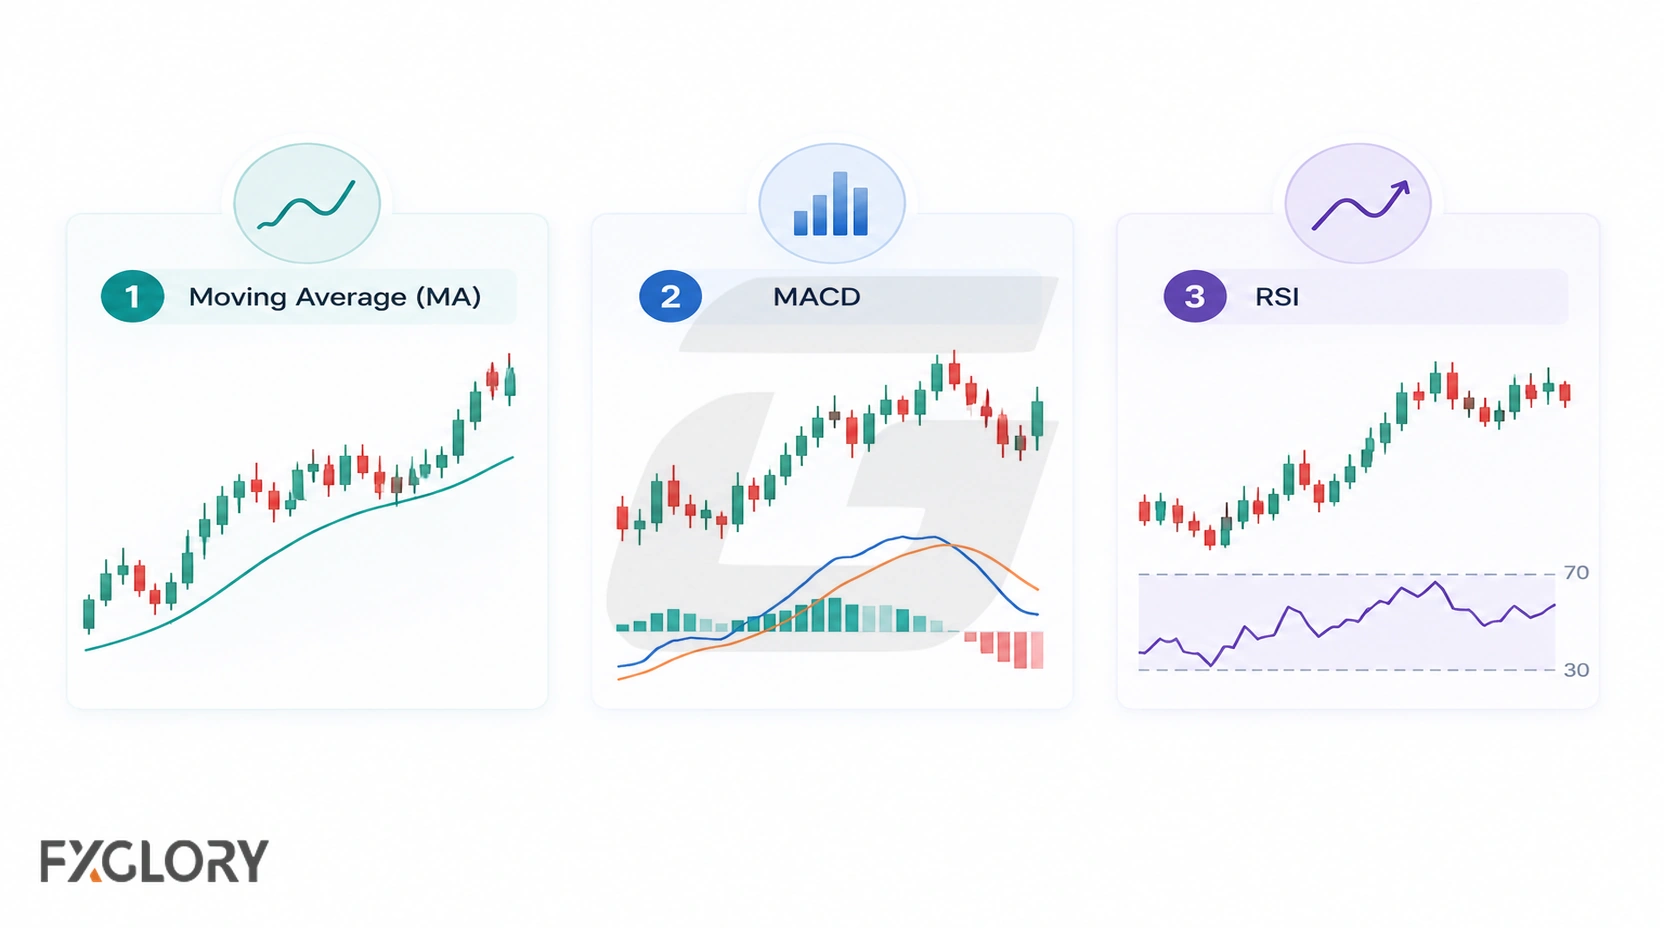
- Moving Average for direction: The moving average can help smooth price and show whether price is generally above, below, or crossing the selected average.
- RSI for momentum pressure: RSI can help review whether movement appears stretched, weakening, or shifting around a watched level.
- ATR for movement size: ATR can help describe recent volatility before the trader decides whether the distance to invalidation is practical.
Indicator Sets for Trend, Range, Breakout, and Volatility Checks
Indicator combinations are most useful when each tool has a different job. Pairing several indicators that measure similar inputs can create duplicate signals without adding much information.
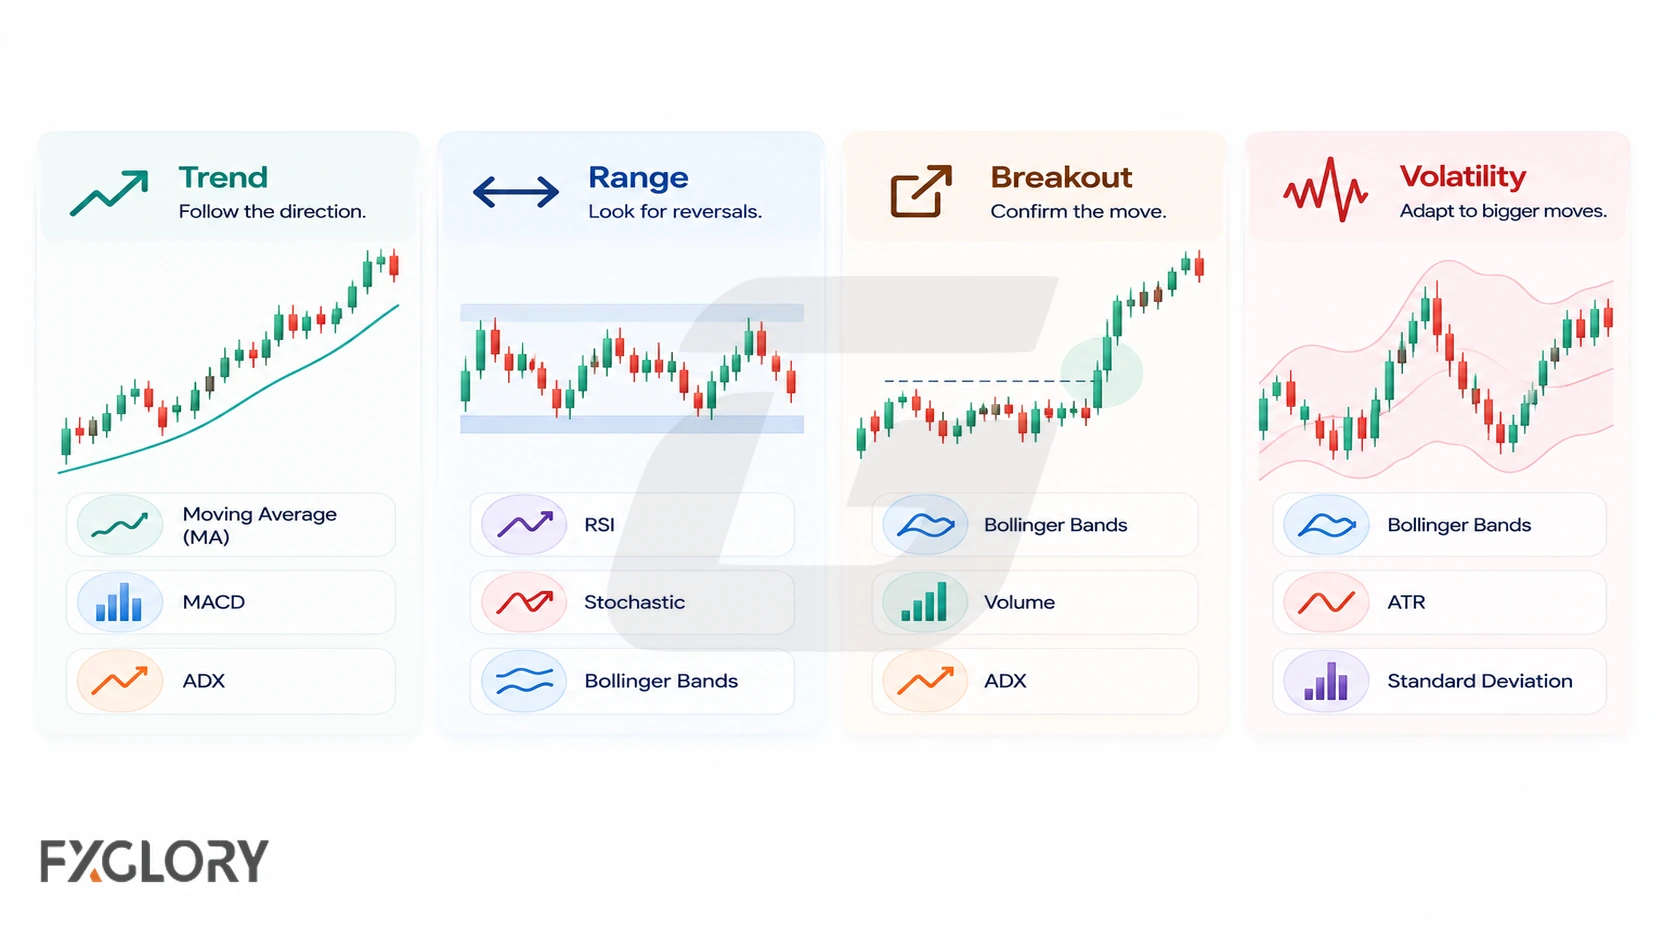
- Beginner chart review: Moving Average + RSI + ATR can help review direction, momentum, and movement size.
- Trend confirmation: Moving Average + ADX can help review direction and strength. ADX does not show direction by itself.
- Momentum shift review: RSI + MACD can help compare momentum pressure with a moving-average relationship.
- Breakout planning: Bollinger Bands + ATR + ADX can help review compression, volatility change, and strength.
- Range review: RSI + Stochastic + Support/Resistance can help review momentum near visible reaction zones.
- Divergence review: MACD or RSI + Market Structure can help review momentum disagreement beside swing evidence.
If two indicators always say the same thing, one of them may be unnecessary. If the chart becomes harder to read after adding a tool, the tool is not helping enough.
Why Indicators Still Need Price Action
Indicators are calculated from market data, so their readings are easier to interpret when they are anchored to visible chart structure. A momentum reading, for example, can mean something different near support, resistance, a swing point, or a breakout area than it does in the middle of an unclear range.
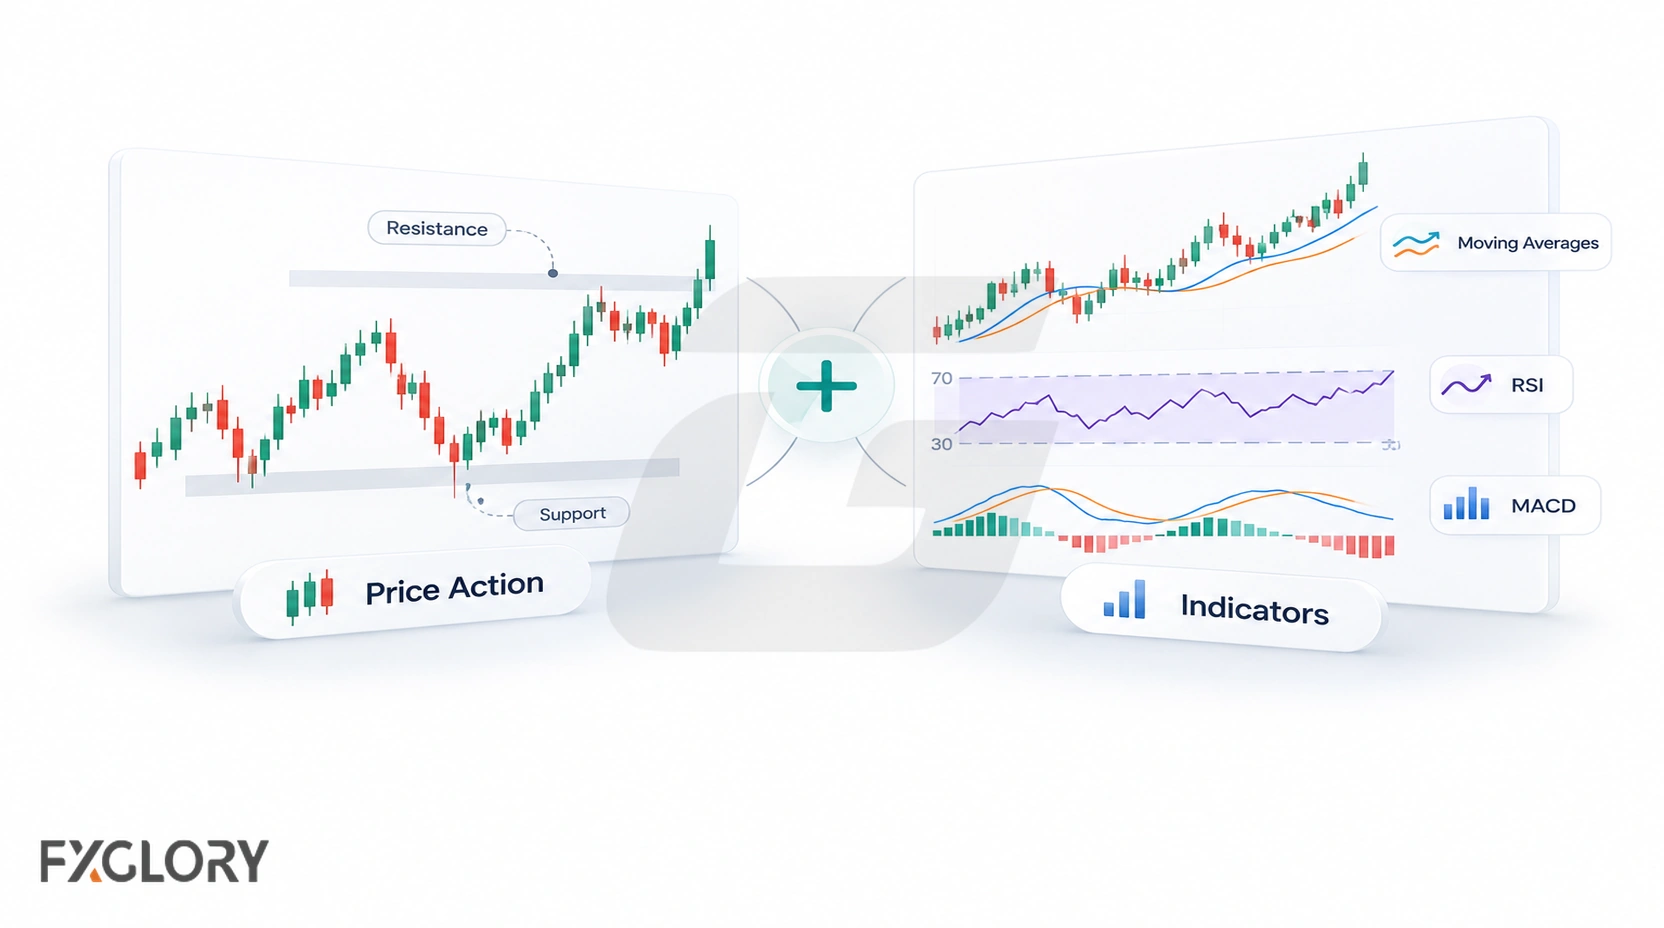
This is why an indicator should usually be checked beside price behavior. A moving average may describe direction, but forex trend context shows whether the move is structured or messy. RSI may show pressure, but support and resistance zones can show where that pressure is appearing. MACD or RSI may show divergence, but market structure helps check whether price has actually changed behavior.
Live Market Examples: Matching Indicators to Chart Questions
Start by identifying the chart question, then choose only the indicators that help answer it.
- GBP/USD live chart: If the chart question is whether movement is trending, ranging, or unclear, Moving Average, ADX, and RSI may help. Stand aside when price is choppy and no clear invalidation is visible.
- Gold live chart: If the chart question is whether volatility is expanding or contracting, ATR, Bollinger Bands, and Average Daily Range may help. Stand aside when movement size makes the risk distance impractical.
- BTC/USD live chart: If the chart question is whether movement is too wide or unstable for the plan, ATR, Bollinger Bands, and volatility review may help. Stand aside when fast movement, spread, or execution conditions overpower the setup.
When reviewing BTC/USD, volatility and compression checks may be useful because crypto price movement can change quickly. The indicator should help organize the chart question, not replace the trading plan.
When Popular Forex Indicators Become Weak
The list below is the skip-check for this page. It shows when a popular indicator should lose priority in the selection process.
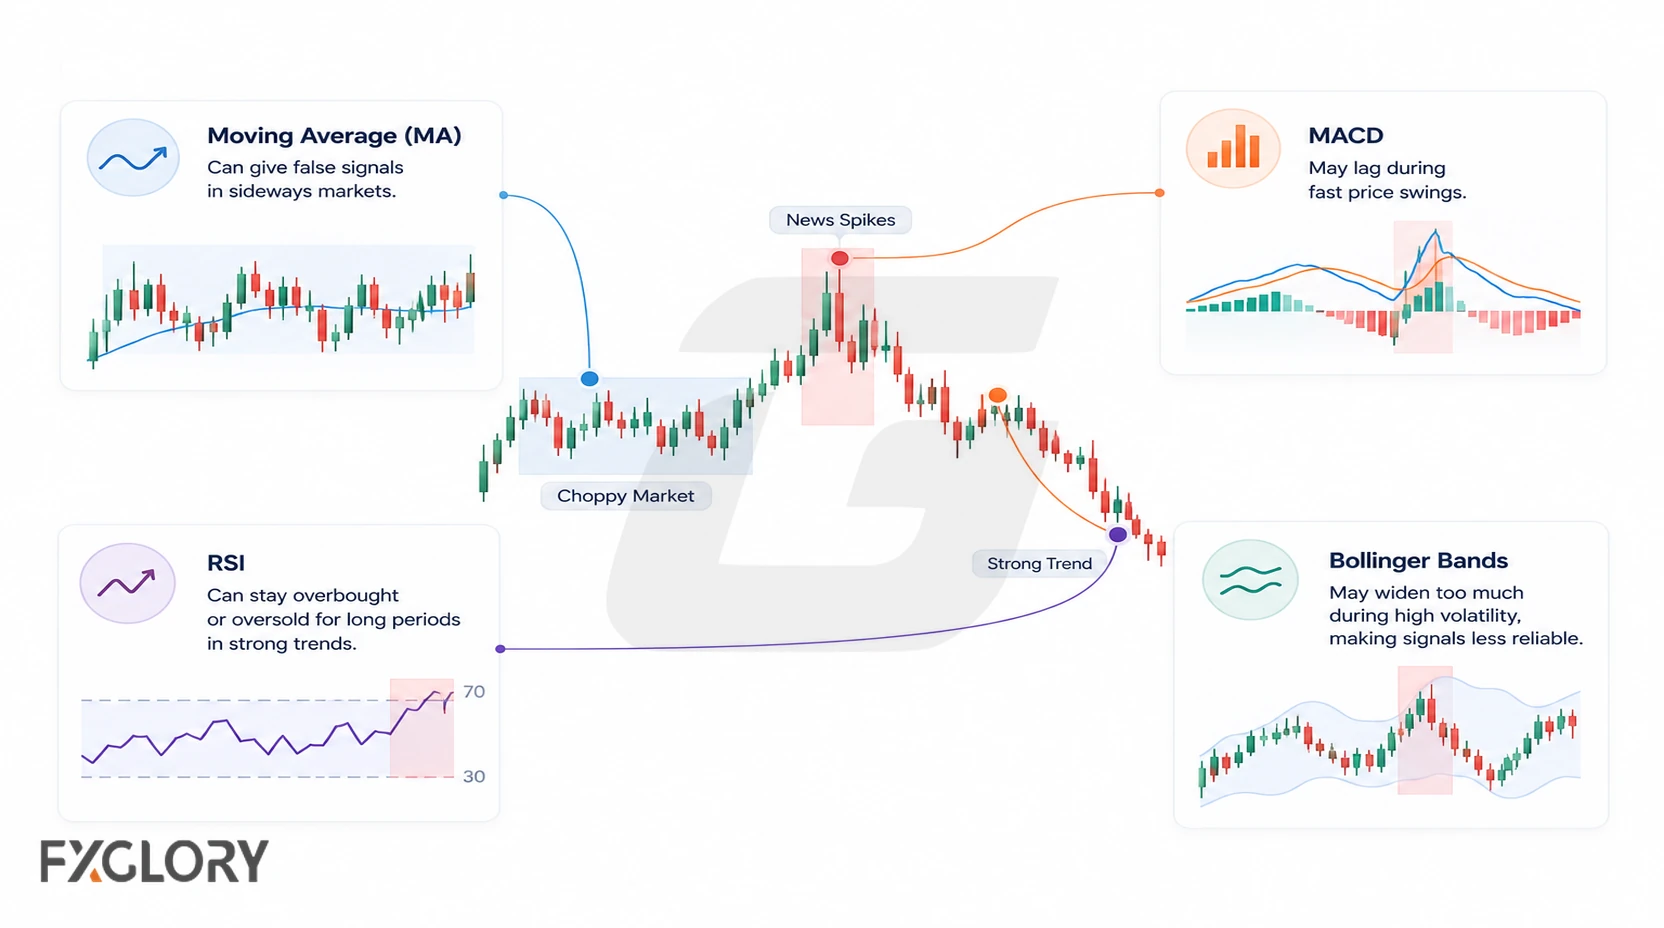
- Moving Average: Reduce trust when price repeatedly crosses the average and the slope is unclear.
- RSI: Reduce trust when RSI stays stretched and price keeps moving in the same direction.
- MACD: Reduce trust when crossovers repeat without price leaving a clear structure.
- ATR: Do not use ATR to predict direction; it describes movement size.
- ADX: Do not treat strength as direction.
- Bollinger Bands: Do not treat a band touch as a complete signal without confirmation.
- Stochastic: Reduce trust when the oscillator gives repeated counter-trend signals in a fast trend.
- CCI: Reduce trust when the indicator moves sharply without clear price structure.
- No-invalidation filter: If the trader cannot explain where the idea is wrong, the setup is incomplete.
- Duplicate-signal filter: If several indicators measure the same thing, the chart may look more confirmed than it is.
- Event-risk filter: News, abnormal spreads, fast volatility, thin liquidity, or execution conditions can overpower an indicator setup.
- Overload filter: If the chart becomes harder to read, remove tools until each one has a clear job.
For signal-stability questions, review non-repainting forex indicators before relying on any tool that changes its signals after candles close.
How to Test Whether an Indicator Fits a Forex Setup
An indicator should be tested inside one clear condition. Testing it across random charts without separating trends, ranges, volatility, and news conditions can create misleading results.
- Market: Record the pair or asset being reviewed, such as GBP/USD, Gold, or BTC/USD.
- Timeframe: Record the chart period used for the review.
- Market condition: Record whether the chart is trending, ranging, pulling back, compressing, breaking out, highly volatile, or unclear.
- Indicator role: Record whether the tool is used for direction, momentum, volatility, strength, divergence, or risk distance.
- Trigger rule: Record the exact event that would confirm the idea.
- Invalidation rule: Record the price behavior that would make the idea wrong.
- Sample size: Record the number of reviewed examples before judging the indicator.
- Spread and slippage note: Record whether trading costs or execution conditions could affect the setup.
- News-event filter: Record whether high-impact news or abnormal volatility was nearby.
- Rule-change check: Record whether the rule was changed after seeing a losing or unclear example.
- Failure type: Record whether the issue was a late signal, false signal, chop, news volatility, unclear structure, poor risk distance, or curve fitting.
- Review note: Record whether the indicator clarified the decision or added noise.
Custom indicators need extra caution because the trader may not know whether the signal repaints, lags, or changes after the candle closes. For that topic, use the Xmaster Formula forex indicator guide as a caution-focused reference.
A Practical Way to Choose the Best Forex Indicator
Start with the chart condition. Then choose one indicator role. Then define the trigger, invalidation, and risk rule. If the indicator does not make the decision clearer, it should not stay on the chart.
A useful forex indicator does not need to predict everything. Its value comes from supporting one clearly defined part of the analysis.