
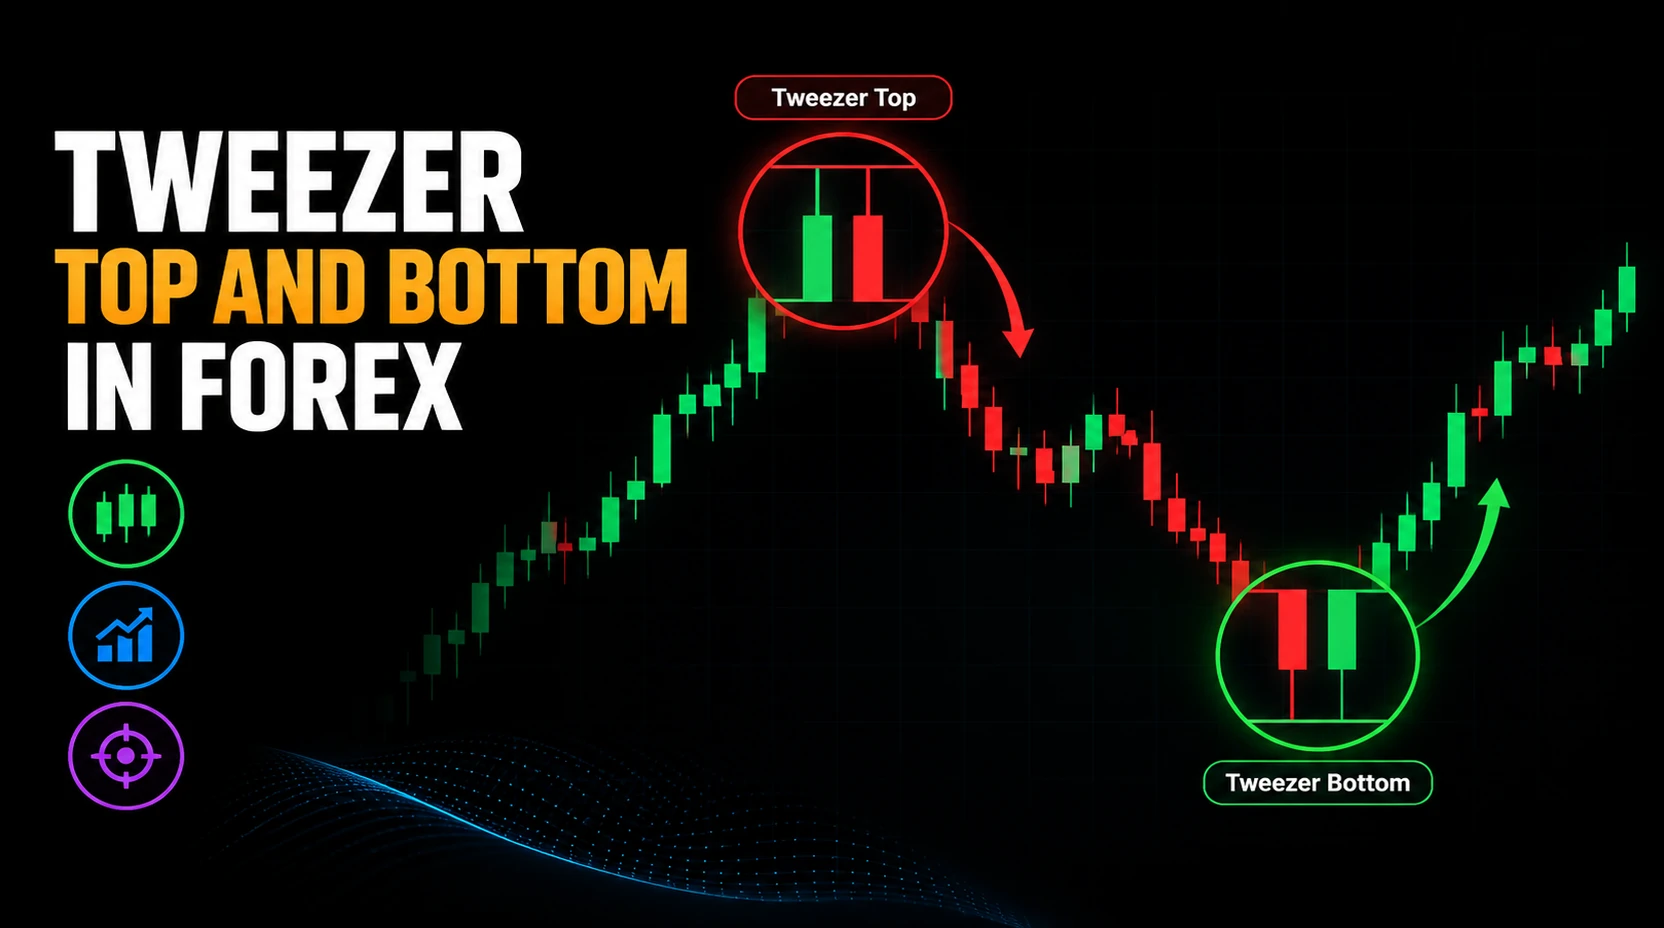
What Are Tweezer Top And Bottom Patterns In Forex?
Tweezer top and bottom forex patterns are formations where price tests nearly the same high or low more than once and fails to continue beyond that area. The main idea is repeated rejection around a similar price level.
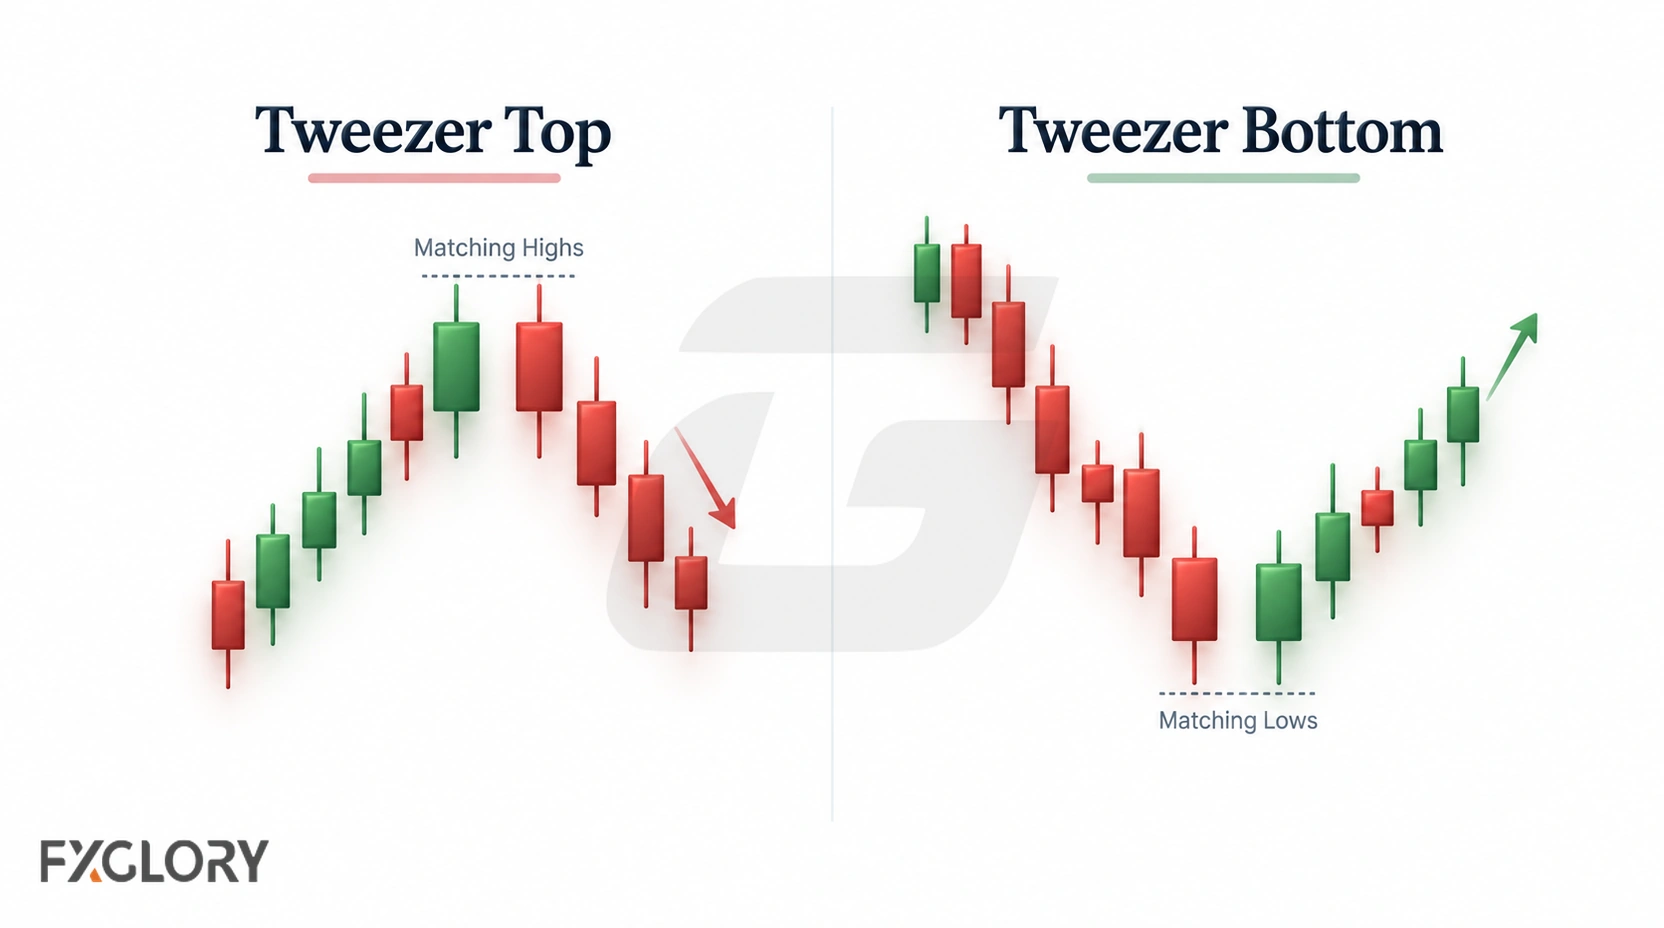
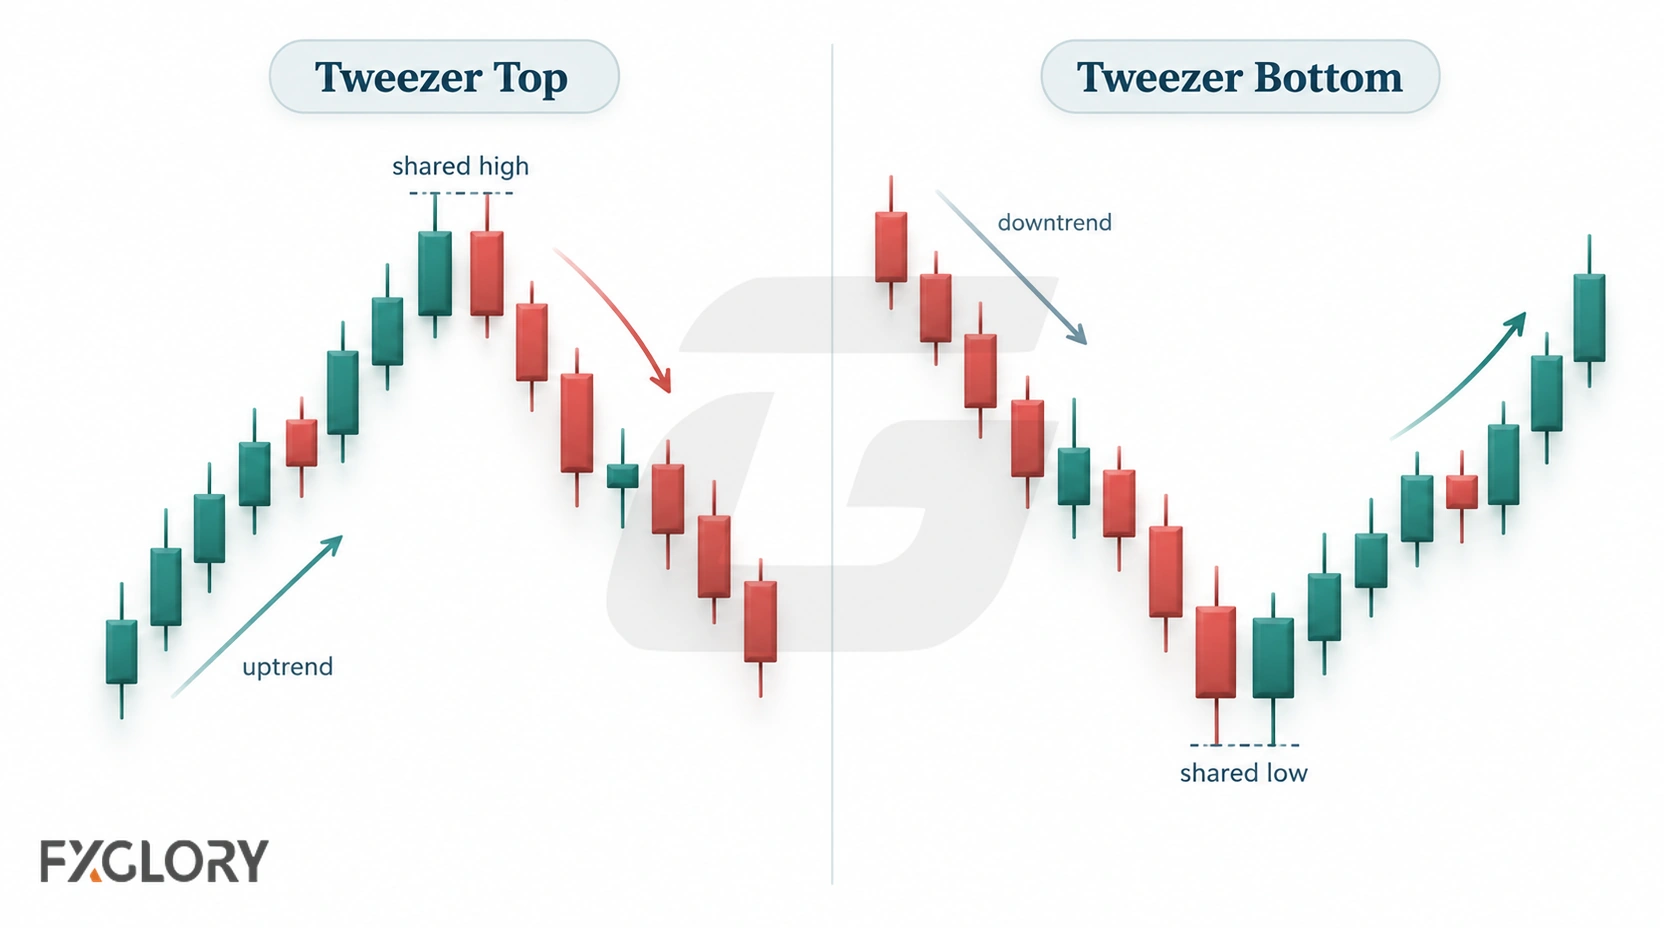
Tweezer patterns usually involve consecutive candles, or candles close enough together that they show the same short-term rejection. If the highs or lows are separated by a much wider chart structure, the idea may belong more to a double top, double bottom, or support and resistance retest.
A tweezer top usually appears after buying pressure, a rise, or a higher-price test. It forms when two or more nearby candles reach the same or nearly the same high and then fail to move clearly beyond that area.
A tweezer bottom usually appears after selling pressure, a decline, or a lower-price test. It forms when two or more nearby candles reach the same or nearly the same low and then fail to move clearly below that area.
A repeated extreme identifies the formation; its location and subsequent price action help determine whether it offers a useful reversal scenario. The two-candle structure can be identifiable before any later reversal confirmation.
If you need the basic candle parts first, review the high, low, body, and wick relationship. Tweezer patterns use those same candle parts, but their message depends on repeated rejection at a similar high or low.
Tweezer Top Forex Pattern Anatomy
A tweezer top forex pattern is usually reviewed after buying pressure. The pattern forms when two or more nearby candles reach the same or nearly the same high and fail to continue higher. The repeated high can act as a visible rejection area on the chart.
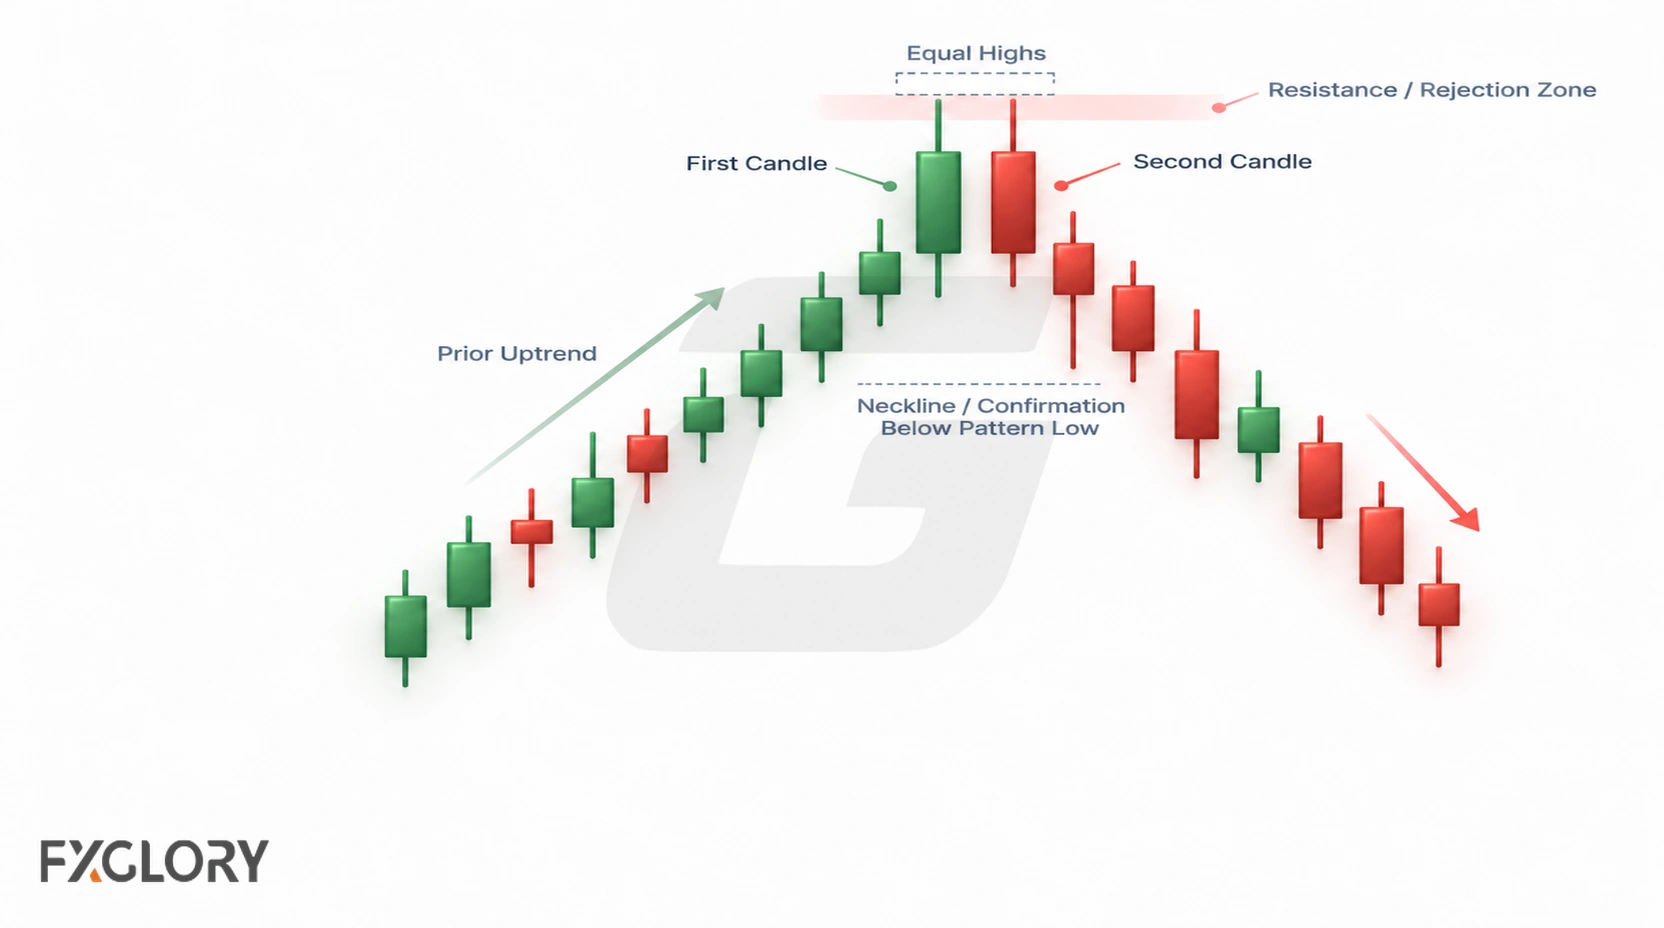
The first candle often reflects the earlier buying pressure. The next candle retests a similar high but does not break through clearly. The important part is not just candle color; it is the repeated failure around the same upper price area.
| Tweezer Top Part | Common Structure | What It Shows | Reading Caution |
|---|---|---|---|
| Prior movement | Buying pressure, rise, or higher-price test. | The market had upward pressure before the repeated high. | Without prior buying pressure, the top label becomes weaker. |
| Matching highs | Two or more nearby candles reach the same or nearly the same high. | Price failed around a similar upper level. | If the highs are far apart, the pattern may be forced. |
| Candle extremes | The two candles have similar actual highs, whether those highs are wick tips or body edges with no upper wick. | The repeated extreme defines the conventional tweezer. | Matching body prices alone do not qualify if candle extremes are different. |
| Second candle | Often bearish, small-bodied, or rejection-heavy. | The second candle did not continue beyond the high. | A clear rejection adds context, but a long wick or a later reversal is not required for the basic formation. |
| Chart location | Resistance, swing high, or range high. | The pattern has a clearer place on the chart. | A top in random movement may be ordinary noise. |
A cleaner tweezer top usually has a visible prior rise, near-equal highs, rejection around a meaningful upper area, and candles that make the repeated level easy to see. Longer upper wicks can make rejection easier to read, but the full chart context still matters.
Tweezer Bottom Forex Pattern Anatomy
A tweezer bottom forex pattern is usually reviewed after selling pressure. The pattern forms when two or more nearby candles reach the same or nearly the same low and fail to continue lower. The repeated low can act as a visible support or rejection area on the chart.
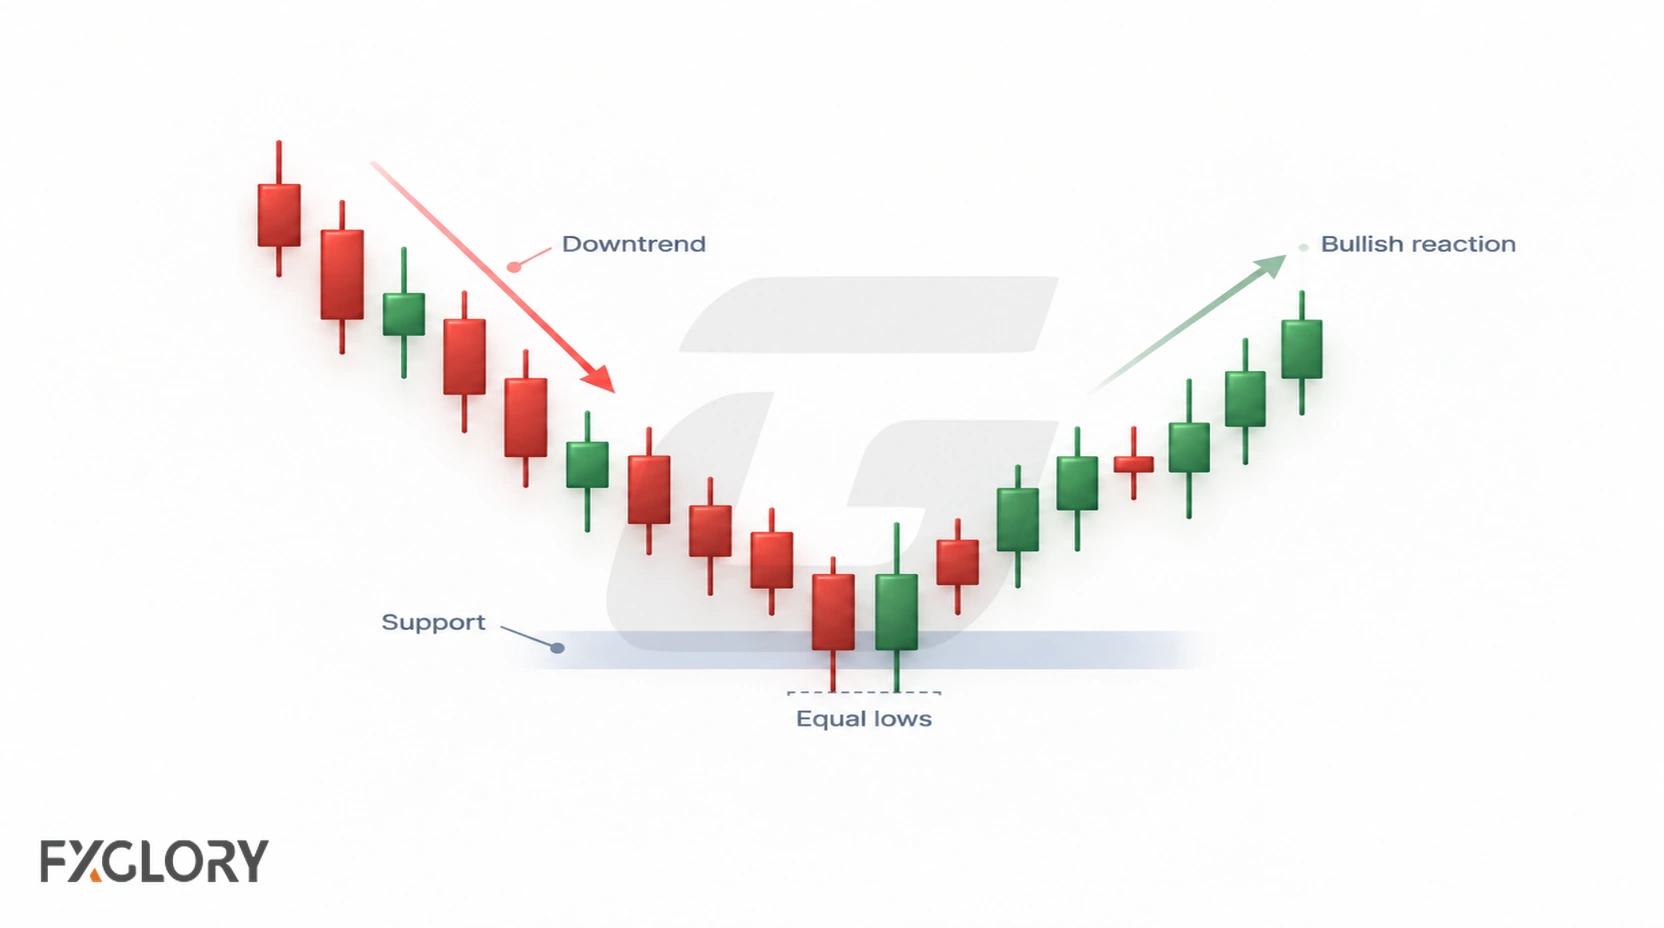
The first candle often reflects the earlier selling pressure. The next candle retests a similar low but does not break through clearly. The important part is the repeated failure around the same lower price area.
| Tweezer Bottom Part | Common Structure | What It Shows | Reading Caution |
|---|---|---|---|
| Prior movement | Selling pressure, decline, or lower-price test. | The market had downward pressure before the repeated low. | Without prior selling pressure, the bottom label becomes weaker. |
| Matching lows | Two or more nearby candles reach the same or nearly the same low. | Price failed around a similar lower level. | If the lows are far apart, the pattern may be forced. |
| Candle extremes | The two candles have similar actual lows, whether those lows are wick tips or body edges with no lower wick. | The repeated extreme defines the conventional tweezer. | Matching body prices alone do not qualify if candle extremes are different. |
| Second candle | Often bullish, small-bodied, or rejection-heavy. | The second candle did not continue below the low. | A clear rejection adds context, but a long wick or a later reversal is not required for the basic formation. |
| Chart location | Support, swing low, or range low. | The pattern has a clearer place on the chart. | A bottom in random movement may be ordinary noise. |
A cleaner tweezer bottom usually has a visible prior decline, near-equal lows, rejection around a meaningful lower area, and candles that make the repeated level easy to see. Longer lower wicks can make rejection easier to read, but the structure still needs useful chart context.
Exact vs Near-Exact Highs And Lows
Tweezer tops and bottoms do not always need perfectly identical highs or lows. In forex, a small difference may still represent the same price area on the selected timeframe; no fixed pip tolerance applies across currency pairs and market conditions.
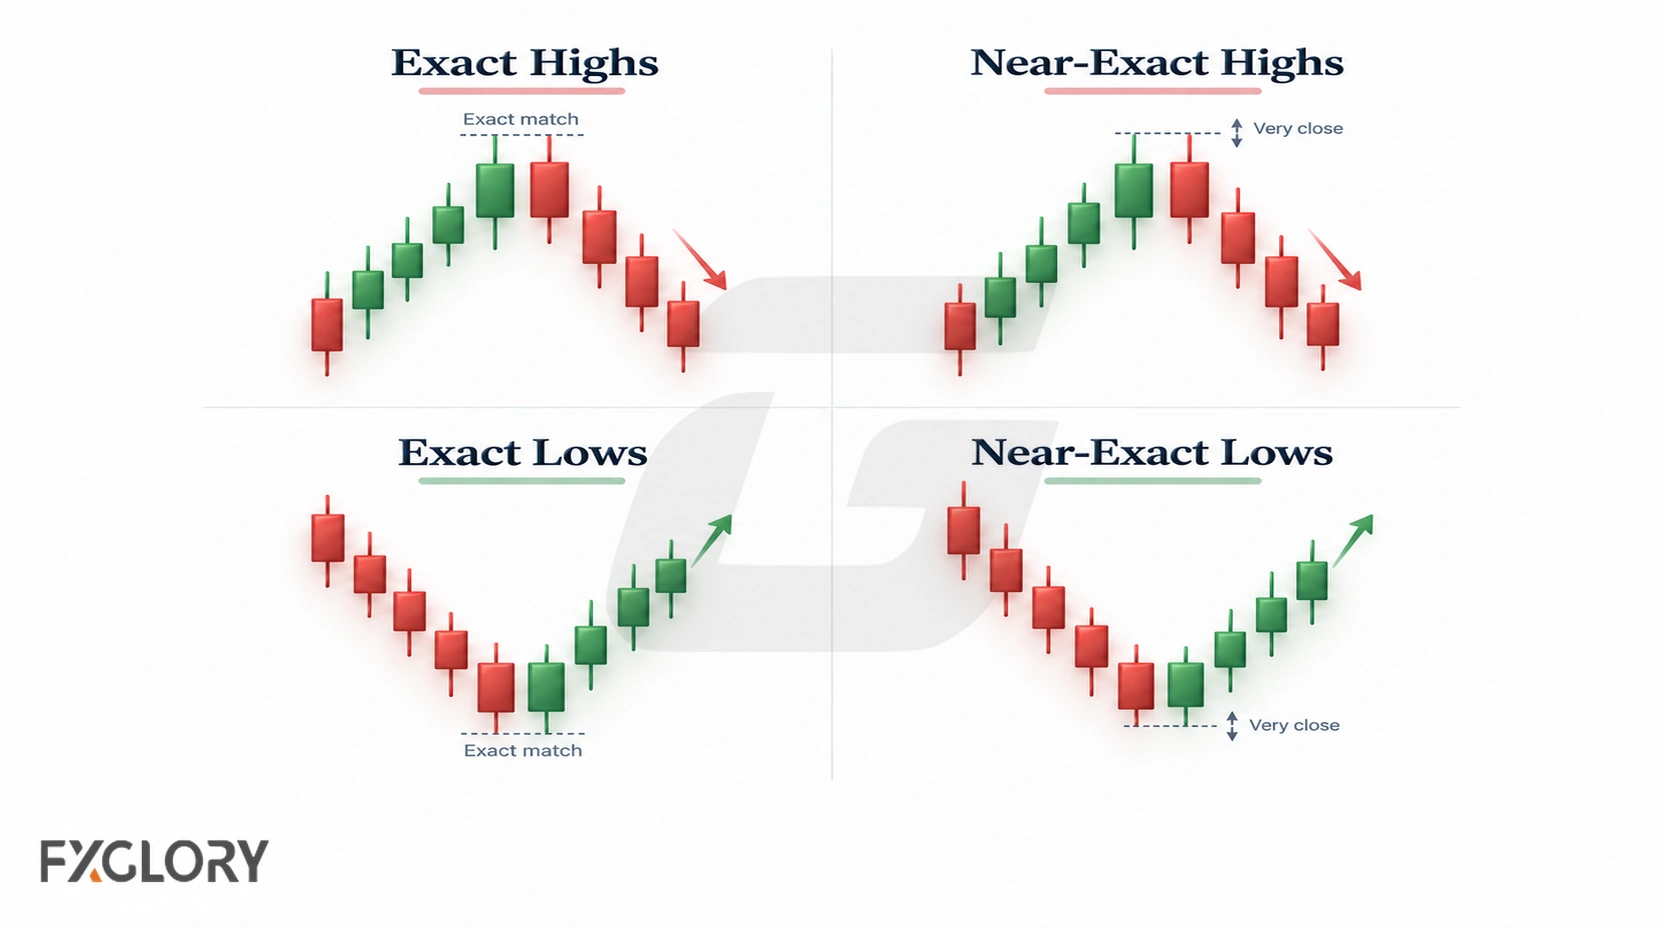
Measure the actual highs for a top or actual lows for a bottom, not just the candle bodies. A loose match should be described as a broader price-zone test instead of a clear tweezer.
A useful habit is to think in terms of a narrow rejection area rather than a single perfect price. That is especially important in forex, where spread, liquidity, platform feed differences, and timeframe selection can slightly change candle extremes.
Wick Rejection vs Body Matching
Tweezer patterns often use matching wicks. A tweezer top may show two upper wicks reaching a similar high. A tweezer bottom may show two lower wicks reaching a similar low. These wick structures can make rejection easier to see because price tested the area and moved away from it.
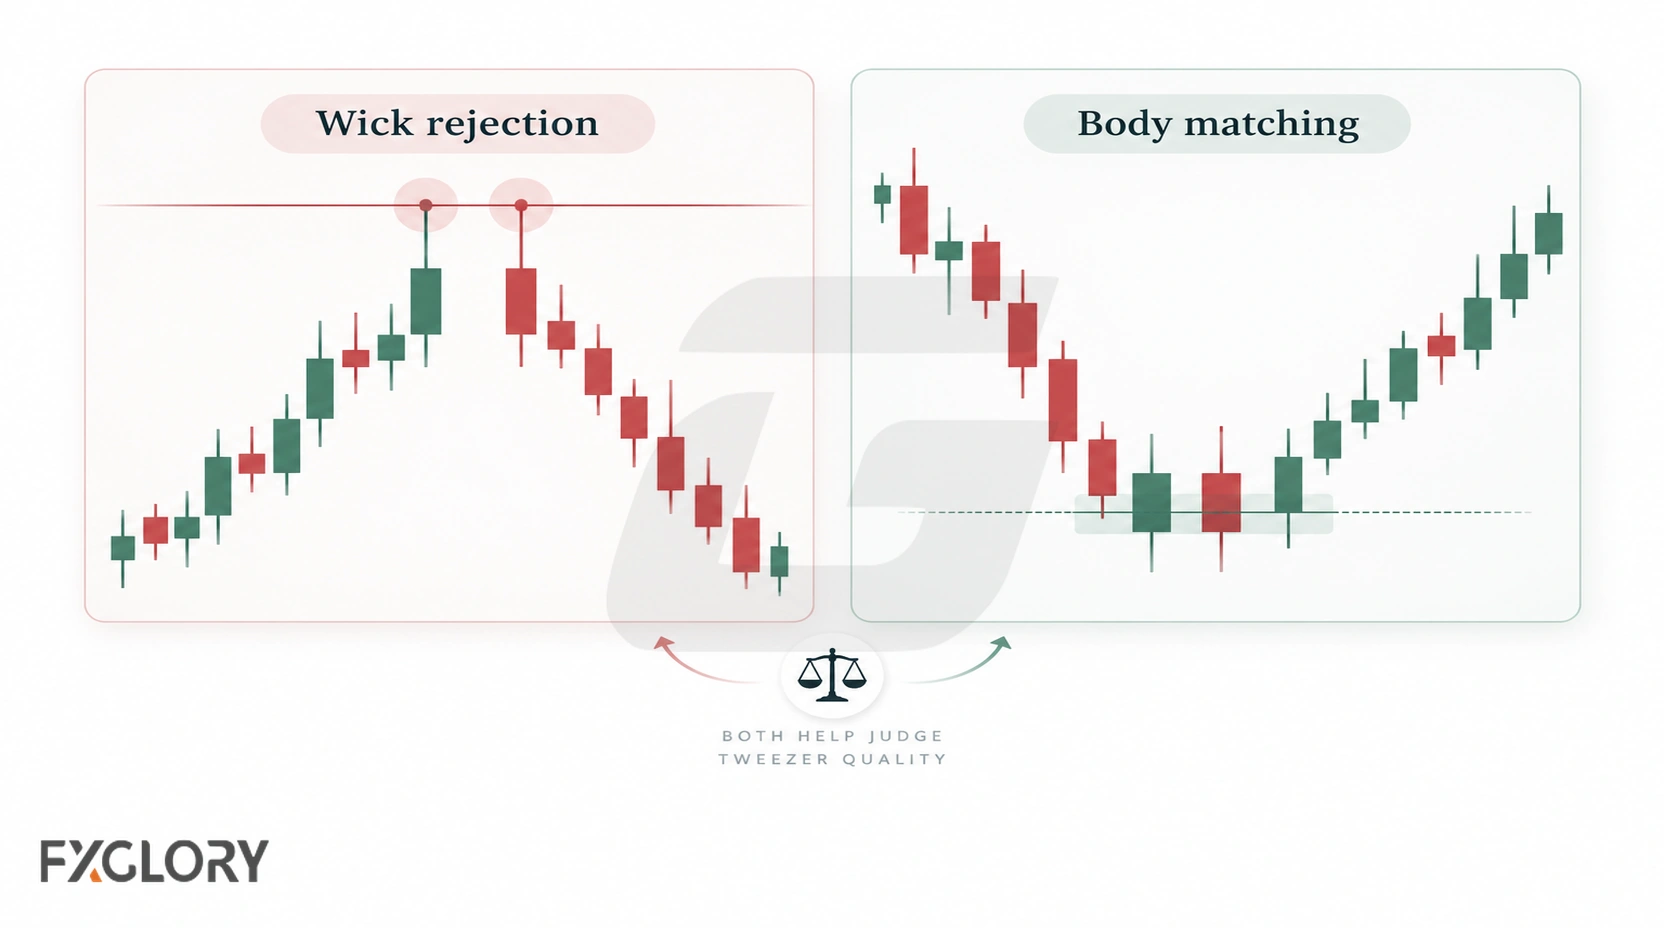
A candle with no upper wick can have its high at the body edge; likewise, a candle with no lower wick can have its low at the body edge. Thus a wick tip on one candle can align with the actual high or low at the body edge of another. Merely matching openings or closings while the candles reach substantially different extremes is not the conventional tweezer criterion.
A pronounced rejection wick can make the interpretation stronger, but it is not a structural requirement. Wait for the second candle to close before judging its final high or low; any later break of a swing level is separate reversal evidence.
| Matching Type | How It Appears | What It May Show | Reading Caution |
|---|---|---|---|
| Wick-to-wick top | Upper wicks reach similar highs. | Repeated upper rejection. | Very small wicks may not show strong rejection. |
| Wick-to-wick bottom | Lower wicks reach similar lows. | Repeated lower rejection. | Very small wicks may not show strong rejection. |
| Body-to-body match | Body edges coincide with actual highs or lows because the candles have no wick on that side. | The candle extremes can genuinely match. | Matching body edges with unequal true highs or lows is not sufficient. |
| Mixed wick and body match | One wick tip matches the other candle’s true high or low at its body edge. | Both candles test the same extreme despite different candle shapes. | Verify the full candle high/low, not only open/close prices. |
Longer rejection wicks can make the repeated high or low easier to interpret. Little or no wick does not automatically invalidate the pattern, but it may make the rejection message less clear.
Why Prior Movement Matters
A tweezer pattern needs something to reject. That is why prior movement matters. A tweezer top is easier to review after buying pressure, a rise, or a higher-price test. A tweezer bottom is easier to review after selling pressure, a decline, or a lower-price test.
A tweezer top or bottom can also appear after a short pullback or bounce inside a broader trend. In that case, the pattern describes rejection around the local high or low, not necessarily a full trend change.
Without prior movement, matching highs or lows may only show ordinary sideways behavior. Inside a range, price can touch similar highs or lows many times without creating a meaningful tweezer reading.
This does not prove that a reversal will happen. It only shows that the market tested a similar price area more than once and did not continue beyond it during the reviewed candles.
Support And Resistance Context
Tweezer patterns are easiest to review when the matching highs or lows appear near a level that already matters on the chart. A tweezer top near resistance can show repeated failure around a higher-price area. A tweezer bottom near support can show repeated failure around a lower-price area.
A matching high near the center of a messy range may be less meaningful than a matching high near a range top. A matching low near the center of a messy range may be less meaningful than a matching low near a range bottom.
Tweezer Top Near Resistance
A tweezer top near resistance can show that price tested a higher area more than once and failed to continue higher during the reviewed candles. The resistance area gives the repeated high a clearer place on the chart.
Tweezer Bottom Near Support
A tweezer bottom near support can show that price tested a lower area more than once and failed to continue lower during the reviewed candles. The support area gives the repeated low a clearer place on the chart.
Range Boundaries
Inside a range, tweezer-like structures near the upper or lower boundary may be easier to review than similar structures in the center of the range. The range boundary gives context to the matching high or low.
For observation, a trader can compare tweezer-like structures on live market pages such as GBP/USD around repeated swing areas or gold during wider candle ranges. These pages are useful for chart review, not as standalone trading reasons.
Tweezer Patterns vs Other Candlestick Formations
| Pattern | Main Focus | Main Difference From Tweezers |
|---|---|---|
| Tweezer top and bottom | Repeated high or repeated low. | The shared level is the main structure. |
| Engulfing candle | Second candle body covers the previous body. | Engulfing is about body takeover, not matching highs or lows. |
| Harami candle | Second body sits inside the first body. | Harami is about inside-body contraction. |
| Piercing pattern | Bullish second candle closes into the first bearish body. | Piercing is about partial bullish body recovery. |
| Dark cloud cover | Bearish second candle closes into the first bullish body. | Dark cloud cover is about partial bearish body pushback. |
For body-relationship patterns, compare the full-body takeover structure, the inside-body contraction pattern, the partial bullish recovery pattern, and the partial bearish pushback pattern.
Tweezer patterns can overlap visually with several other candlestick ideas. Comparing them helps avoid forcing the wrong label onto the chart.
| Pattern Or Candle | Main Structure | Main Difference From Tweezer Patterns |
|---|---|---|
| Tweezer top | Two or more nearby candles with matching or near-matching highs. | Focuses on repeated upper rejection. |
| Tweezer bottom | Two or more nearby candles with matching or near-matching lows. | Focuses on repeated lower rejection. |
| Shooting star | Single candle with small body and long upper wick. | Shooting star is one candle; tweezer top uses repeated highs across nearby candles. |
| Hanging man | Single candle with small body and long lower wick after buying pressure. | Hanging man is one candle; tweezer patterns use repeated levels across nearby candles. |
| Hammer | Single candle with small body and long lower wick after selling pressure. | Hammer is one candle; tweezer bottom uses repeated lows across nearby candles. |
| Morning star | Bearish candle, small middle candle, bullish third candle. | Morning star uses three candles and a middle pause. |
| Evening star | Bullish candle, small middle candle, bearish third candle. | Evening star uses three candles and a middle pause. |
| Double top or bottom | Larger chart formation with separated peaks or troughs. | Double structures usually develop across more chart space than nearby tweezer candles. |
| Three black crows | Three consecutive bearish candles. | Three black crows focuses on a bearish sequence, not matching highs. |
| Three white soldiers | Three consecutive bullish candles. | Three white soldiers focuses on a bullish sequence, not matching lows. |
For single-candle comparisons after buying pressure, review the upper-wick rejection candle and the lower-wick structure after buying pressure. For broader structure, return to the forex candlestick pattern map.
Tweezer Pattern Strength Filter: Stronger vs Weaker Readings
A tweezer pattern does not have the same value in every chart condition. The table below helps separate clearer repeated-level readings from weaker ones.
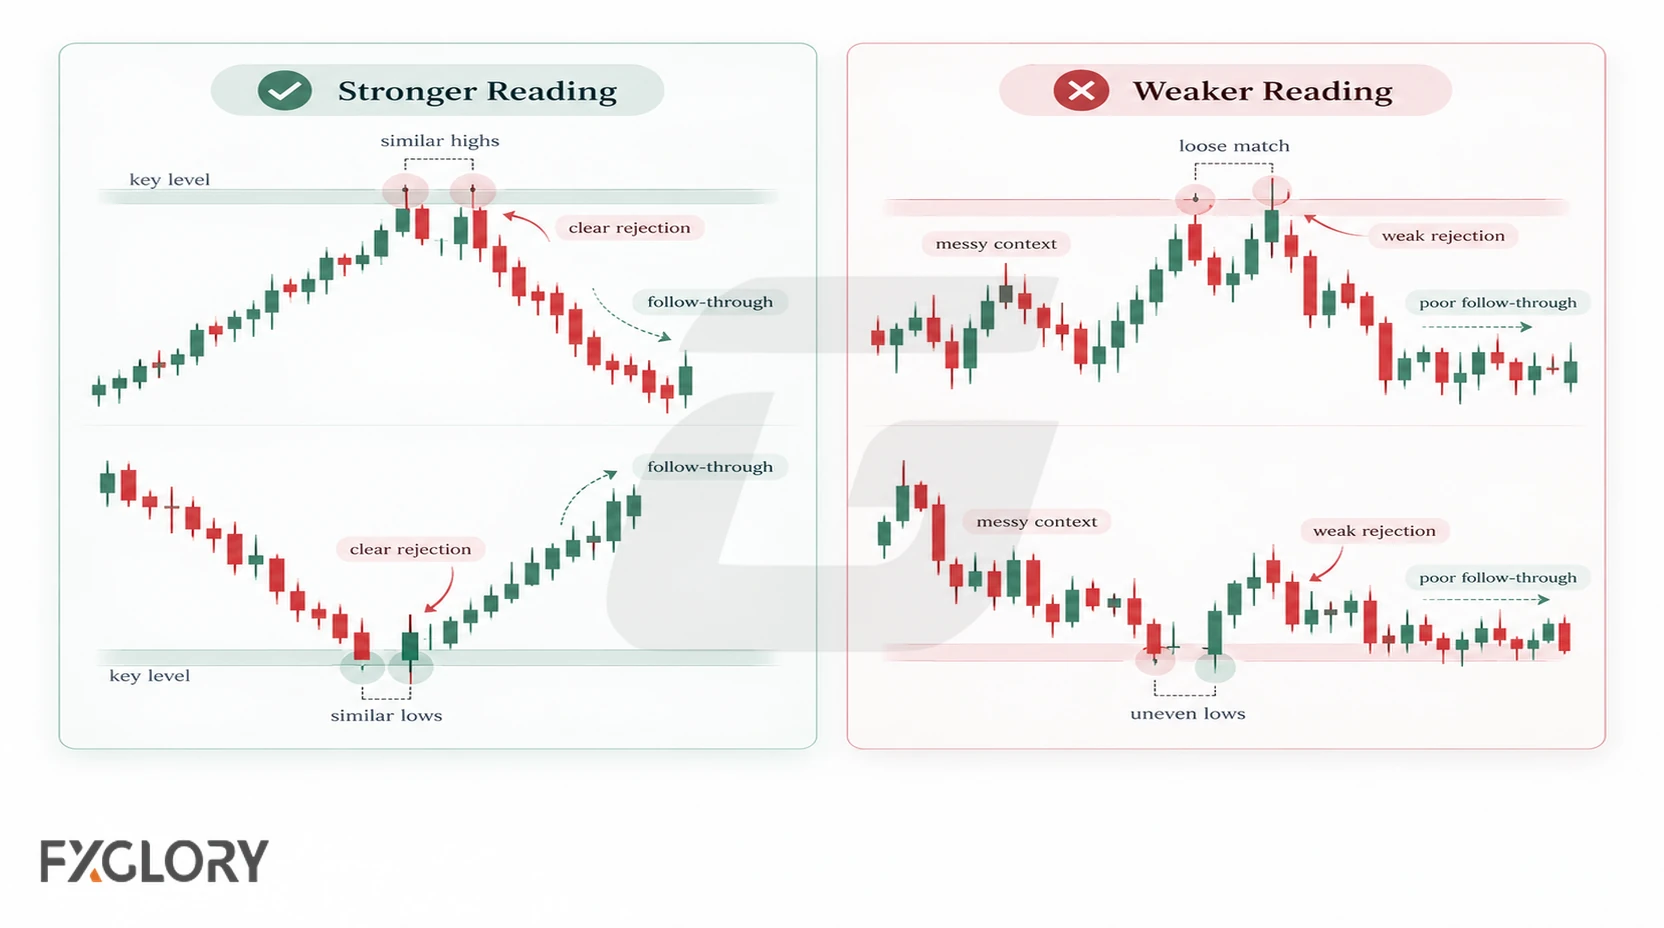
Evaluate formation quality and later follow-through separately. A clearly identified tweezer can still lead to sideways trading or continuation rather than reversal.
| Tweezer Factor | Clearer Reading | Weaker Reading |
|---|---|---|
| Prior movement | The pattern appears after buying pressure for a top or selling pressure for a bottom. | The pattern appears without clear prior movement. |
| Level match | The highs or lows are identical or nearly identical. | The highs or lows are too far apart. |
| Wick behavior | Longer rejection wicks make the level easier to see. | Little or no wick can make rejection less clear. |
| Second-candle reaction | The second candle reacts away from the shared high or low. | The second candle only touches the level without a readable response. |
| Chart location | The pattern forms near resistance, support, a swing point, or a range boundary. | The pattern forms in the middle of random movement. |
| Candle clarity | The candles make the repeated high or low easy to identify. | The candles are messy, overlapping, or hard to compare. |
| Timeframe | The structure is visible on a timeframe that reduces random noise. | Very low timeframes produce frequent tweezer-like overlaps. |
| Market conditions | Spread and volatility conditions are stable enough for chart review. | The pattern forms during abnormal news movement, rollover, or thin liquidity. |
| Later confirmation | Subsequent price action breaks a nearby minor swing in the proposed reversal direction. | Price instead breaks beyond the repeated extreme or remains sideways; this changes the outcome, not the earlier candle geometry. |
How To Read Tweezer Patterns In Forex
A simple workflow helps keep tweezer reading disciplined. The goal is to describe the repeated high or low before giving the structure more meaning than it deserves.
- Identify context: Look for buying pressure before a top or selling pressure before a bottom, and note nearby support or resistance.
- Check completed candle extremes: Compare the actual highs for a top or lows for a bottom on two nearby closed candles.
- Assess the candles: Note wick rejection and candle bodies without treating their alignment as a substitute for matching extremes.
- Classify the formation: Mark the tweezer as identified; do not assume it has confirmed a reversal.
- Watch subsequent price: Use an explicitly chosen follow-through rule, and account separately for spread, news, and execution conditions if considering a trade.
Hypothetical EUR/USD Example: Formation vs Confirmation
Suppose EUR/USD rises into a prior resistance area. The first completed candle reaches 1.08502 and the next reaches 1.08505 before closing lower. Their highs differ by 0.00003 (0.3 pip), so a trader might identify a tweezer top on that chart. This difference is an illustration, not a universal matching threshold.
If a later completed candle closes below a separately identified nearby swing low, a strategy using that rule might classify it as additional bearish confirmation. If price instead rises above the two highs, the expected bearish reaction has not developed. Neither outcome changes what the two original candle highs were.
Some traders compare tweezer patterns with technical indicators for additional context. For example, RSI can add momentum context, MACD can add trend-momentum context, ATR can add volatility context, and Bollinger Bands can help review range and expansion conditions. These tools can support candle review, but they do not remove trading risk.
Some traders also review activity or volume-style tools around the repeated level, but spot forex volume is usually broker/platform-specific and should not be treated as a complete confirmation by itself.
False Tweezer Patterns In Forex
A false tweezer pattern looks like repeated rejection but does not provide a useful chart clue. This can happen because the highs or lows are not clearly close, the chart location is weak, prior movement is missing, or market conditions make the candles hard to interpret.
No Prior Movement
If there was no buying pressure before a tweezer top or no selling pressure before a tweezer bottom, the pattern may be only ordinary candle overlap.
Loose Highs Or Lows
If the highs or lows are not clearly near each other, the tweezer label becomes weak. A few pips may still represent the same area, but a wide difference usually does not.
No Clear Second-Candle Reaction
If the second candle only touches the shared high or low without a readable move away from the level, the repeated rejection idea becomes weaker.
Messy Wick Behavior
Large, unstable, or random wicks can make the repeated level harder to interpret. The candle extremes may look similar after the fact but may not form a clean rejection area.
Middle Of A Range
Tweezer-like structures often appear inside sideways movement. A repeated high or low in the middle of a range may be less useful than one near a clear range boundary.
Lower-Timeframe Noise
Lower timeframes do not automatically invalidate a tweezer pattern, but they create more frequent lookalikes, so the repeated level needs stronger chart context.
Unfinished Candles
A candle can appear to match a high or low before it closes and then change before completion. Tweezer patterns should be reviewed after the relevant candles have closed.
News Or Low-Liquidity Conditions
Major news, rollover, market opens, and thin liquidity can create matching highs or lows that look clean after the fact. In real time, spread and execution conditions may be unstable.
What To Study After Tweezer Patterns
After learning how to read tweezer top and bottom patterns, the next step is to compare matching-level structures with body-relationship patterns and single-candle rejection structures.
You can compare tweezers with the engulfing body-takeover structure, the inside-body harami structure, the piercing recovery pattern, or the dark-cloud-cover pushback pattern. For single-candle comparisons, review the shooting star guide, the hanging man guide, or the broader forex reversal candles guide.