

What Is A Dark Cloud Cover Pattern In Forex?
Dark Cloud Cover is a two-candle bearish reversal pattern traditionally considered after an advance. A bullish first candle is followed by a bearish second candle that opens above the first candle's high and closes below the midpoint of the first candle's real body, but above its opening price.
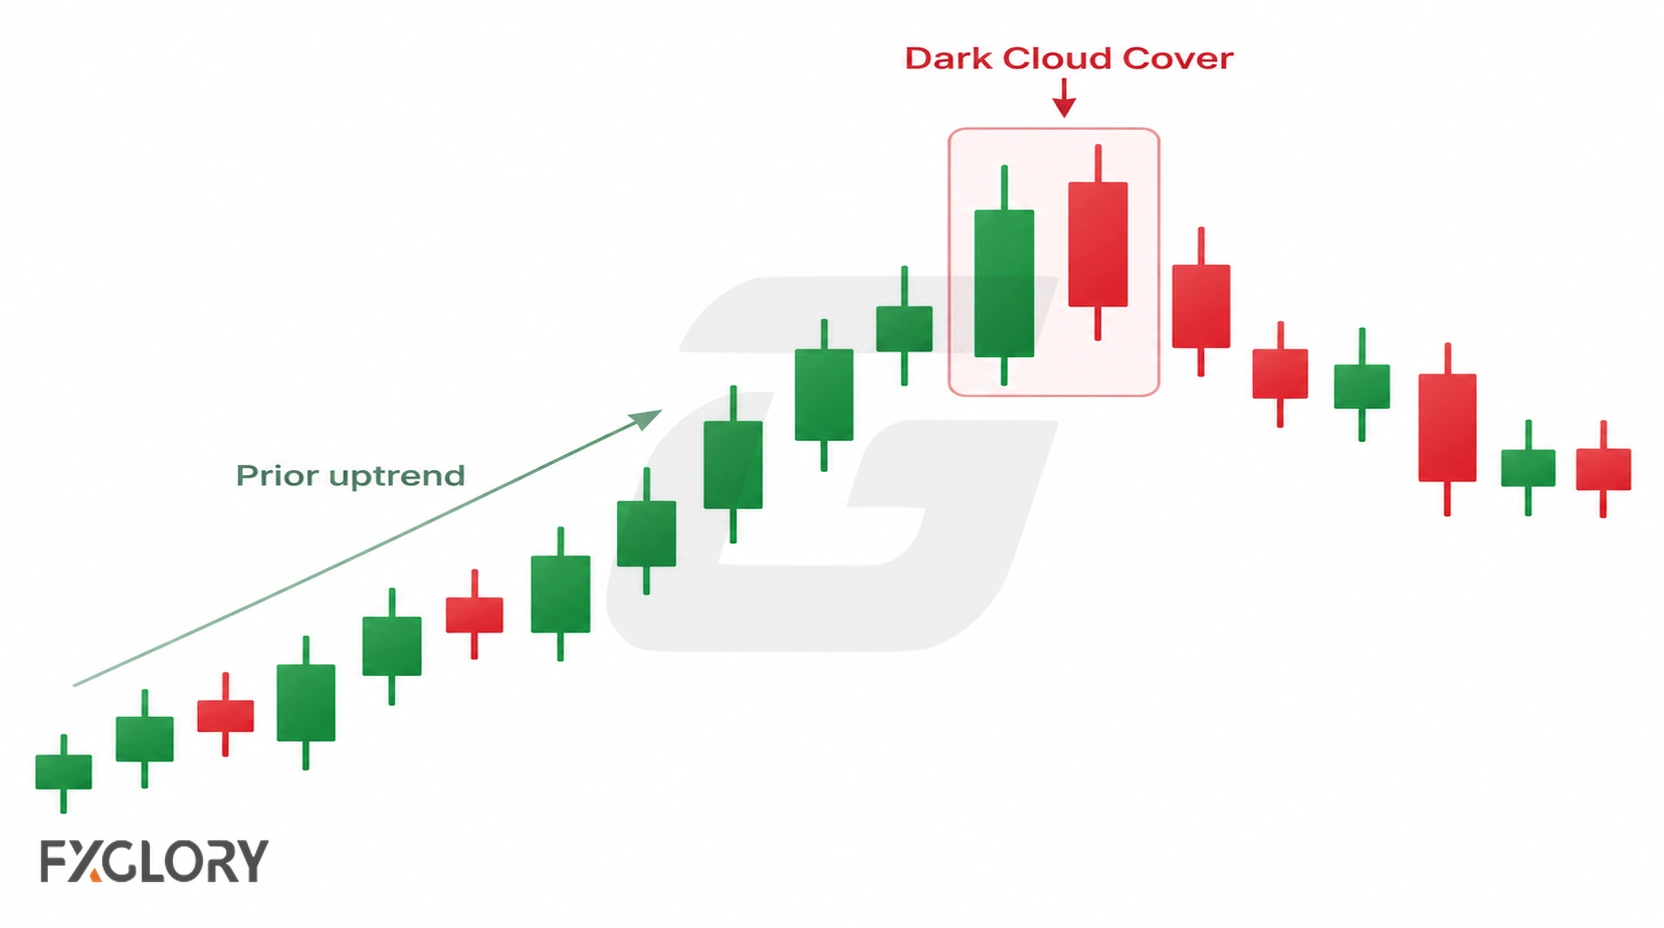
This creates partial penetration of the bullish real body. The price candles show where each period opened, traded and closed; they do not identify the exact participants behind the move or establish that a downtrend will follow.
The textbook opening-above-the-prior-high condition may be uncommon on continuously traded forex charts. A similar two-candle formation without that opening gap can be discussed as a gap-relaxed forex adaptation, not silently treated as an identical textbook pattern. The below-midpoint closing rule still distinguishes it from a shallow bearish response.
A close at or above the midpoint does not meet the conventional Dark Cloud Cover closing criterion. A bearish second real body that completely engulfs the first bullish body belongs in the bearish-engulfing comparison instead.
Pattern identification, optional confirmation from later candles, and a trade-ready plan are separate decisions. For candle basics, review the open, close, body, and wick relationship.
Dark Cloud Cover Pattern Anatomy
The structure has two real bodies. The first records an upward open-to-close move following a price advance; the second records a downward open-to-close move. The strict opening and closing conditions determine the conventional label, while chart location helps interpret the formation.
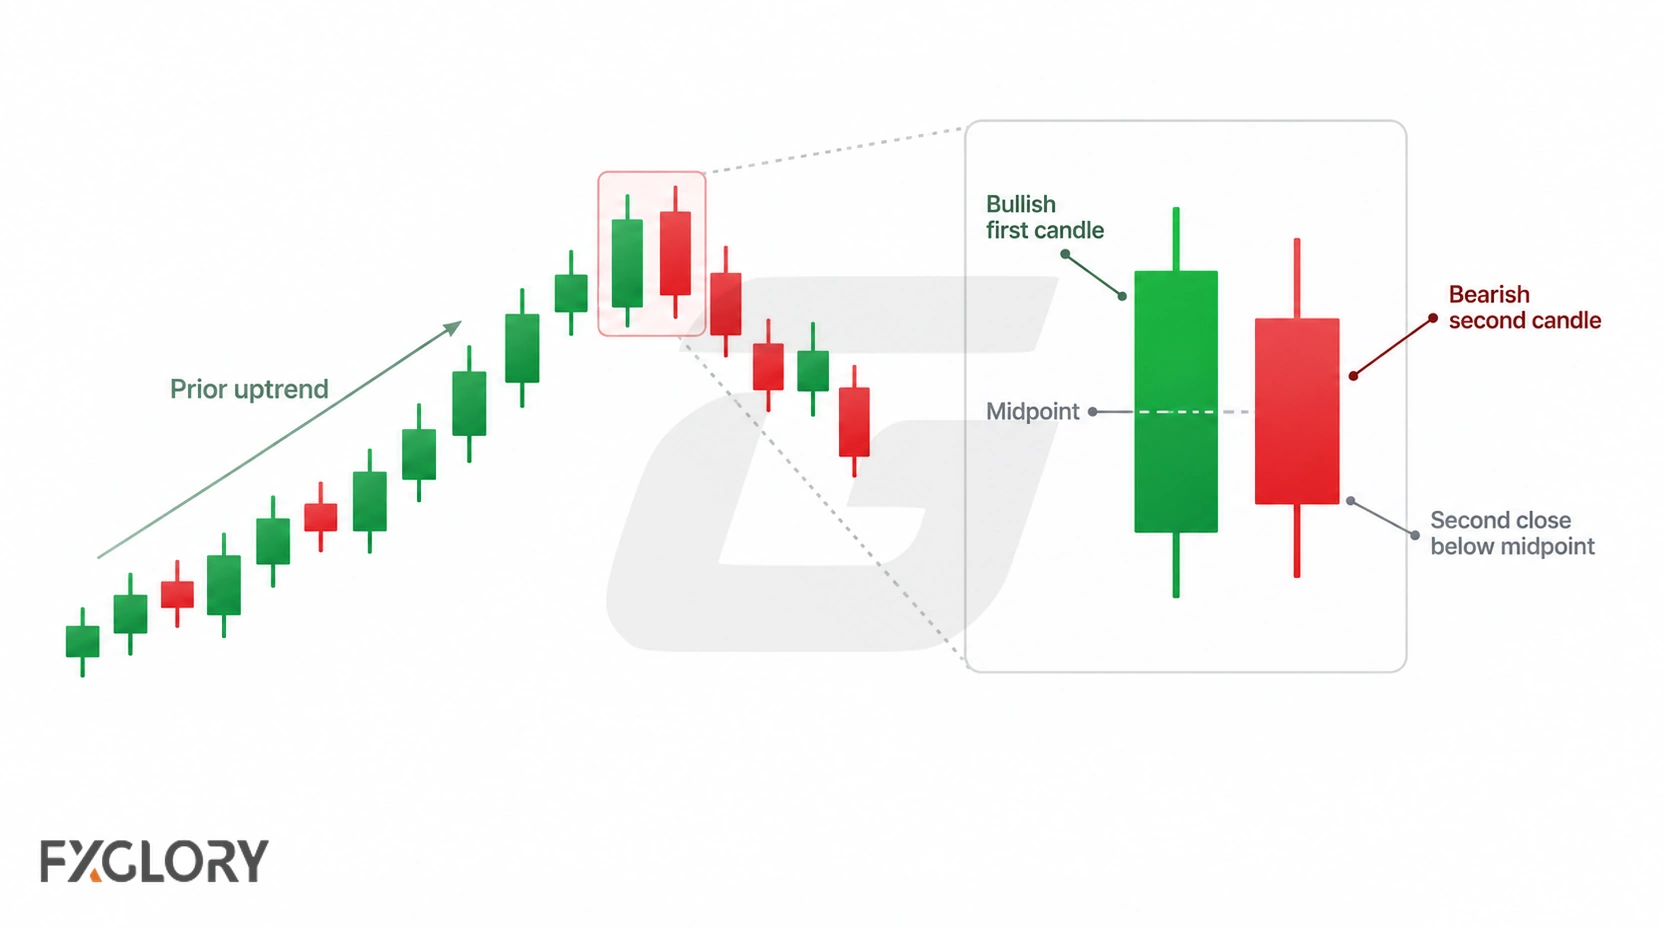
| Part | Conventional requirement or observation | What to check |
|---|---|---|
| Prior movement | An advance precedes the two candles. | Identify the advance before examining the pattern. |
| First candle | Bullish: close is above open. A relatively substantial real body can be visually clearer. | Do not invent a universal minimum body size. |
| Second open | Above the first candle's high in a strict textbook formation. | If the higher opening gap is absent, identify a gap-relaxed forex adaptation. |
| Second close | Bearish candle closes below the first real-body midpoint and above the first open. | A midpoint-or-higher close fails the conventional test; below the first open raises the engulfing distinction. |
| Body midpoint | Halfway between the first candle's open and close. | Measure the real body, not the full candle range. |
| Completed candles | Both candle periods have finished. | An intrabar candidate can change before its close. |
Why Prior Buying Pressure Matters
Dark Cloud Cover is conventionally classified as a reversal pattern, so it is considered after an advance rather than in an arbitrary two-candle sequence. Identify higher swing points, a sustained upward move, or a move up toward a prior high before inspecting the two candles.
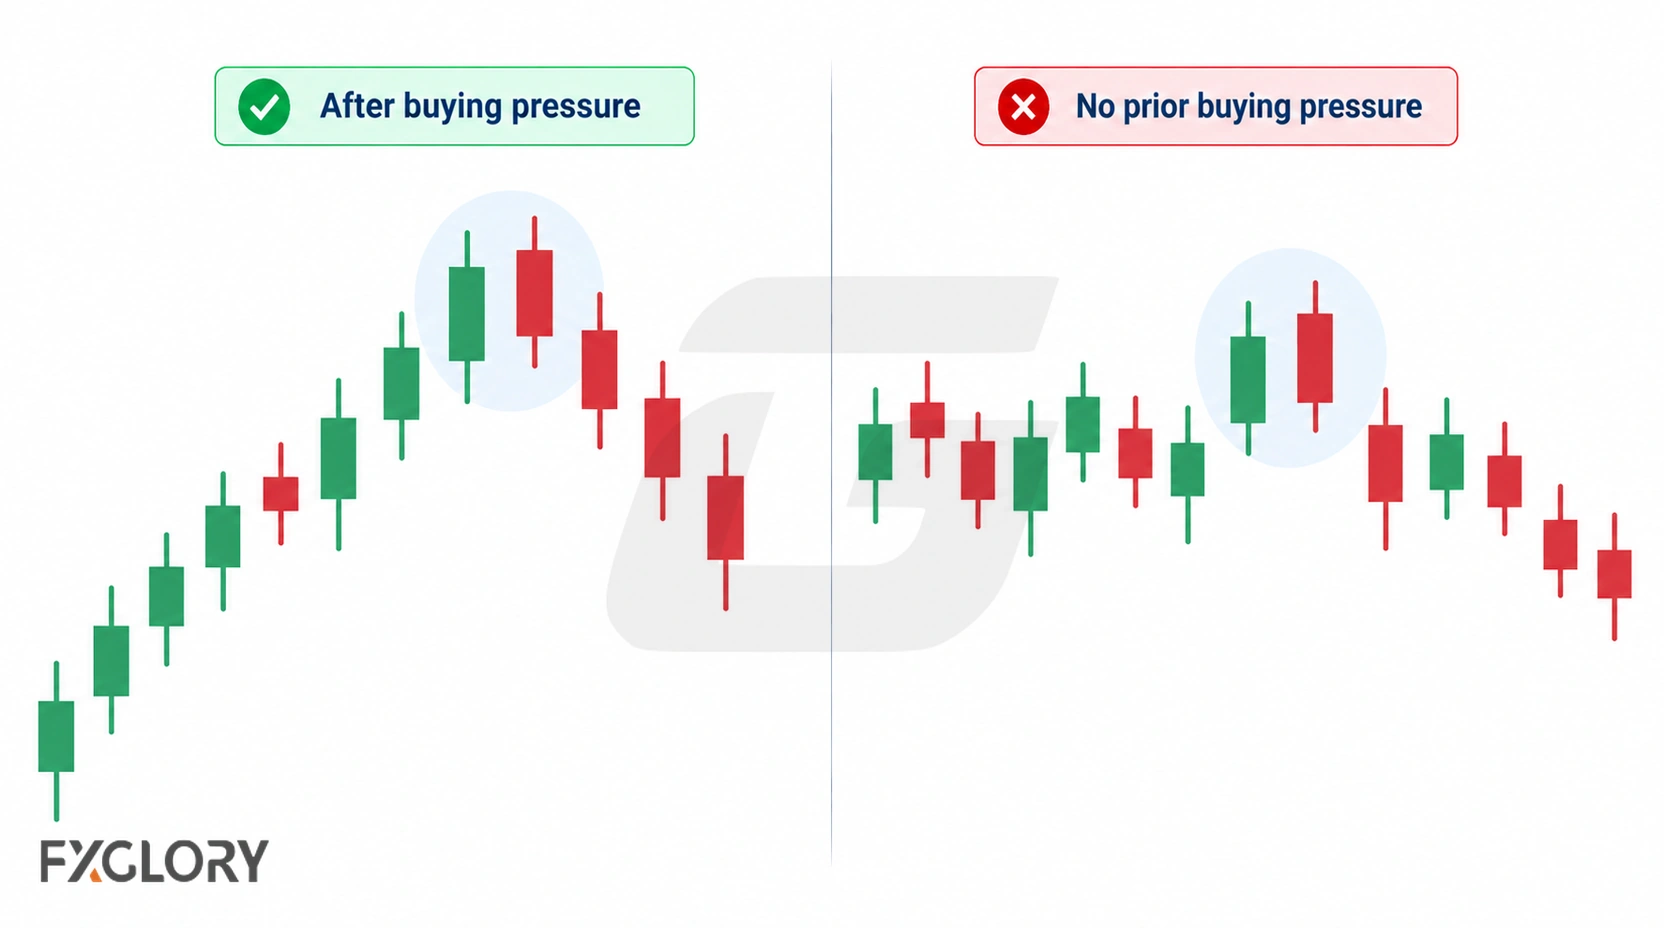
The first bullish candle records an upward close during that context; the second records a bearish close that penetrates the first body. Neither candle, by itself, proves a change in the balance of market participants or predicts how long a decline might last.
- After an advance: The formation has the prior upward context expected of a bearish reversal pattern.
- Within an ongoing decline: A similar body relationship is not the same reversal setup, because the preceding advance is absent.
- Inside a range: Check whether a distinct short advance toward a previously marked upper boundary exists; do not assume every alternating pair qualifies.
The Bearish Second Candle
The second candle must close below its open and below the midpoint of the first bullish real body. For conventional Dark Cloud Cover it opens above the first candle's high and finishes above the first candle's open; its real body therefore overlaps part, but not all, of the previous bullish body.
An opening above the preceding close but not above the preceding high appears in some looser definitions. On forex charts an opening near the preceding close is also common. State which opening rule is being used: the strict textbook pattern or a gap-relaxed adaptation. The second candle's upper wick alone cannot substitute for its required closing price.
A particularly large second candle during news, rollover or thin liquidity may meet an OHLC pattern test while offering poor execution conditions. The candle structure and the suitability of a trade are separate assessments.
The Midpoint Rule In Dark Cloud Cover
Calculate the first bullish candle's real-body midpoint as (first open + first close) ÷ 2. The second bearish candle must close strictly below that value to meet the conventional Dark Cloud Cover midpoint criterion.
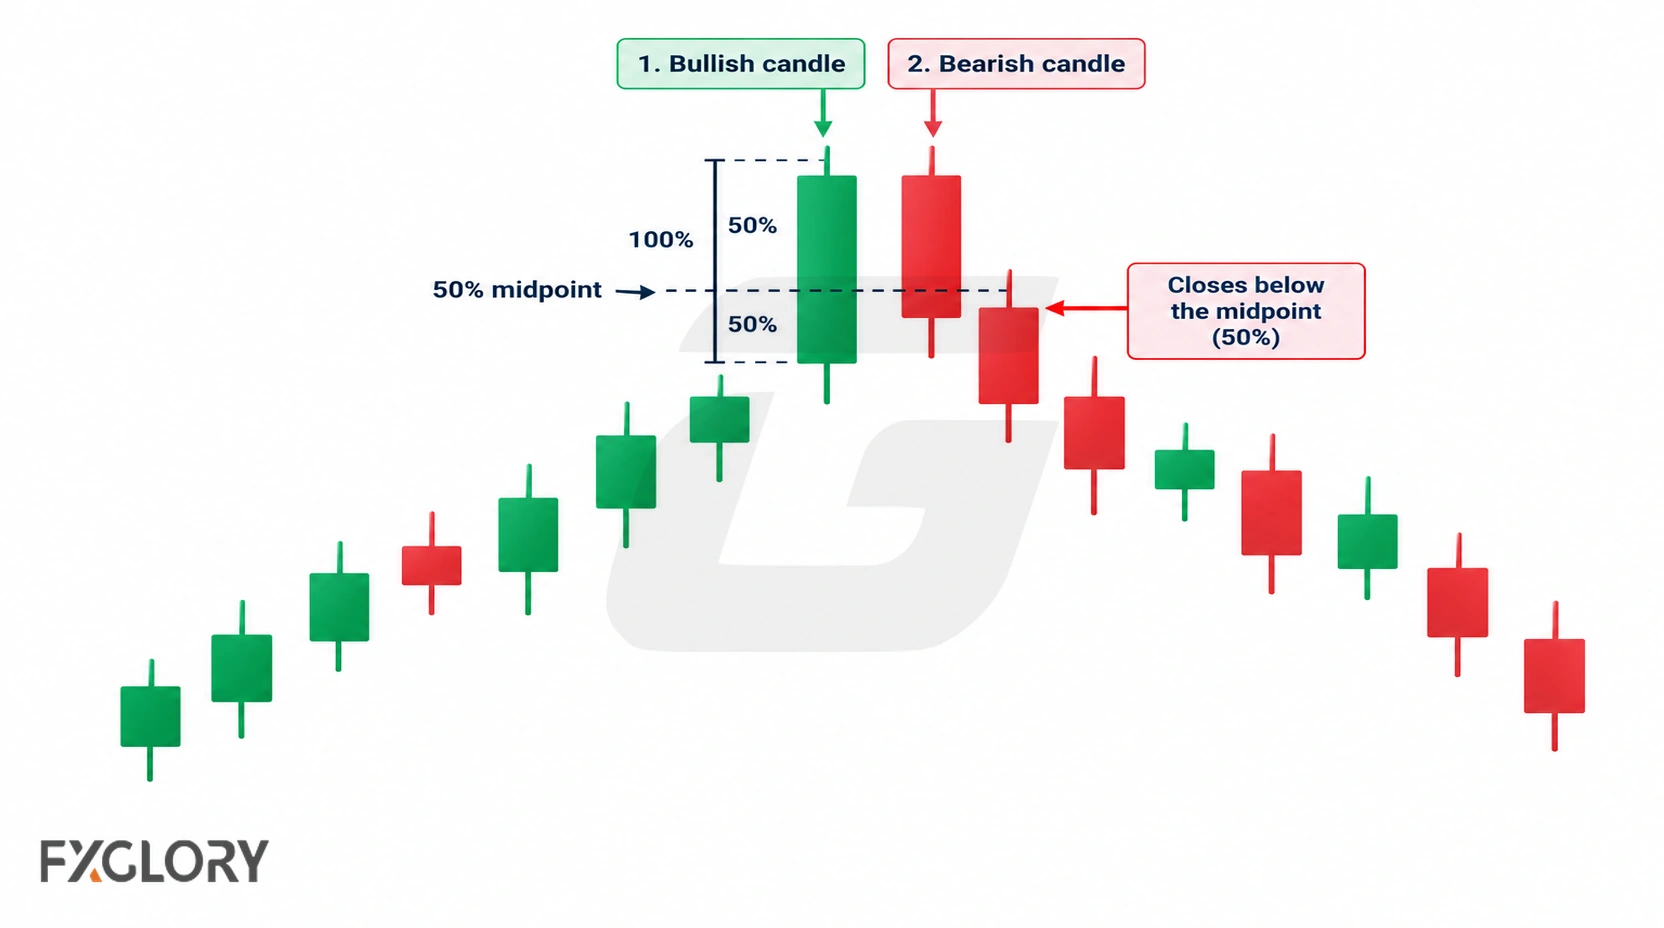
Hypothetical OHLC example: Suppose the first bullish candle opens at 1.1000, closes at 1.1100 and has a high of 1.1120. Its midpoint is 1.1050. If the second candle opens at 1.1130 and closes bearishly at 1.1040, its opening exceeds the first high and its close is below the midpoint but above 1.1000: it meets these textbook body-and-opening tests. With the same opening, a second close at 1.1060 fails the midpoint test; a close at 1.0990 instead reaches the bearish-engulfing body relationship. These are illustrative prices, not a historical observation or backtest.
| Second candle close | Structural classification | Check |
|---|---|---|
| At or above the first bullish body's midpoint | Not a conventional Dark Cloud Cover, even if bearish. | Do not relabel it a weaker valid pattern. |
| Below the midpoint, but above the first open | Passes the closing-body condition for Dark Cloud Cover. | Also check the prior advance, second open and completed candles. |
| At or below the first open | Outside the partial-body definition used here; may be bearish engulfing. | Verify whether the second real body covers the first real body. |
| Below midpoint without opening above the first high | Meets the closing test, not the strict textbook opening test. | Call it a gap-relaxed forex adaptation if that is the rule being studied. |
Penetration depth is measurable, but the distance below the midpoint is not by itself a verified measure of reversal probability. Later price action and any tested strategy rules must be evaluated independently.
Forex Gap Context
Traditional Dark Cloud Cover descriptions use a second-candle opening above the previous candle's high. That opening gap is part of the strict textbook structure, not merely a decorative feature. Forex gaps and weekend openings explains why observable gaps can differ between instruments, sessions and price feeds.
Spot forex typically trades through much of the working week, so consecutive candles on many timeframes open close to the preceding candle's close. A gap-relaxed forex reading may examine a bearish second candle opening near or above the prior close and then closing below the prior bullish body's midpoint. It should be labeled an adaptation, and its results should not be assumed equivalent to research using the textbook gap rule.
If a chart does show a visible gap, check whether it coincides with the weekend open, rollover, scheduled news, changing spreads or reduced liquidity. A chart pattern can be correctly identified even when these trading conditions make execution unattractive.
Dark Cloud Cover vs Piercing Pattern
Piercing Pattern (Piercing Line) is the bullish counterpart after a decline. Both use two candles and a close beyond the first body's midpoint, but their directions and preceding trends are opposite.
| Pattern | Prior context | Conventional two-candle structure | Distinguishing condition |
|---|---|---|---|
| Dark Cloud Cover | Advance. | Bullish candle, then bearish candle. | Second opens above the first high and closes below its midpoint but above its open. |
| Piercing Pattern | Decline. | Bearish candle, then bullish candle. | Second opens below the first low and closes above its midpoint but below its open. |
Forex adaptations may relax the opening-gap requirement for either pattern. For the bullish counterpart, see the piercing pattern guide.
Dark Cloud Cover vs Bearish Engulfing
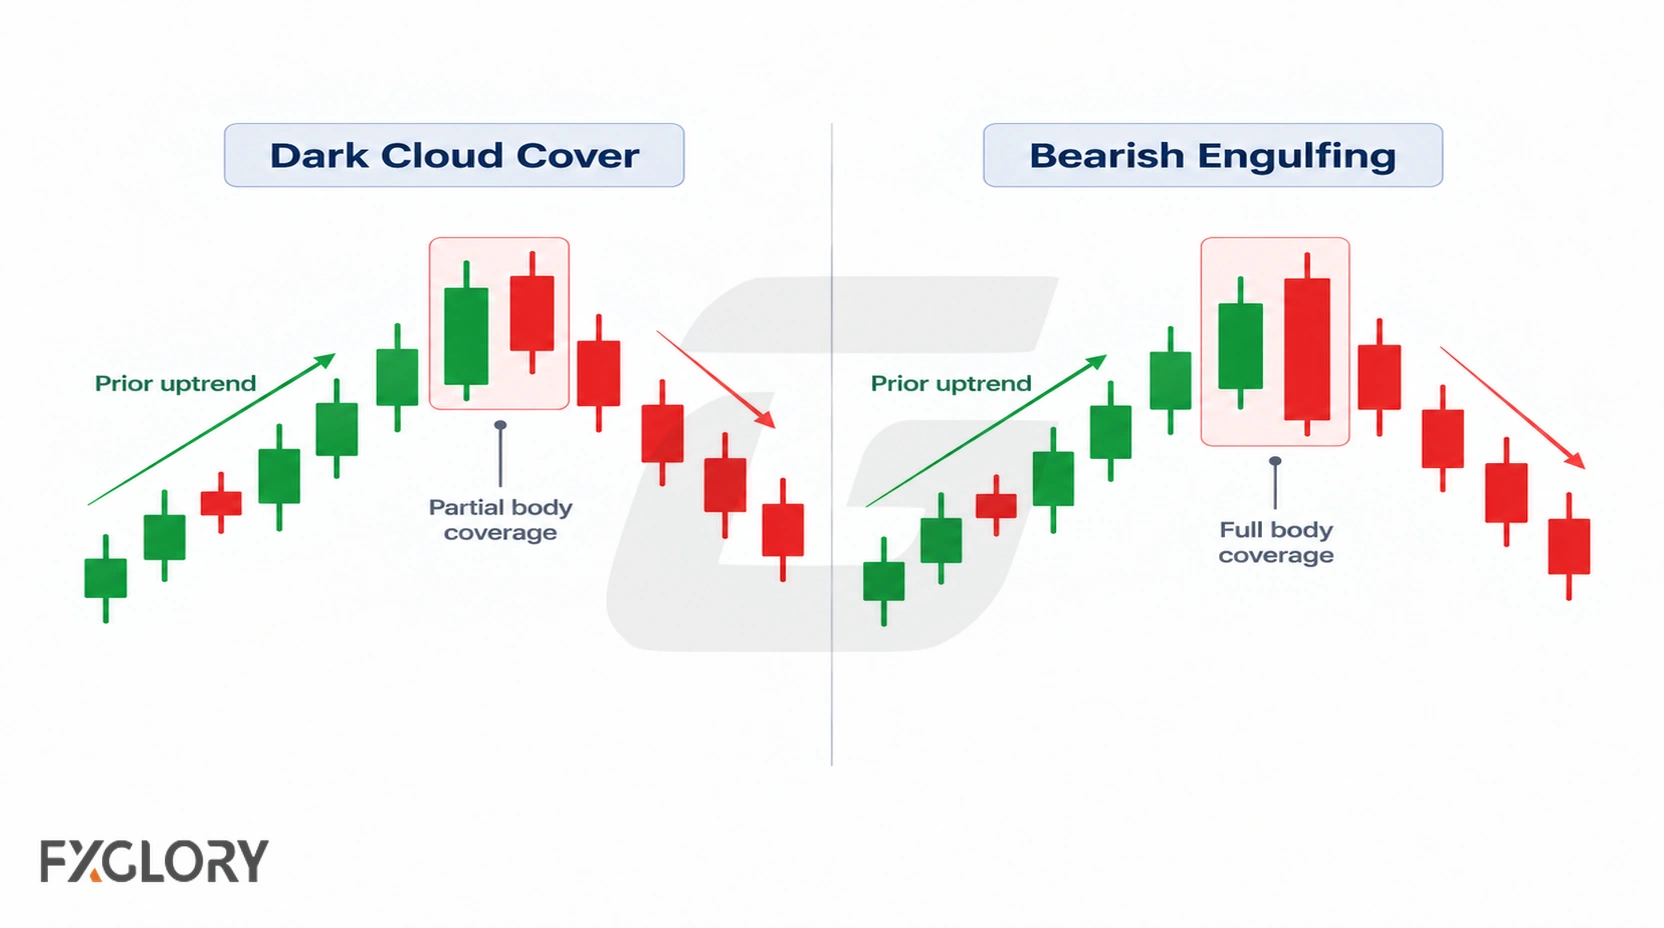
Both can appear after an advance, but their second real bodies end at different places relative to the first bullish body.
| Pattern | Second bearish body | Key difference |
|---|---|---|
| Dark Cloud Cover | Closes below the first bullish body's midpoint, but above its open. | Only part of the prior real body is covered; the strict textbook opening is above its high. |
| Bearish Engulfing | Second real body extends from at or above the first bullish close to at or below its open. | The second real body covers the first real body fully; a gap above the previous high is not required. |
The distinction concerns body boundaries, not which pattern must perform better. See the engulfing candle guide for that separate formation.
Dark Cloud Cover vs Evening Star
An Evening Star has three candles rather than two: an initial bullish candle, a comparatively small middle real body, and a bearish third candle. It is not identified using the Dark Cloud Cover second-candle midpoint test alone.
| Pattern | Candle count | Typically reviewed after | Structural focus |
|---|---|---|---|
| Dark Cloud Cover | Two. | An advance. | Second bearish close penetrates more than half the first bullish body. |
| Evening Star | Three. | An advance. | A smaller middle candle separates the initial bullish candle from a bearish third candle. |
The Evening Star guide explains its separate three-candle sequence and variations.
Dark Cloud Cover vs Similar Forex Candles
Not every bearish-looking formation after a rise belongs to the Dark Cloud Cover family. This reference table focuses on the structural feature that makes each label different.
| Pattern or candle | Main structure | Difference from Dark Cloud Cover |
|---|---|---|
| Dark Cloud Cover | Two candles; bearish close below first bullish body midpoint and above first open. | Partial penetration after an advance, with a higher second open in the strict version. |
| Bearish Engulfing | Bearish second real body fully covers the prior bullish real body. | Full body coverage rather than partial penetration. |
| Piercing Pattern | Bullish second candle recovers beyond the midpoint of a bearish first real body. | Bullish counterpart after a decline. |
| Shooting Star | One candle with a small real body and long upper wick. | Single-candle upper-wick structure. |
| Hanging Man | One candle with a relatively small body and long lower wick after an advance. | Single-candle lower-wick structure. |
| Evening Star | Three candles, including a smaller middle real body. | A separate three-candle structure. |
| Tweezer Top | Two candles with equal or approximately equal highs. | Repeated high tests, not a midpoint-close requirement. |
| Three Black Crows | Three consecutive bearish real bodies. | A three-candle bearish sequence. |
For broader classifications, see forex candlestick pattern groups. For single-candle contrasts, see the Shooting Star and Hanging Man guides.
Where Dark Cloud Cover Patterns Matter More
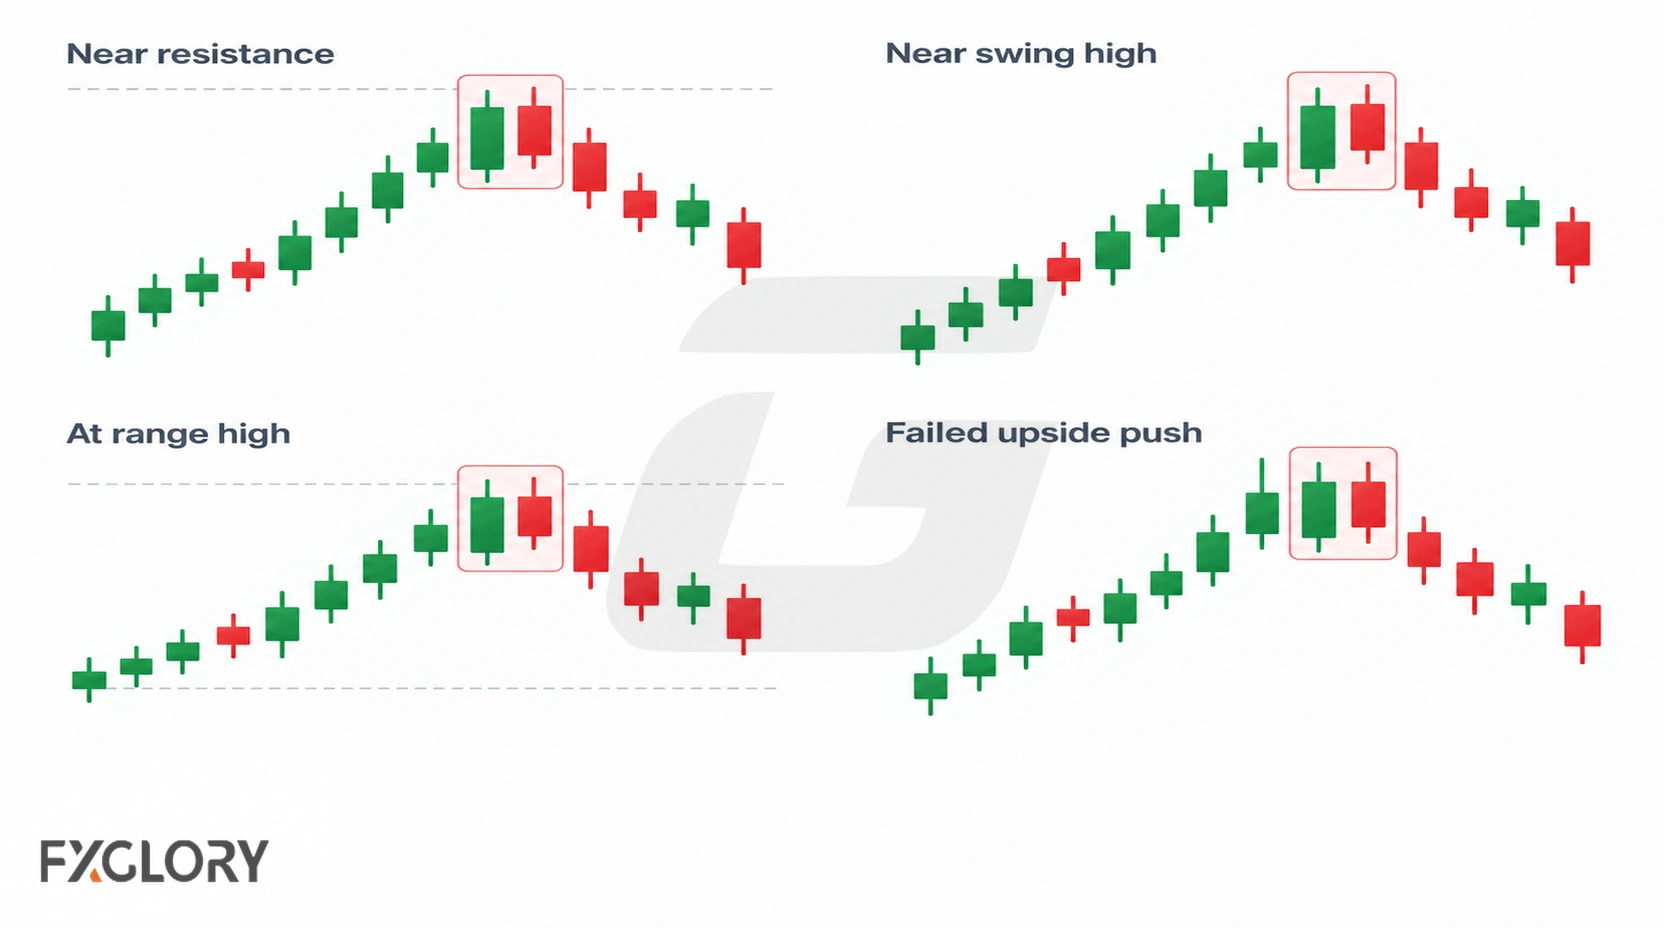
After verifying the two-candle structure, mark chart reference levels that existed before the pattern formed. These levels help frame an interpretation; they do not change the OHLC pattern criteria or prove a higher reversal probability.
Timeframe matters: two candles on a five-minute chart describe a different observation window from two daily candles. Compare candle size and nearby swings using a consistent timeframe instead of applying a universal quality threshold.
After A Rise
Look for a visible sequence of higher prices or advancing swing points before the first bullish candle. Note whether the second bearish close occurs near the end of that advance rather than during an unrelated downward leg.
Near Resistance
Mark a resistance zone using earlier visible price reactions, before the two-candle formation is complete. Then compare the second candle's open, high and close with that zone. A close back below the zone after a higher test is one observable rejection scenario, not a guaranteed reversal.
Near A Swing High
Identify an earlier swing high and compare it with the high of the two-candle sequence. Did price exceed that high temporarily, or remain below it? Specify the reference level rather than saying price came from a strong-looking area.
At A Range High
Draw a range upper boundary from previously observed repeated highs, not from the current candle alone. A formation near that boundary provides a testable location; the same shape in the range middle has less direct relationship to the defined boundary.
After A Failed Upside Continuation
Define the attempted continuation first, such as a move above an established resistance level. Then observe whether the completed second candle closes back beneath the level. A break back below that reference is a separate event from identifying the candlestick formation.
Dark Cloud Cover Pattern Criteria and Chart Context
First decide whether the observed candles meet the chosen pattern definition. Then assess surrounding context and trading conditions. A valid pattern can occur at an unhelpful location; an above-midpoint close is not a weaker valid textbook Dark Cloud Cover.
| Factor | Structural condition or useful observation | Different classification or limitation |
|---|---|---|
| Preceding trend | Advance before the first candle. | Without an advance, the conventional reversal context is missing. |
| First candle | Bullish real body: close above open. | Small bodies may be harder to interpret, but no universal size cutoff is specified. |
| Second opening | Strict: above the first candle's high. | No such gap: identify any gap-relaxed forex adaptation explicitly. |
| Second close | Bearish; below first body midpoint but above first open. | At/above midpoint: not conventional Dark Cloud Cover; at/below first open: check engulfing. |
| Completed status | Both candle periods have closed. | Before the second close: candidate only. |
| Chart location | Near an independently marked resistance zone, swing high, or range boundary. | Location can inform context but not structural validity. |
| Market conditions | Known spread, liquidity, volatility and news environment. | Unstable conditions may make execution unsuitable even with valid structure. |
| Subsequent candles | May break the second candle's low or reclaim the pattern high. | Neither is part of identifying the original two-candle pattern. |
Dark Cloud Cover Forex Reading Table
These scenarios illustrate what to observe next, without converting chart context into an automatic entry signal. Choose and document any follow-through rule before evaluating it.
| Situation | Observation | Specific next check |
|---|---|---|
| After an advance | A completed bearish second candle meets the chosen midpoint/opening criteria. | Does a later completed candle close below the second candle's low? This is one optional confirmation rule. |
| Near resistance | A previously marked zone overlaps the two-candle highs. | Does the next completed candle close back above or remain below that zone? |
| Near an earlier swing high | The pattern forms around a known high. | Compare the new high and subsequent closes with the earlier swing high. |
| Near a range upper boundary | The two candles form near an established range ceiling. | Observe whether subsequent closes remain inside the range or establish a break above it. |
| Second close at or above midpoint | Bearish candle does not satisfy the conventional midpoint test. | Classify it as a different two-candle response, not a weaker textbook pattern. |
| Second body engulfs first | Bearish engulfing may describe the body relationship. | Check the two real-body opening and closing boundaries. |
| Valid pattern followed by rising price | Bearish follow-through may fail. | A later completed close above the two-candle high is one possible bearish-scenario invalidation rule, not retroactive pattern invalidity. |
| News or thin liquidity | Spreads and execution can change rapidly. | Check quoted spreads, liquidity and the intended stop distance before any trade planning. |
How To Read A Dark Cloud Cover Pattern In Forex
Apply the same rule set consistently to avoid calling a candidate, a complete pattern and a trade setup the same thing.
- Choose a timeframe and definition: Decide whether you require the textbook second open above the preceding high or are studying a gap-relaxed forex adaptation.
- Identify the preceding advance: Mark the upward move without using subsequent candles to choose it retrospectively.
- Check the first candle: Confirm a bullish real body.
- Check the completed second candle: Confirm a bearish close below the first real-body midpoint and above its open; record the second opening relative to the previous high.
- Differentiate engulfing: If the second real body fully covers the first, use the engulfing classification instead.
- Locate pre-existing reference levels: Compare the formation with resistance, a swing high, or a range boundary, where available.
- Review execution conditions: Consider spreads, liquidity, rollover, volatility and scheduled news separately from the pattern label.
- Define optional later evidence: For example, a completed close below the second candle's low for bearish follow-through or above the pattern high for scenario invalidation; neither outcome rewrites the original structure.
- Only then assess a trade: Entry, stop location, position size, transaction costs and acceptable account risk require a separate plan.
False Dark Cloud Cover Patterns In Forex
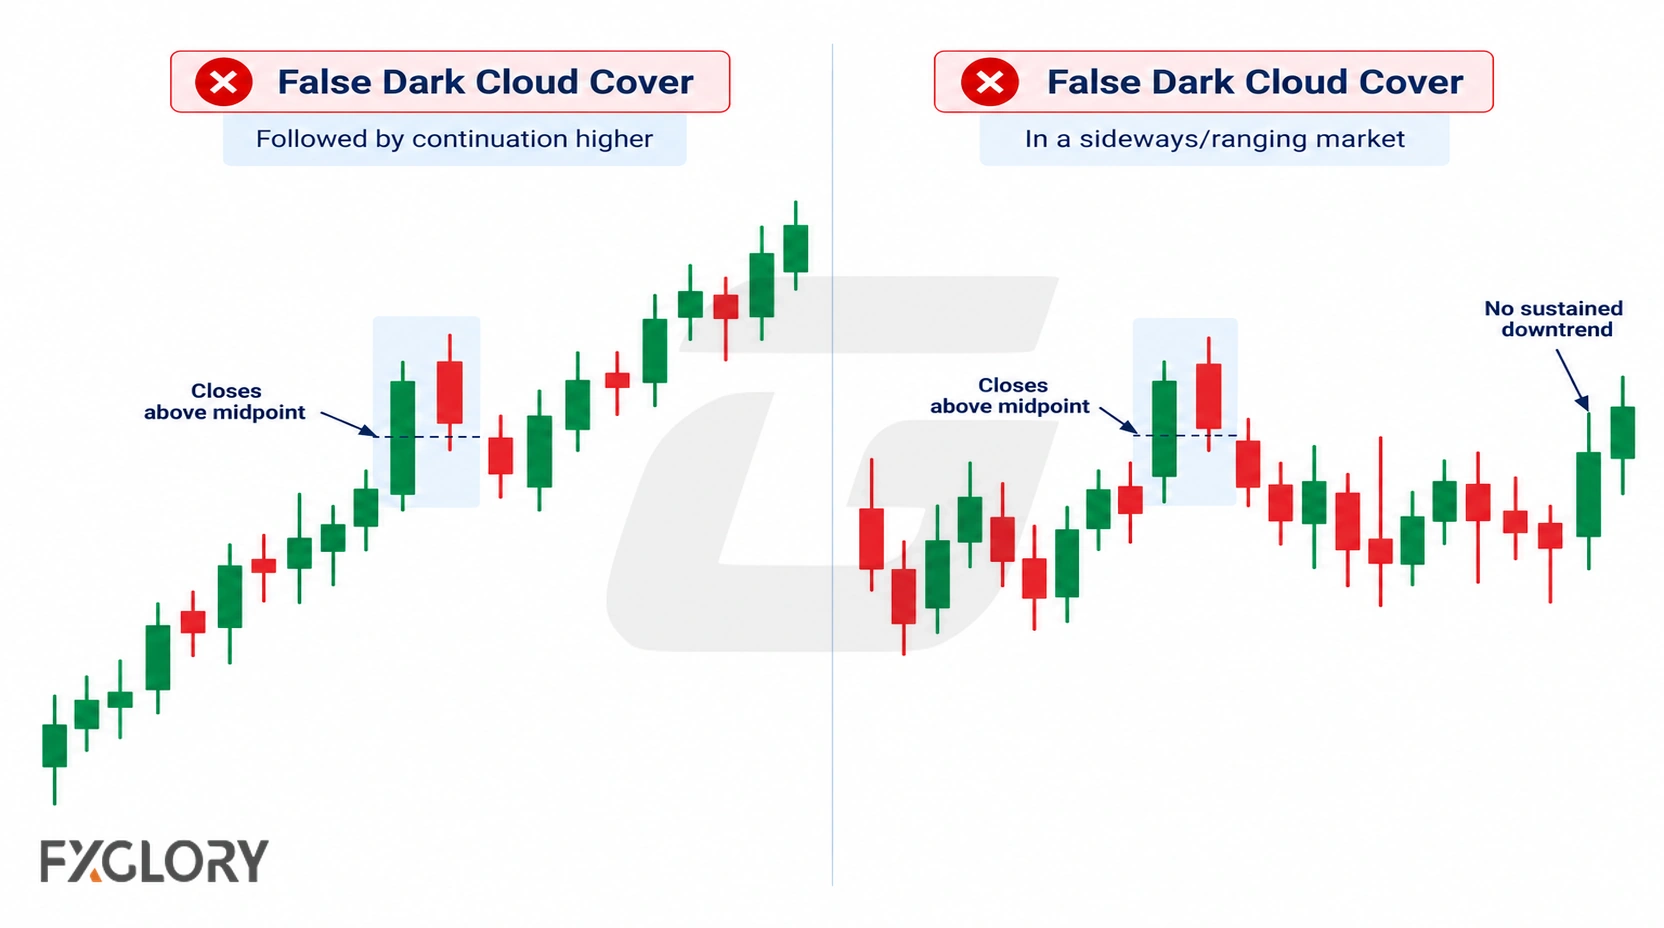
"False pattern" can describe two different cases: a lookalike that never meets the chosen structural rules, or a valid completed pattern that does not lead to the anticipated bearish follow-through. These are not the same error.
No Prior Buying Pressure
A two-candle combination after a sustained decline does not have the preceding advance expected of conventional Dark Cloud Cover. Record it as a different context rather than forcing the reversal label.
Pattern Appears In A Downtrend Or Sideways Market
Inside a range, check whether a distinct advance toward a previously established upper boundary occurred. In the middle of directionless movement, the bearish two-candle structure may lack a meaningful reversal context.
Weak First Candle
A small bullish real body is still bullish. Its relative size may affect how visually informative the subsequent penetration is; it does not automatically break the bullish-first-candle requirement. Compare body size with nearby candles rather than applying an unstated cutoff.
Shallow Second Candle Close
A bearish close at or above the first bullish body's midpoint does not qualify under the conventional rule. It can still document a bearish close following a bullish candle, but it needs another label.
Pattern Becomes Engulfing
When the bearish second real body covers the complete bullish first real body, the structural relationship is bearish engulfing instead of the partial-body Dark Cloud Cover described here.
Messy Range Conditions
An alternating pair near the middle of an established range may satisfy some candle-body tests without standing at a meaningful upper reference level. This affects context, not the recorded opening and closing prices.
Unfinished Second Candle
Before the second candle finishes, its body and closing relationship can change. Treat it as a candidate and assess the midpoint only at the completed close.
News Or Low-Liquidity Conditions
A gap or large body during market reopening, rollover or an economic release can satisfy structural rules while spreads or slippage make a trade unattractive. Pattern validity and trade suitability are distinct.
Valid Pattern With Failed Bearish Follow-Through
A valid two-candle pattern may be followed by higher closes instead of a decline. For example, a subsequent completed close above the pattern's high can invalidate a separately defined bearish scenario; it does not change whether the two-candle structure was present.
Common Mistakes With Dark Cloud Cover In Forex
Most consequential errors come from mixing up the price structure, later evidence, and a trading decision.
- Using a vague definition: Decide which opening-gap rule applies and require a strictly below-midpoint second close.
- Measuring the wrong price span: Use the first real body's open and close, not its high-low range, to calculate the midpoint.
- Judging an unfinished candle: A candidate intrabar pattern may disappear by the close.
- Mixing pattern types: A bearish engulfing body, shooting-star wick and three-candle Evening Star each has different structural criteria.
- Adding hindsight to chart context: Mark resistance and swing levels from already available candles, rather than drawing levels solely to fit the outcome.
- Treating later confirmation as part of pattern existence: A subsequent break, retest or higher close affects a scenario, not the already completed two-candle relationship.
- Substituting a pattern for risk planning: A potential entry must still be assessed against stop placement, position sizing, spread, slippage, liquidity and maximum acceptable loss.