
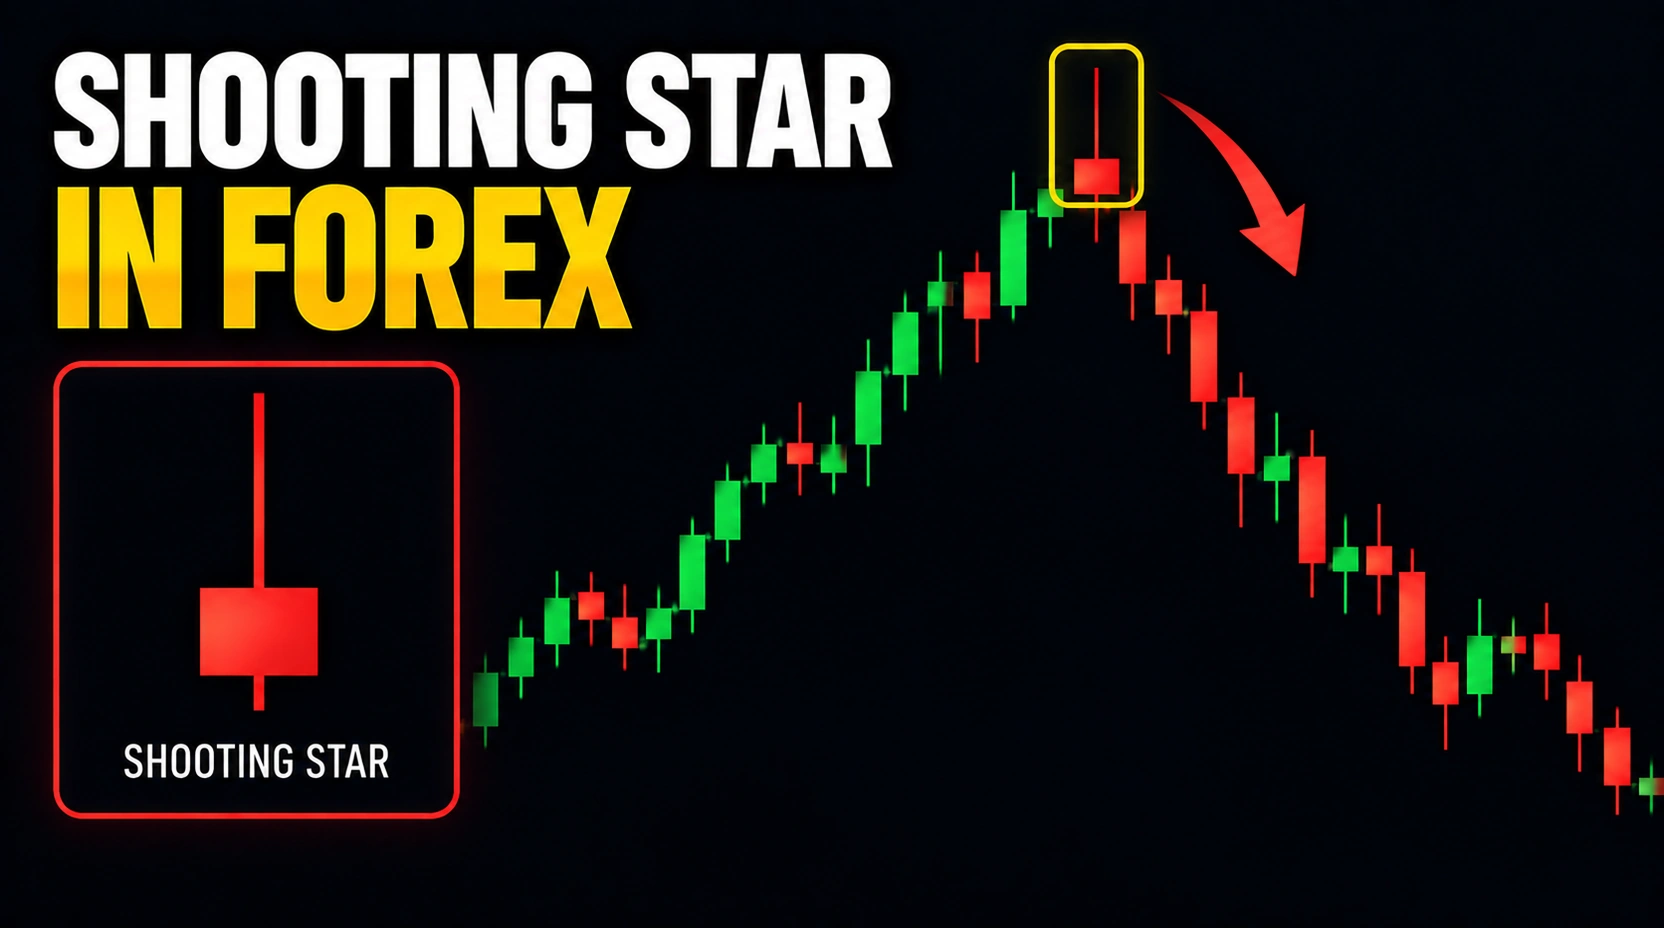
What Is a Shooting Star in Forex?
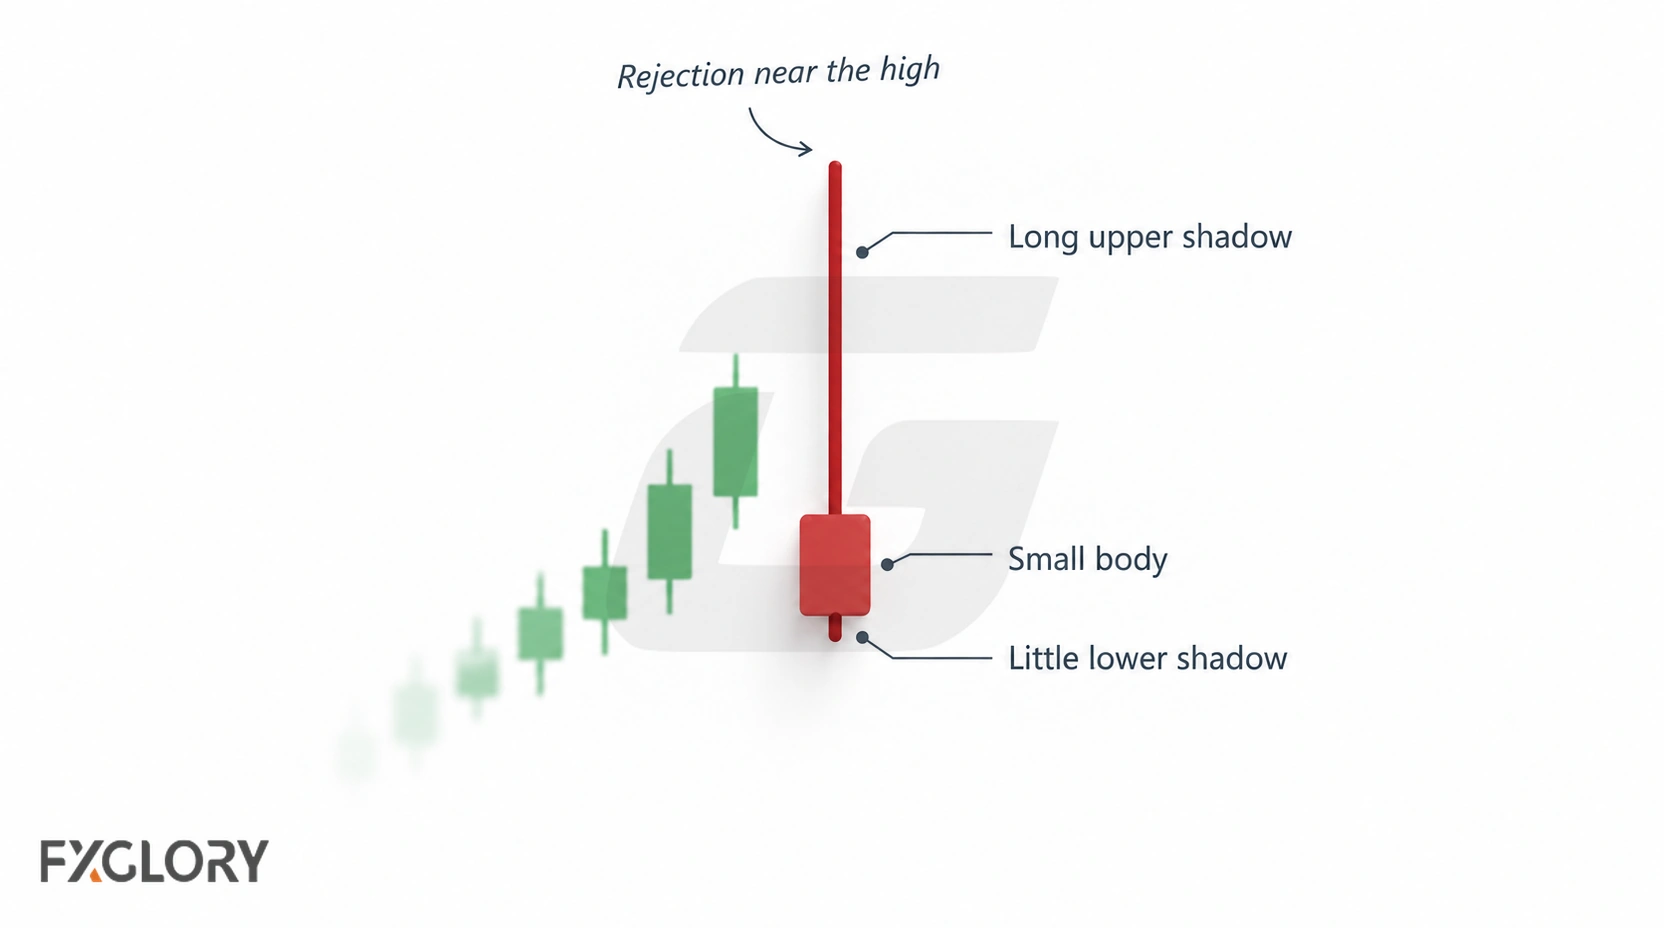
A Shooting Star is a single-candle formation conventionally interpreted as a bearish reversal warning after a rise. It has a small real body near the lower end of its range, a long upper shadow, and little or no lower shadow. During the candle, price traded substantially above the body but closed well below its high.
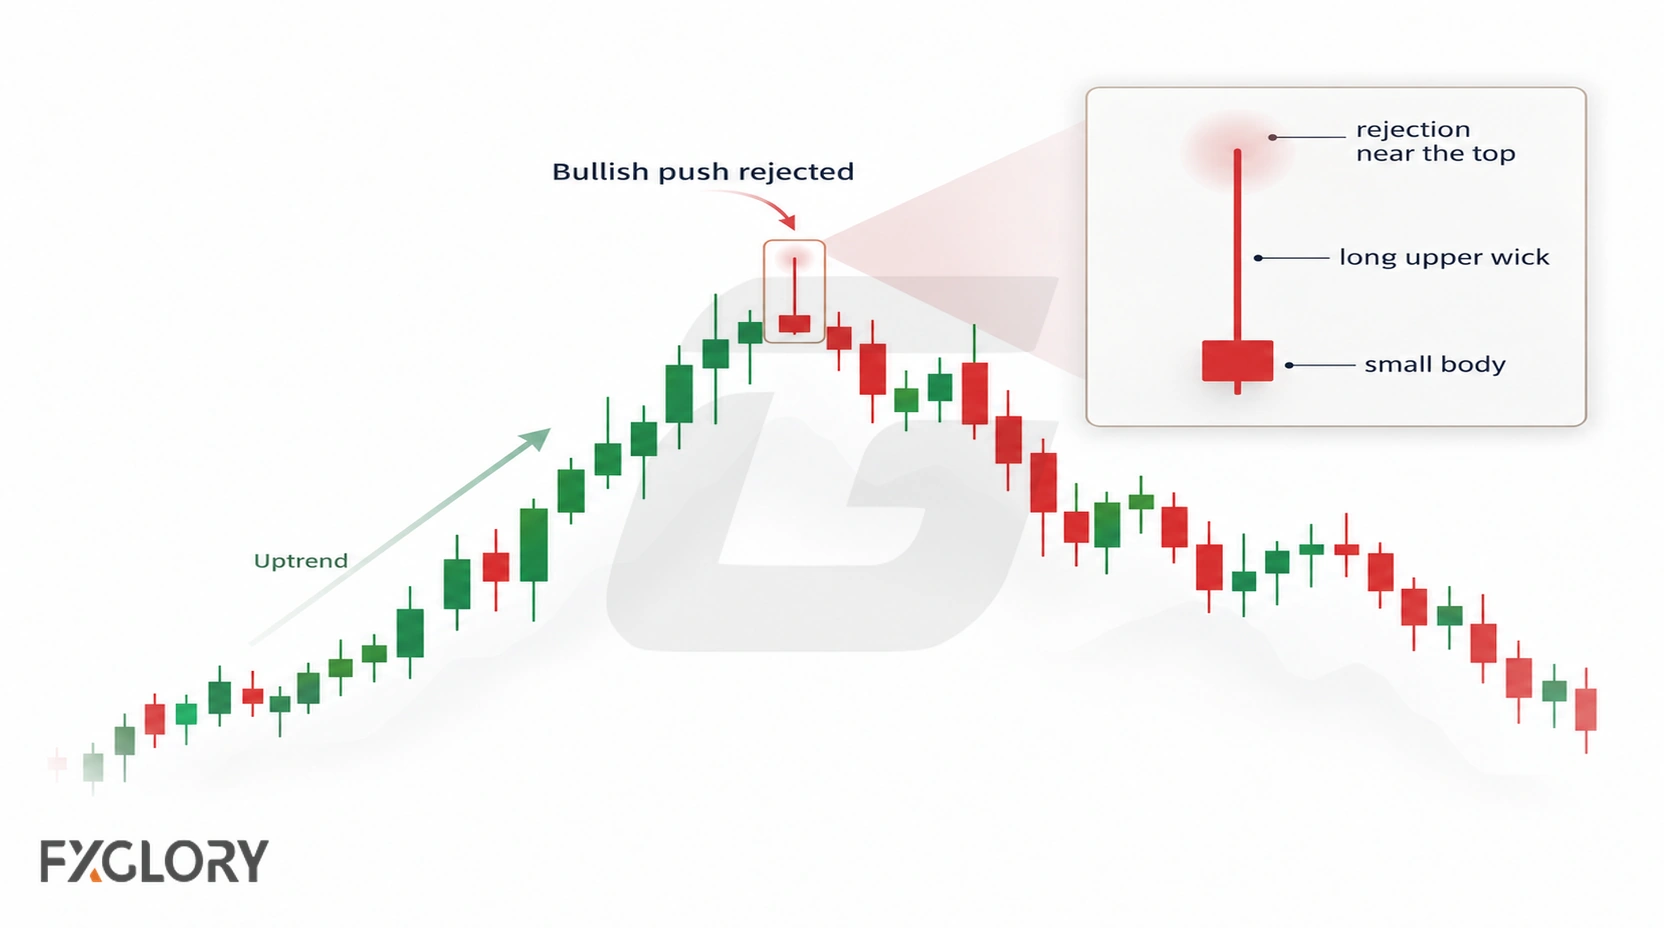
The real body may be bullish or bearish, and the formation does not guarantee a subsequent decline. Its traditional interpretation depends on preceding buying pressure: an identical upper-shadow shape after a decline may instead be classified as an inverted hammer. For the basics of candle construction, see the forex candlestick guide.
Shooting Star Candle Anatomy
The candle should be complete before it is classified: its body and shadows can change until the timeframe closes. Compare the open and close (the real body) with the high and low (the full candle range), rather than judging the upper wick in isolation.
| Feature | Recognizable structure | What to assess |
|---|---|---|
| Real body | Small, near the lower end of the range; bullish or bearish color is possible. | A body near the middle suggests a different, less distinctive shape. |
| Upper shadow | Clearly dominant; a common visual guideline is roughly twice the body length or more. | Price traded above the body but was below its high at the close. |
| Lower shadow | Little or none in a textbook example. | A large lower shadow shows a rebound from prices below the body too, reducing the clarity of the upper-shadow shape. |
| Candle completion | The chosen timeframe has closed. | Do not label an unfinished candle as a completed formation. |
The two-to-one upper-shadow guideline is a conventional recognition aid, not a measured success threshold. The candle itself records open, high, low, and close; explanations about why market participants moved price are interpretations, not directly observed order-flow evidence.
Why Prior Buying Pressure Matters
The Shooting Star earns its bearish reversal interpretation when it follows an advance or a test of higher prices. The upper shadow can then illustrate an intraperiod advance that was not sustained by the close. Without that preceding move, the same geometry is better described first as a long-upper-shadow candle rather than automatically assigned a bearish reversal role.
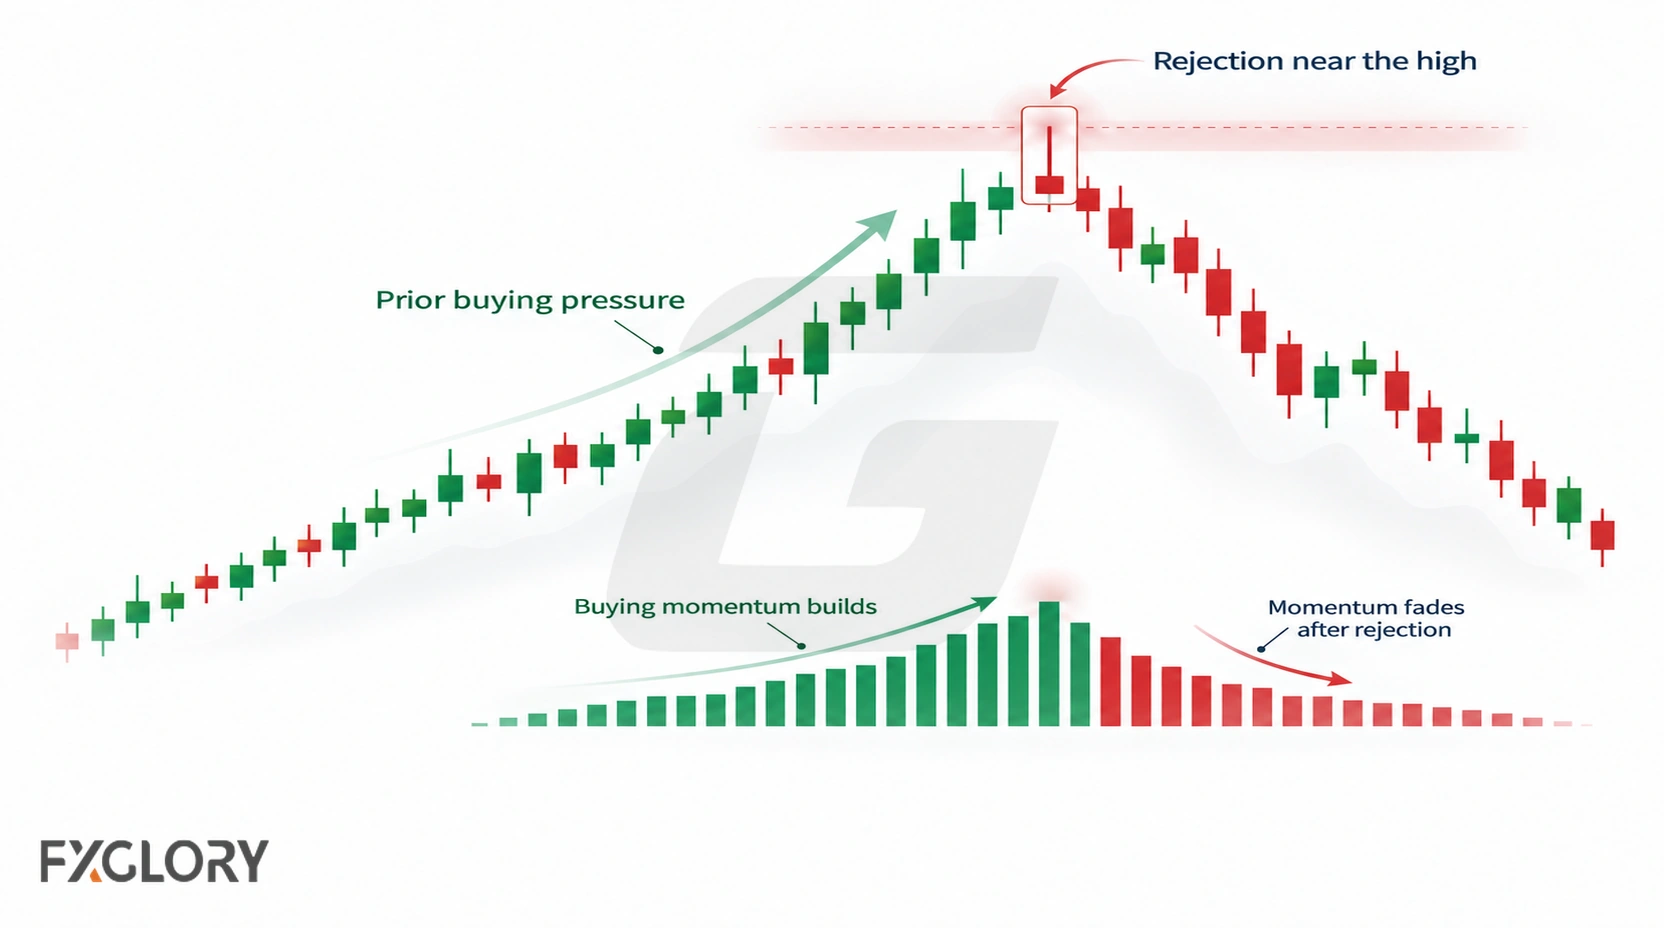
The relevant rise can be a broader uptrend or an upward pullback within a larger downtrend. Those cases need different interpretations: a Shooting Star after a countertrend rally might mark a potential end to the pullback, not necessarily a reversal of the larger downtrend. Similarly, a wick in the middle of a sideways range may simply reflect movement between nearby levels.
Shooting Star vs Similar Candlestick Patterns
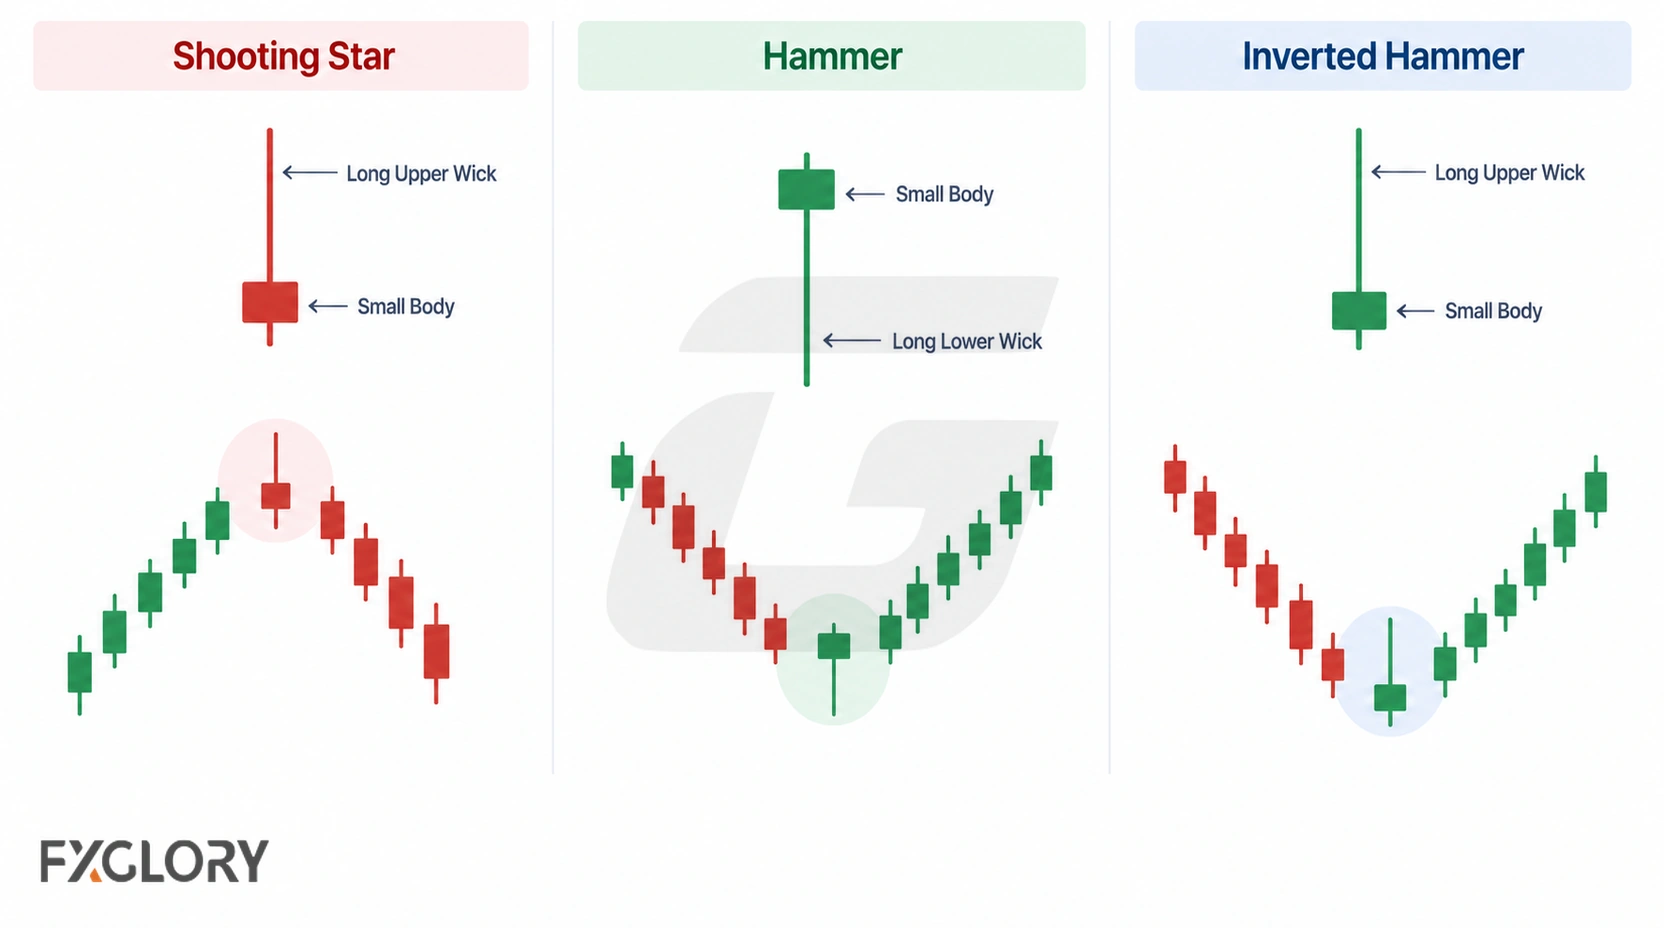
Wick position and prior price movement distinguish a Shooting Star from other small-bodied candles. In particular, Shooting Star and inverted hammer can share almost identical geometry but have different preceding trends.
| Pattern | Typical appearance | Defining distinction |
|---|---|---|
| Shooting Star | Long upper shadow, small body low in the range. | Traditionally follows an advance; bearish reversal interpretation. |
| Inverted Hammer | Similarly long upper shadow and small low-positioned body. | Traditionally follows a decline; potential bullish reversal interpretation. |
| Hammer | Long lower shadow, small body high in the range. | Appears after a decline; opposite wick orientation. |
| Hanging Man | Long lower shadow, small body high in the range. | Typically occurs after a rise. |
| Gravestone Doji | Long upper shadow with open and close nearly equal near the low. | Doji-like body, sometimes resembling a near-zero-body Shooting Star. |
| Pin Bar | Small body and one dominant shadow. | Broader price-action description, rather than one named trend-context pattern. |
Compare the similar geometry in inverted hammer, the lower-shadow counterpart in hammer candles, and near-zero-body variations in gravestone doji. The broader pin bar guide covers long-shadow behavior without restricting the discussion to Shooting Stars.
Strong vs Weak Shooting Stars and Chart Location
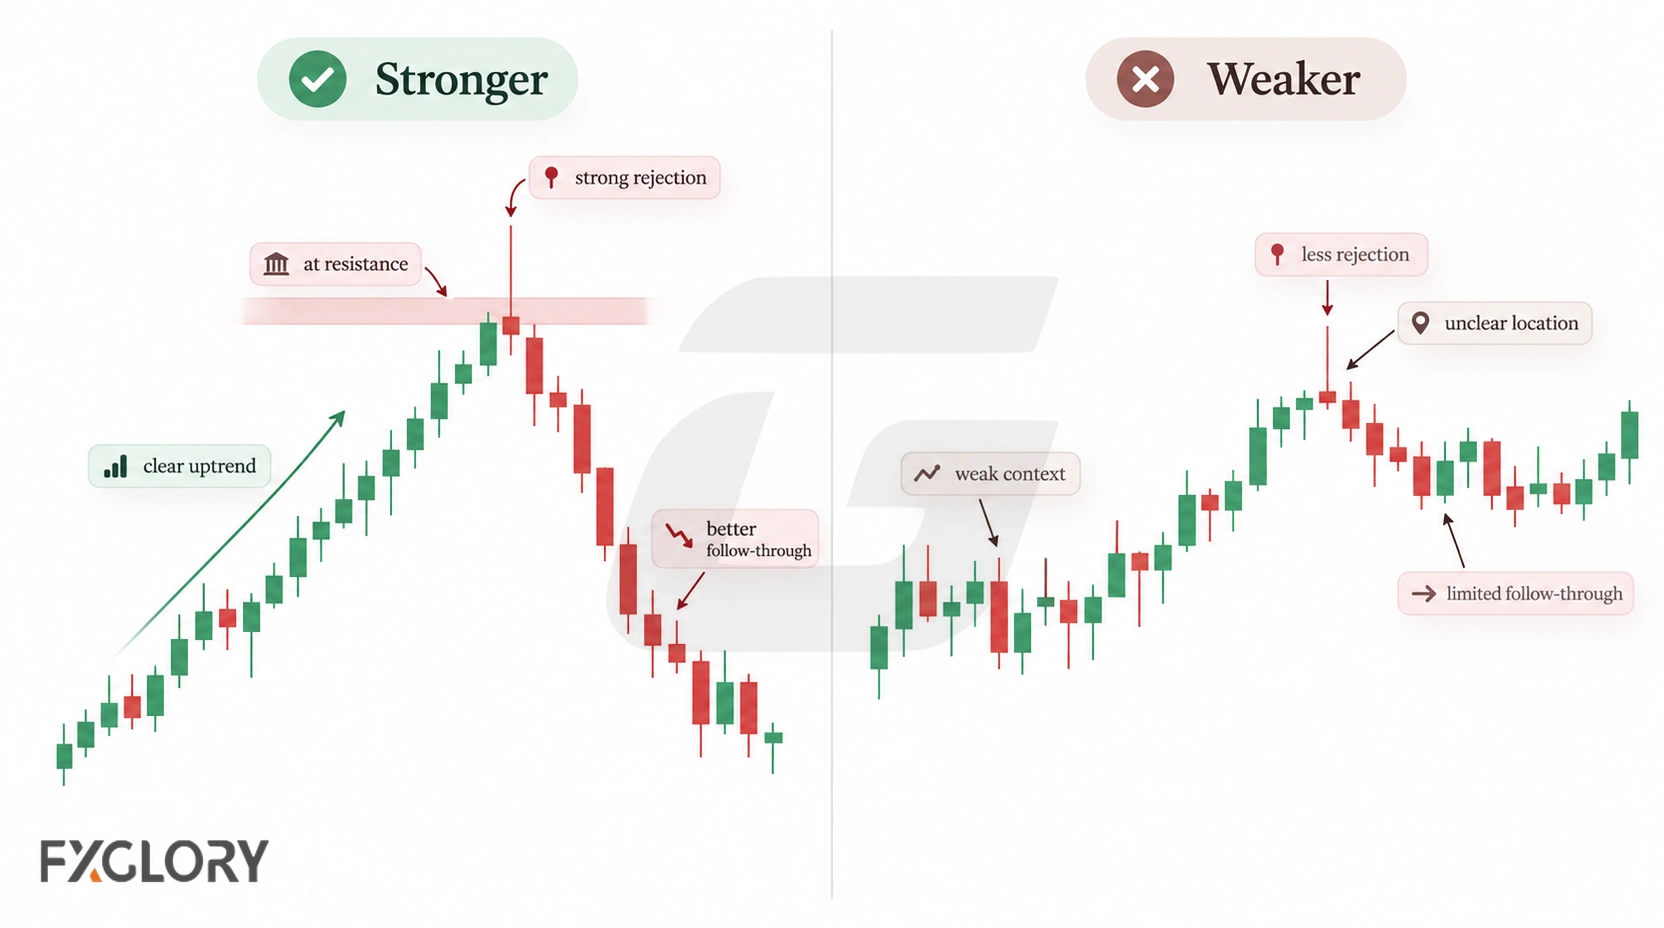
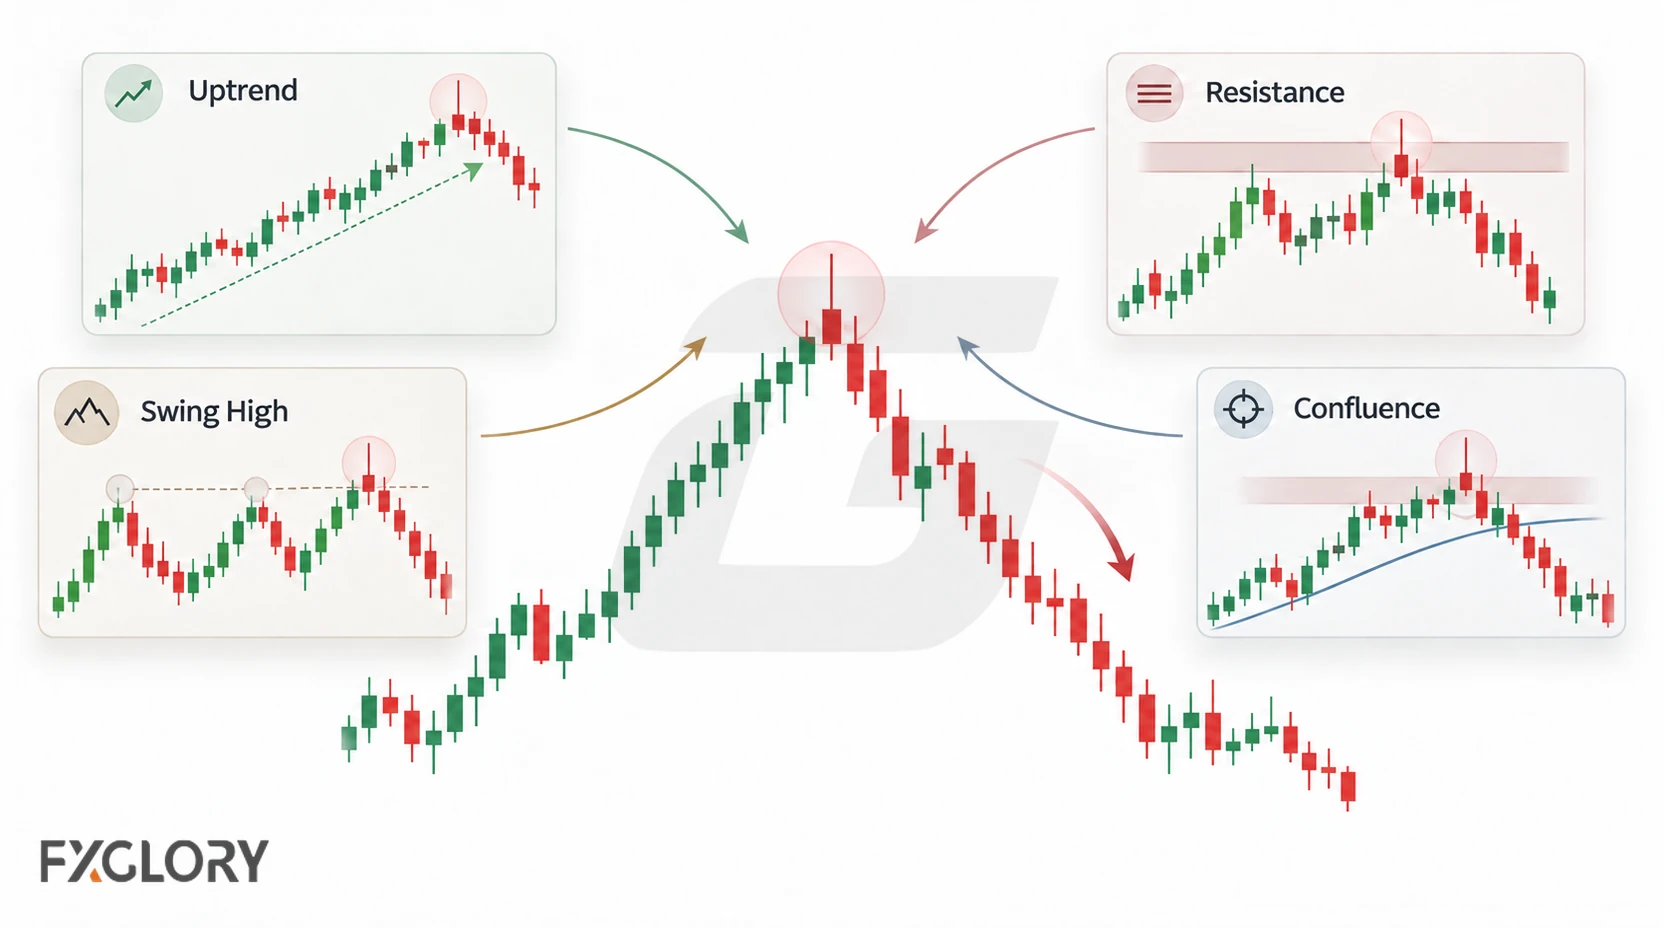
A clearer example combines recognizable candle geometry with a prior upward move and a chart level identified independently of the candle. Resistance, a recent swing high, and the upper boundary of a range may describe the same area rather than three independent confirmations.
| Question | Clearer example | Less persuasive example |
|---|---|---|
| Was there a preceding rise? | An advance or meaningful test of higher prices. | No discernible advance; sideways candles with long wicks in both directions. |
| Is the candle shape distinctive? | Small low-positioned body, dominant upper shadow, little lower shadow. | Upper shadow scarcely longer than the body, or a substantial lower shadow. |
| Where did it form? | At pre-identified resistance, a swing or range high, or a failed upside break. | Well within a range with no clear nearby reference level. |
| How does its size compare? | Wick and candle range can be interpreted against recent candles. | Unusually wide range during thin trading makes execution considerations especially important. |
A failed upside break is identifiable when price trades above an established level but closes back below it; a Shooting Star can show this within a single candle. The same candle near a range high may indicate a rejected test of that boundary. During a pullback within a broader downtrend, specify whether the candle is reacting at a resistance level or simply appears after a few rising bars.
These are contextual comparisons, not universal probabilities. A strong-looking Shooting Star at resistance can still be followed by rising prices.
How to Identify and Evaluate a Shooting Star
Use the following sequence to avoid confusing formation, interpretation, and a possible trade decision.
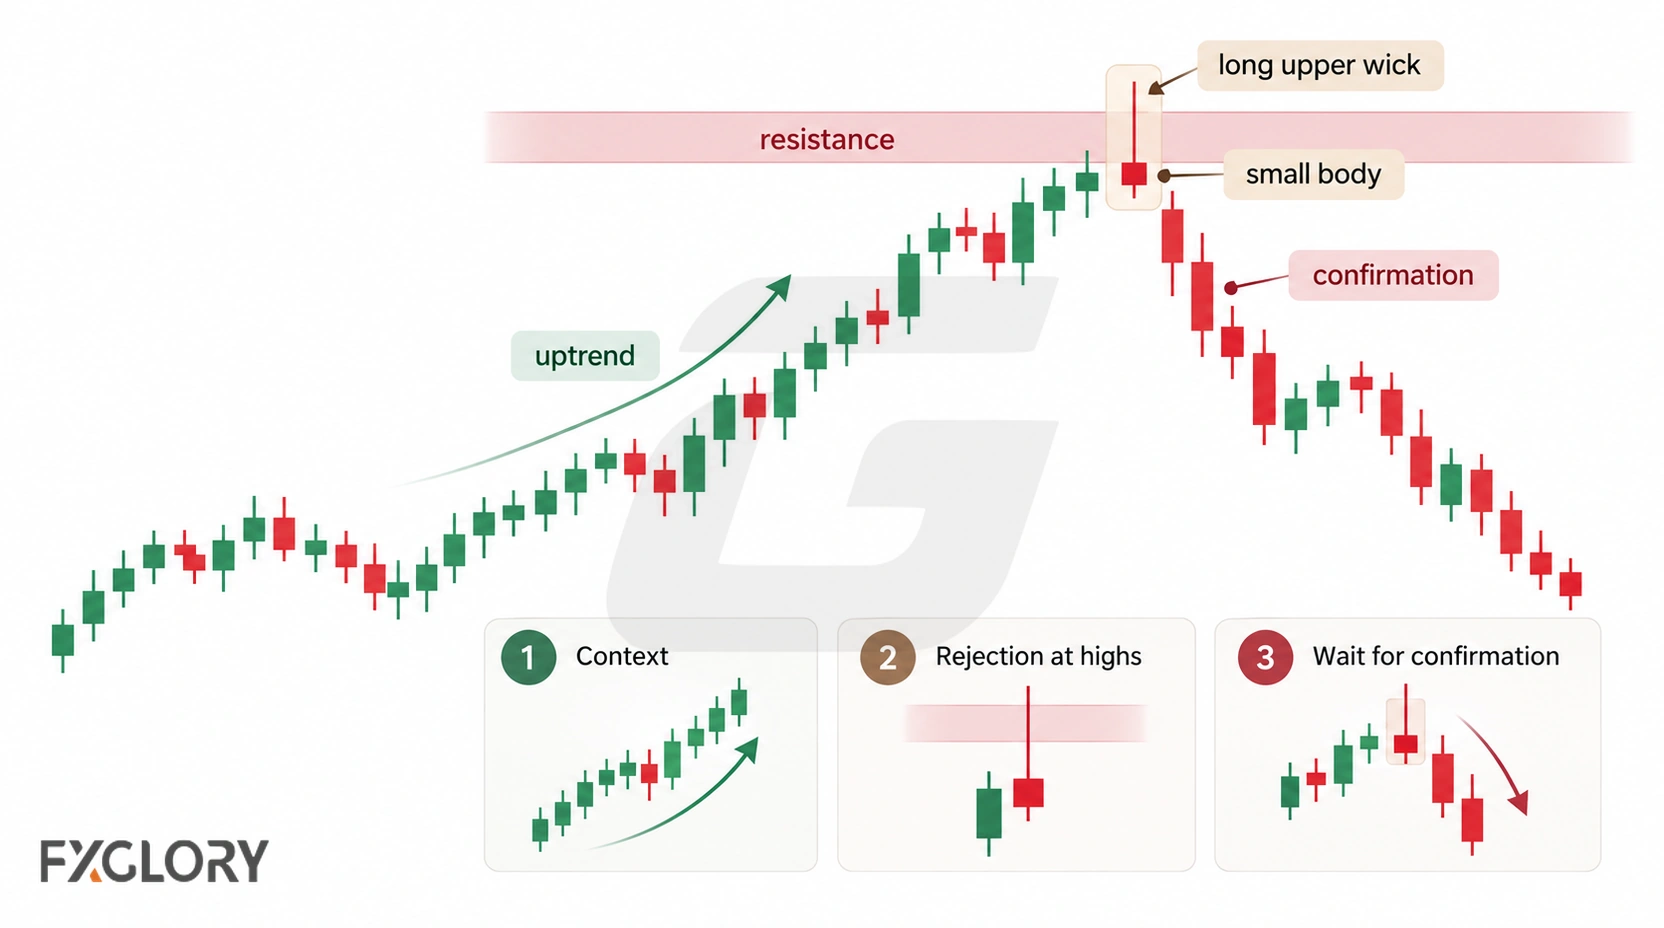
- Identify the completed candle: Check the small lower-positioned body, dominant upper shadow, and limited lower shadow after the candle closes.
- Establish the preceding move: Was there an advance, upward pullback, or test of higher prices? If not, distinguish the shape from the classic reversal pattern.
- Mark chart levels: Compare the high and close with already identifiable resistance, a swing high, or a range boundary.
- Assess later prices separately: A subsequent move below the candle low may support a bearish hypothesis; a recovery above the high may challenge it. Neither is necessary to identify the finished candle.
- Evaluate trade conditions only if relevant: Specify any entry trigger, invalidation rule, stop, position size, and trading costs before considering an order.
Some traders use RSI for momentum context, ATR for recent range-based volatility, or Bollinger Bands for relative location and range expansion. None individually validates the candle or predicts the next move.
Shooting Star Lookalikes and Failed Reversals
Calling every upper-shadow candle a “false Shooting Star” merges situations that need different explanations:
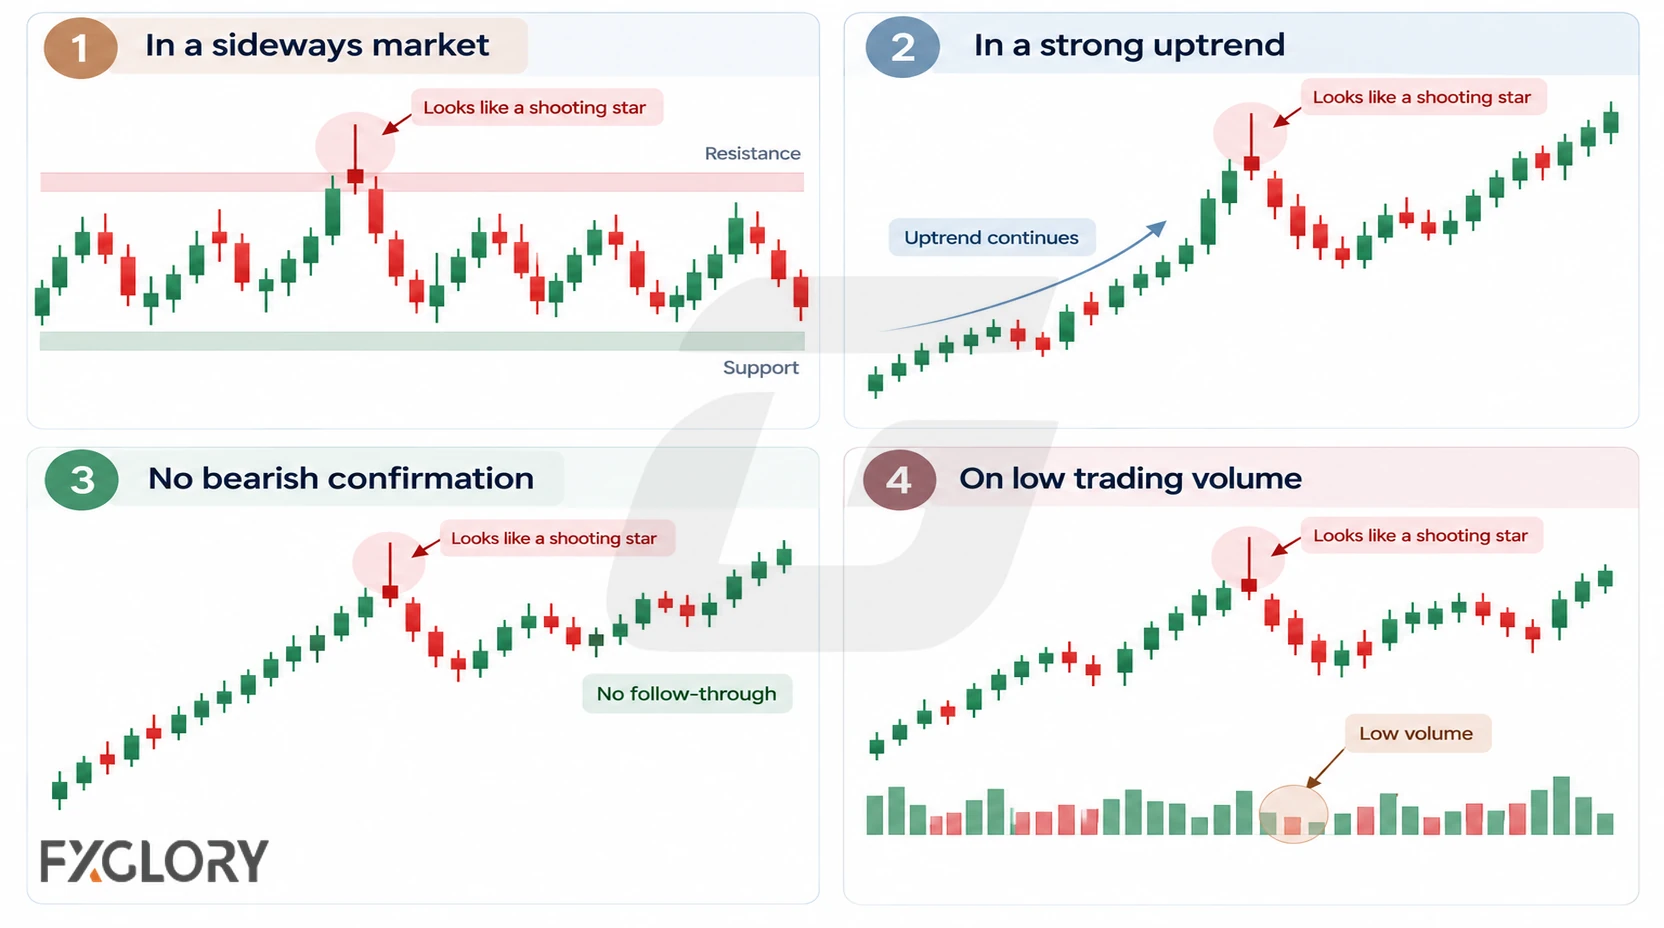
- Unfinished candidate or lookalike: The candle is still forming, its body is too central, or the upper shadow is not dominant enough to meet the chosen description.
- Matching shape in a different context: An upper-shadow candle occurs after falling prices, or mid-range without a preceding advance. It may be better classified differently or interpreted with less reversal significance.
- Completed Shooting Star without bearish follow-through: Subsequent price rises or exceeds the candle high. This may defeat a bearish hypothesis but does not change the completed candle geometry.
- Execution difficulty: A dramatic wick appears around a scheduled news release, rollover, or thin-liquidity session. The pattern may remain identifiable while spread and slippage complicate any attempted trade.
A large lower shadow is not evidence that a predetermined “lower area” failed to hold. It simply shows that price also traded below the body and recovered before the close; this makes the distinctive upper-shadow geometry less clear.
Trading Considerations and Limitations
Pattern recognition is not a complete trading rule. A trader might require a subsequent close below the Shooting Star low, a break of support, or another explicitly defined condition before entry. An intrabar move, completed close, and later retest are different events, not interchangeable meanings of “confirmation.”
A setup may use the Shooting Star high as an invalidation reference, but the appropriate stop depends on the selected strategy and execution conditions. Position size depends on the stop distance, pip or contract value, and predetermined account-risk limit; spread and slippage also matter. Elevated volatility alone does not prescribe a particular stop width or position size. For fuller treatment, see forex risk management.
What to Study After Shooting Star Candles
Continue with the pin bar guide for broader long-wick price action, the engulfing candle guide for a two-candle reversal structure, or forex candlestick pattern categories for a wider comparison.