

What Is A Dragonfly Doji In Forex?
A dragonfly doji in forex is a single-candle doji subtype with a long lower shadow and the open, high, and close near the same upper level. The candle often looks like a capital T because most of the visible range sits below the open-close area.
In forex education, “dragonfly forex” usually refers to the dragonfly doji candle as it appears on a currency-pair chart.
The basic structure shows that price moved lower during the candle period, but recovered back near the opening and high area before the candle closed. This creates a doji-like body near the top of the candle and a long lower shadow beneath it.
A strict dragonfly doji has the open, high, and close at the same or almost the same price, with no upper shadow. In modern forex chart reading, a near-dragonfly doji may still be reviewed when the body is tiny, the upper shadow is absent or very small, and the lower shadow clearly dominates the candle.
After a decline, the shape is conventionally interpreted as a possible bullish reversal signal, not confirmation that price will rise. Later price movement determines whether that scenario develops.
If you need the basic doji idea first, review the open-close balance behind doji candles. Dragonfly doji uses the same small-body idea, but adds a long lower shadow and a top-side open-close area.
Dragonfly Doji Anatomy
The anatomy of a dragonfly doji has three main parts: a doji-like body near the high, little or no upper shadow, and a long lower shadow. The lower shadow is the feature that separates dragonfly doji from a plain doji.
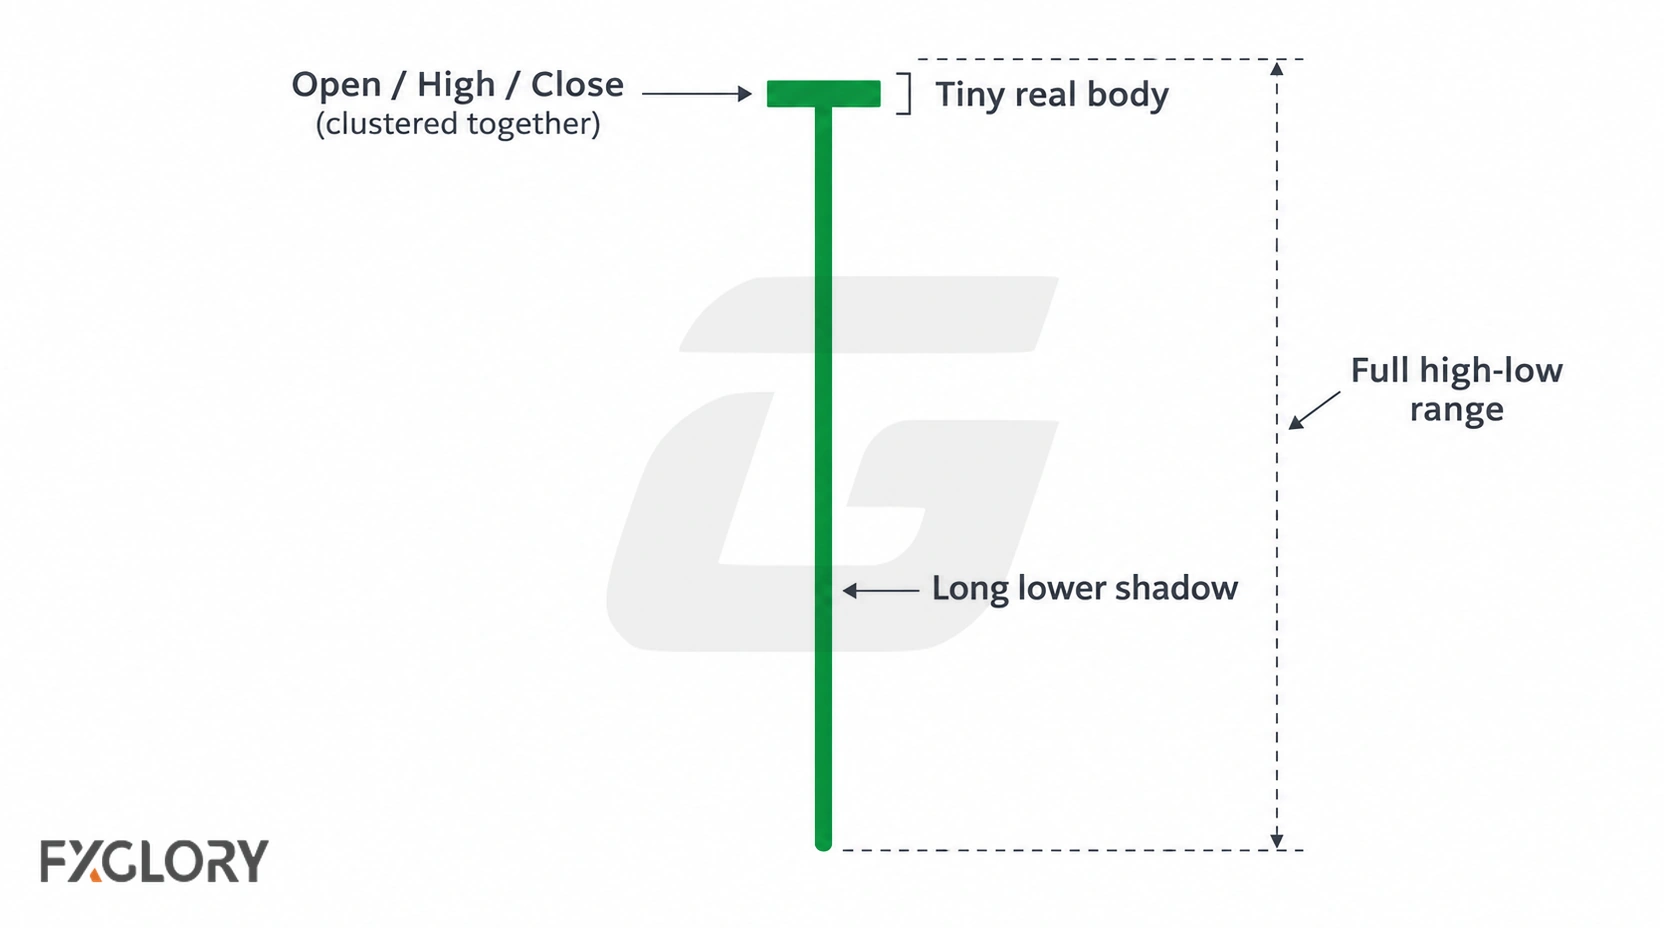
Candle color is secondary. A green or red dragonfly-like candle can still be reviewed if the open and close remain close together near the high and the lower shadow clearly dominates.
| Dragonfly Doji Part | Common Structure | What It Shows | Reading Caution |
|---|---|---|---|
| Open | Near the candle high. | The candle begins near the upper part of its range. | If the open is far from the high, the structure may be weaker. |
| High | Near the open and close. | There is little or no movement above the doji body. | A visible upper shadow weakens the strict version. |
| Close | Near the open and high. | Price recovered back toward the upper level before completion. | If the close is far from the open, the candle may not be a doji. |
| Real body | Tiny or nearly absent. | Open and close ended close together. | A large body rules out a strict doji; a hammer classification requires its own body, shadow, and trend-context criteria. |
| Lower shadow | Long and clearly dominant. | Price tested lower levels and recovered before the close. | A short lower shadow may not show meaningful rejection. |
| Upper shadow | None or very small. | The candle has a clean T-shaped profile. | A substantial upper shadow does not meet strict dragonfly criteria; classify the candle using its full structure. |
A candle should not be called dragonfly doji while it is still forming. A late move before the close can create a larger body, add an upper shadow, or reduce the lower-shadow message.
Strict vs Near-Dragonfly Doji
A strict dragonfly doji has a nearly perfect T shape: open, high, and close at the same or almost the same price, no upper shadow, tiny or absent body, and a long lower shadow.
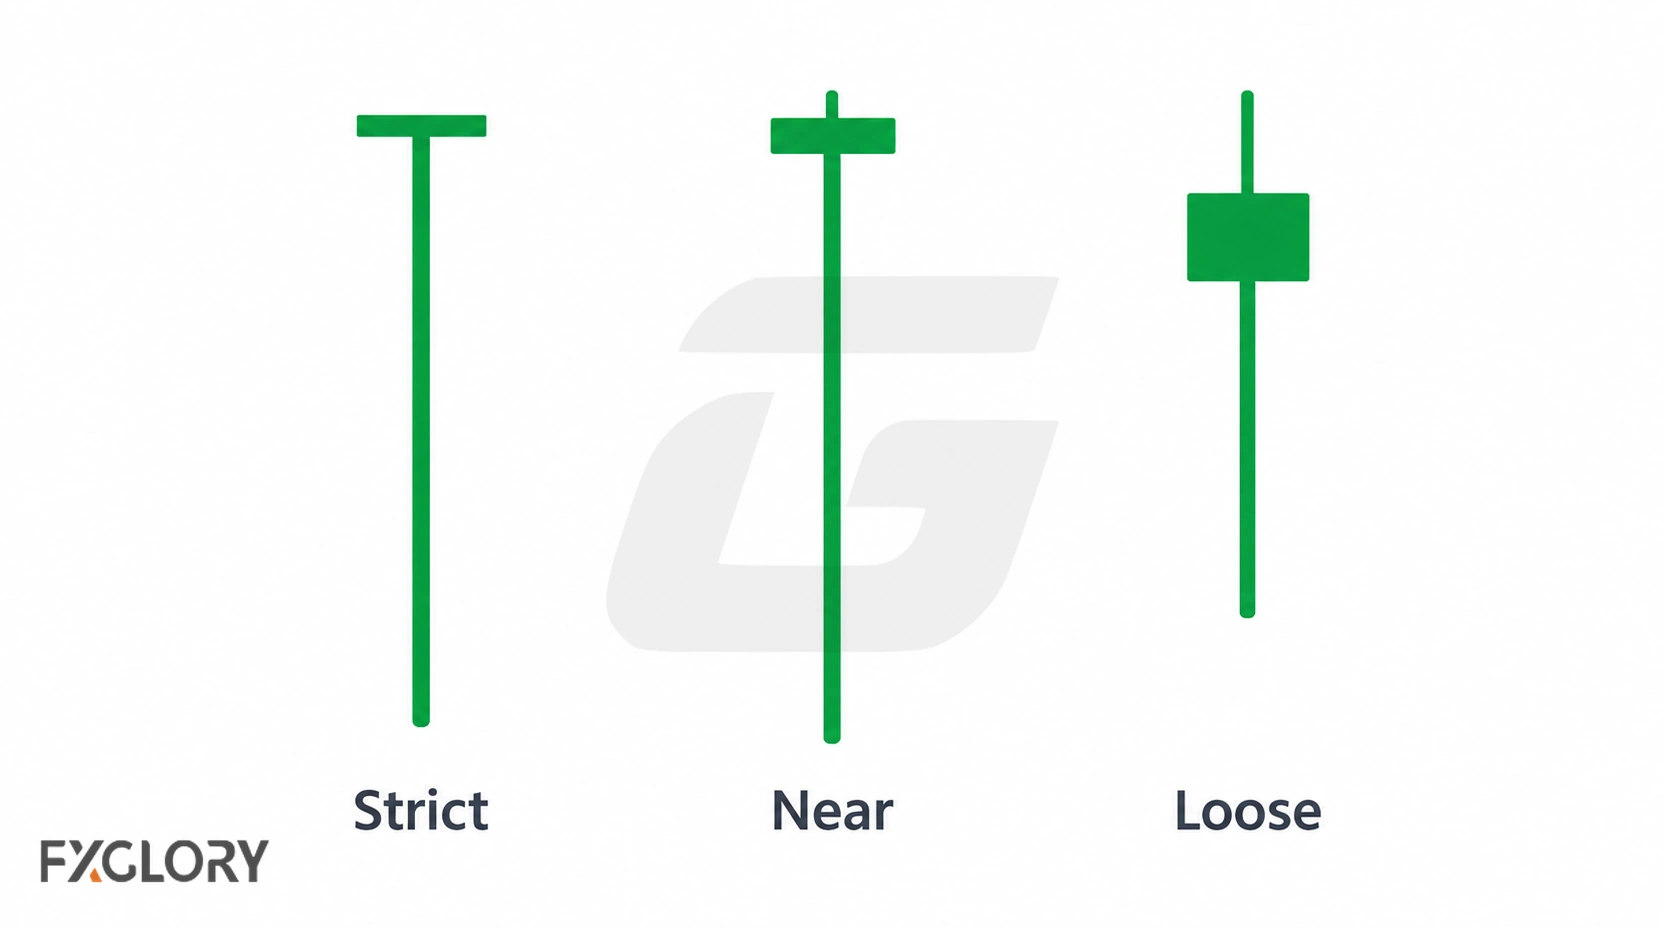
The strict definition requires a long lower shadow and a close near both the open and high. A candle that does not meet those conditions should not be labelled a strict dragonfly doji, regardless of how often similar-looking candles occur.
Forex charts may show slight variations because of spread, platform feeds, liquidity, and timeframe selection. A near-dragonfly doji may have a very small body or a tiny upper shadow, but the candle should still clearly show a doji-like top and a long lower shadow.
If the body is distinctly larger or the upper shadow substantial, the candle may not qualify as a dragonfly doji. Whether it meets another pattern definition depends on the complete real-body and shadow proportions and the relevant chart context.
| Structure | What It Looks Like | Possible Reading | Reading Caution |
|---|---|---|---|
| Strict dragonfly doji | Open, high, and close nearly aligned; no upper shadow; long lower shadow. | Cleanest lower-shadow doji structure. | Still needs chart context. |
| Near-dragonfly doji | Tiny body or tiny upper shadow, with dominant lower shadow. | May still show lower-price rejection. | Only acceptable when the top area remains tight. |
| Loose lookalike | Visible body, visible upper shadow, or weak lower shadow. | The candle may no longer be a clean dragonfly doji. | Do not assign another pattern label without checking its defining structure. |
Why The Long Lower Shadow Matters
The long lower shadow is the main visual feature of a dragonfly doji. It shows that price moved significantly below the open-close area during the candle period, then recovered before the candle closed.
As a practical visual guide, the lower shadow is often at least two to three times the size of the tiny body, but the main requirement is that the lower shadow clearly dominates the candle. This is a structure guide, not a guarantee of what price will do next.
If the lower shadow is short, the candle may not meet the dragonfly definition. A large real body rules out a strict doji; it does not automatically make the candle a hammer.
| Lower Shadow Condition | Possible Reading | Reading Caution |
|---|---|---|
| Very long lower shadow | Lower-price rejection is easier to see. | Still needs chart location and completed candle structure. |
| Moderate lower shadow | Some lower test and recovery may be visible. | The candle may be less clean as a dragonfly doji. |
| Short lower shadow | Weak lower-price rejection. | Usually not a useful dragonfly reading. |
| Long lower shadow with large body | Lower rejection may exist, but the doji structure is weak. | Not a strict doji. A hammer requires a small body near the high, a dominant lower shadow, little upper shadow, and suitable preceding price context. |
What Dragonfly Doji Shows About Buyer And Seller Pressure
The candle records a low below its opening level followed by a close near the open and high. This supports an interpretation of lower-price rejection during the period, but OHLC values alone do not identify which participants caused each move or prove a lasting change in market pressure.
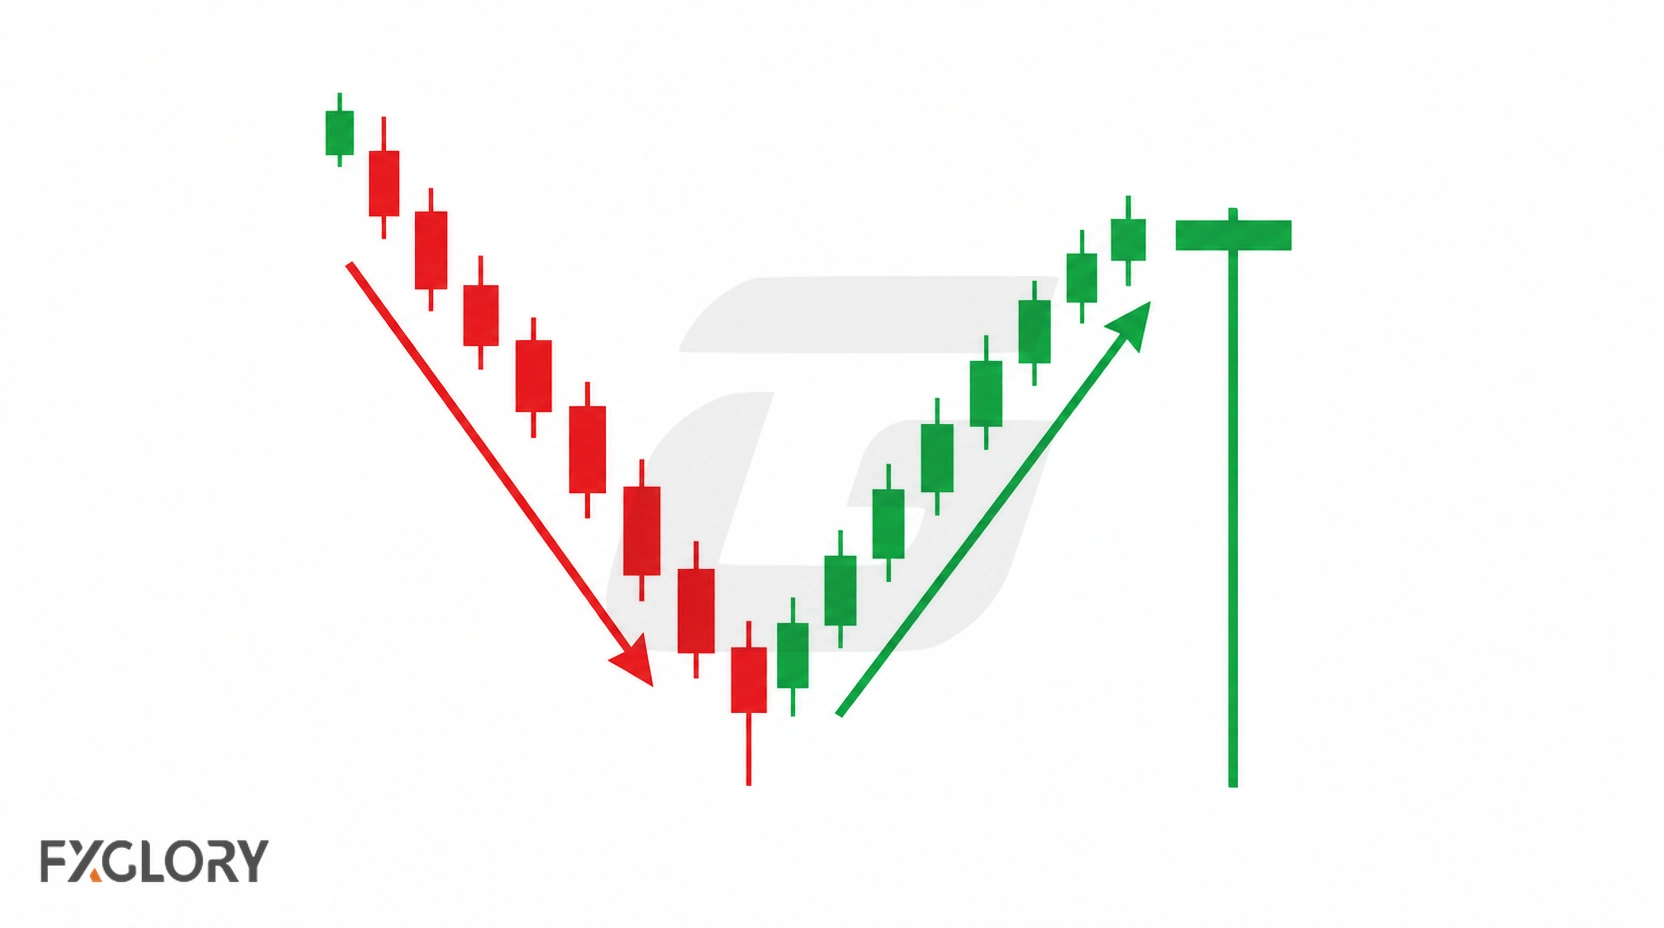
The recorded recovery does not establish what the next candle or trend will do.
The pressure message becomes clearer when the candle appears after selling pressure or near a lower-price area that already matters on the chart. In a sideways range away from an established boundary, the candle has no comparable support-level test to interpret.
Dragonfly Doji After A Downtrend
After a decline, a dragonfly doji shows that price traded below the opening area but recovered near the high by the close. This is commonly read as a possible bullish reversal setup, although subsequent price action may not confirm it.
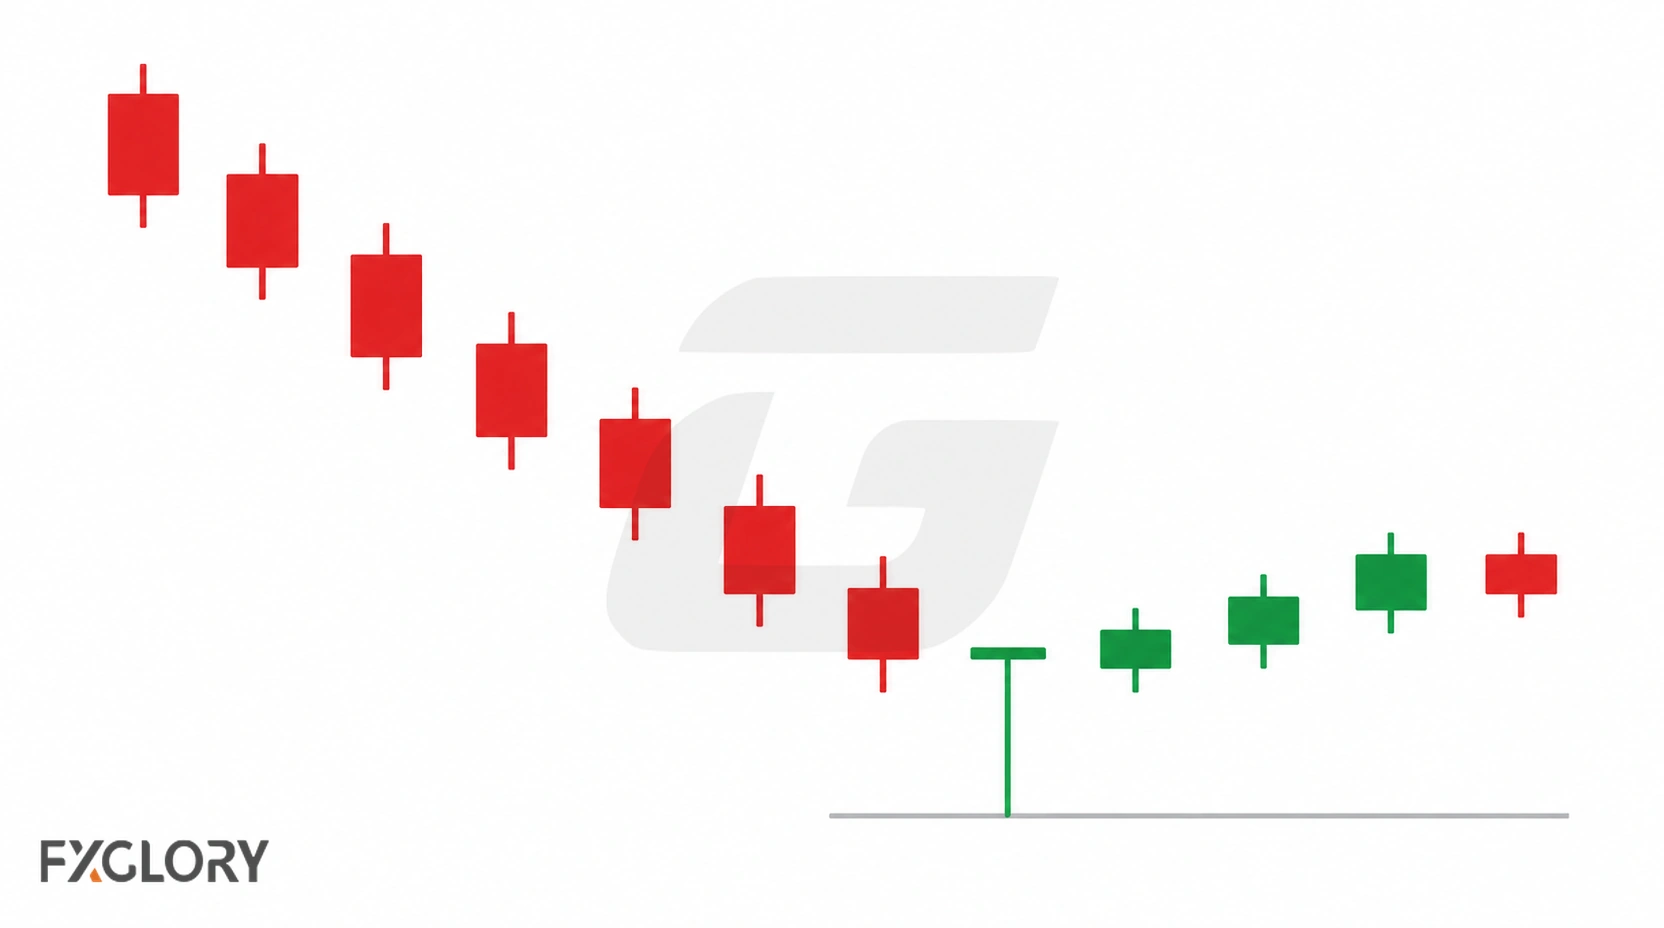
After a decline, compare the candle’s low and close with a recent swing low or established support level. This shows whether the recovery occurred at a previously tested price area.
A later move above the candle high may support a bullish interpretation; a decisive break below its low would undermine that scenario. Neither outcome changes the original candle’s OHLC structure.
- Clearer context: Prior selling pressure, lower-price test, long lower shadow, tiny body near the high, and useful chart location.
- Weaker context: No prior selling pressure, short lower shadow, visible upper shadow, large body, or messy range conditions.
Dragonfly Doji After An Uptrend Or In Consolidation
A dragonfly doji can also appear after buying pressure or inside consolidation. In those settings, the candle should be read more carefully because the lower shadow may not carry the same meaning as it would after a decline.
After an uptrend, the candle still records a lower intraperiod test and recovery. It does not by itself distinguish a continuation pause from a developing reversal; compare the next candles with the prior trend and nearby levels.
Within consolidation, location changes the question being tested. Near a well-defined range low, the candle can be compared with the boundary; near the middle of the range, it does not test that same support reference. This is a contextual distinction, not a measured difference in success rate.
Where Dragonfly Doji Matters More
Compare the candle’s low with levels established before it formed: a support zone, prior swing low, or range boundary. Its position relative to those levels helps define the scenario being evaluated.
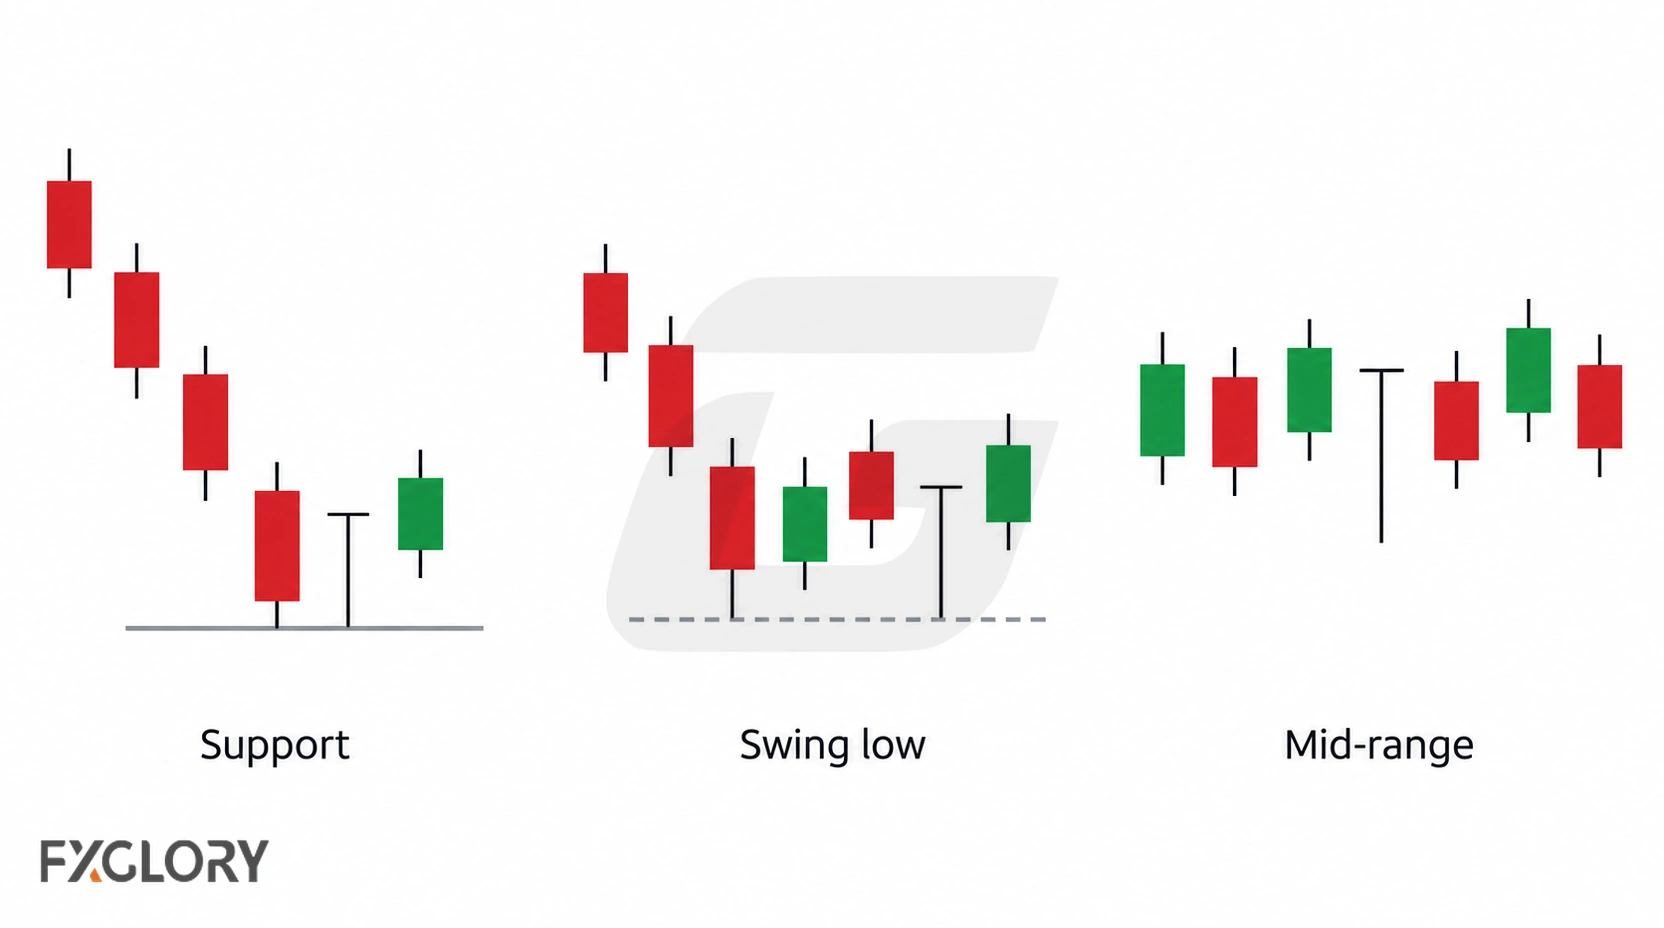
Near Support
A dragonfly doji near support can show that price tested below or into a lower-price area and recovered before the close. The support area gives the lower shadow a clearer reference point.
Near A Swing Low
A swing low gives the candle a visible chart reference. If price tests a lower area and prints a dragonfly doji, the lower shadow can be compared with the earlier low.
At A Range Low
At the lower boundary of an established range, check whether the candle briefly traded beneath the boundary and closed back inside it, or simply tested the boundary without breaking it.
After A Failed Downside Push
A dragonfly doji can appear after price pushes lower and then recovers inside the same candle period. This can show that the lower move lost control before the close, but the candle still needs follow-up movement.
During News Or Abnormal Volatility
A long lower shadow during news, rollover, a market open, or thin liquidity can be difficult to interpret. The final candle may look clean after the fact, while real-time spread and execution conditions were unstable.
Dragonfly Doji vs Gravestone Doji
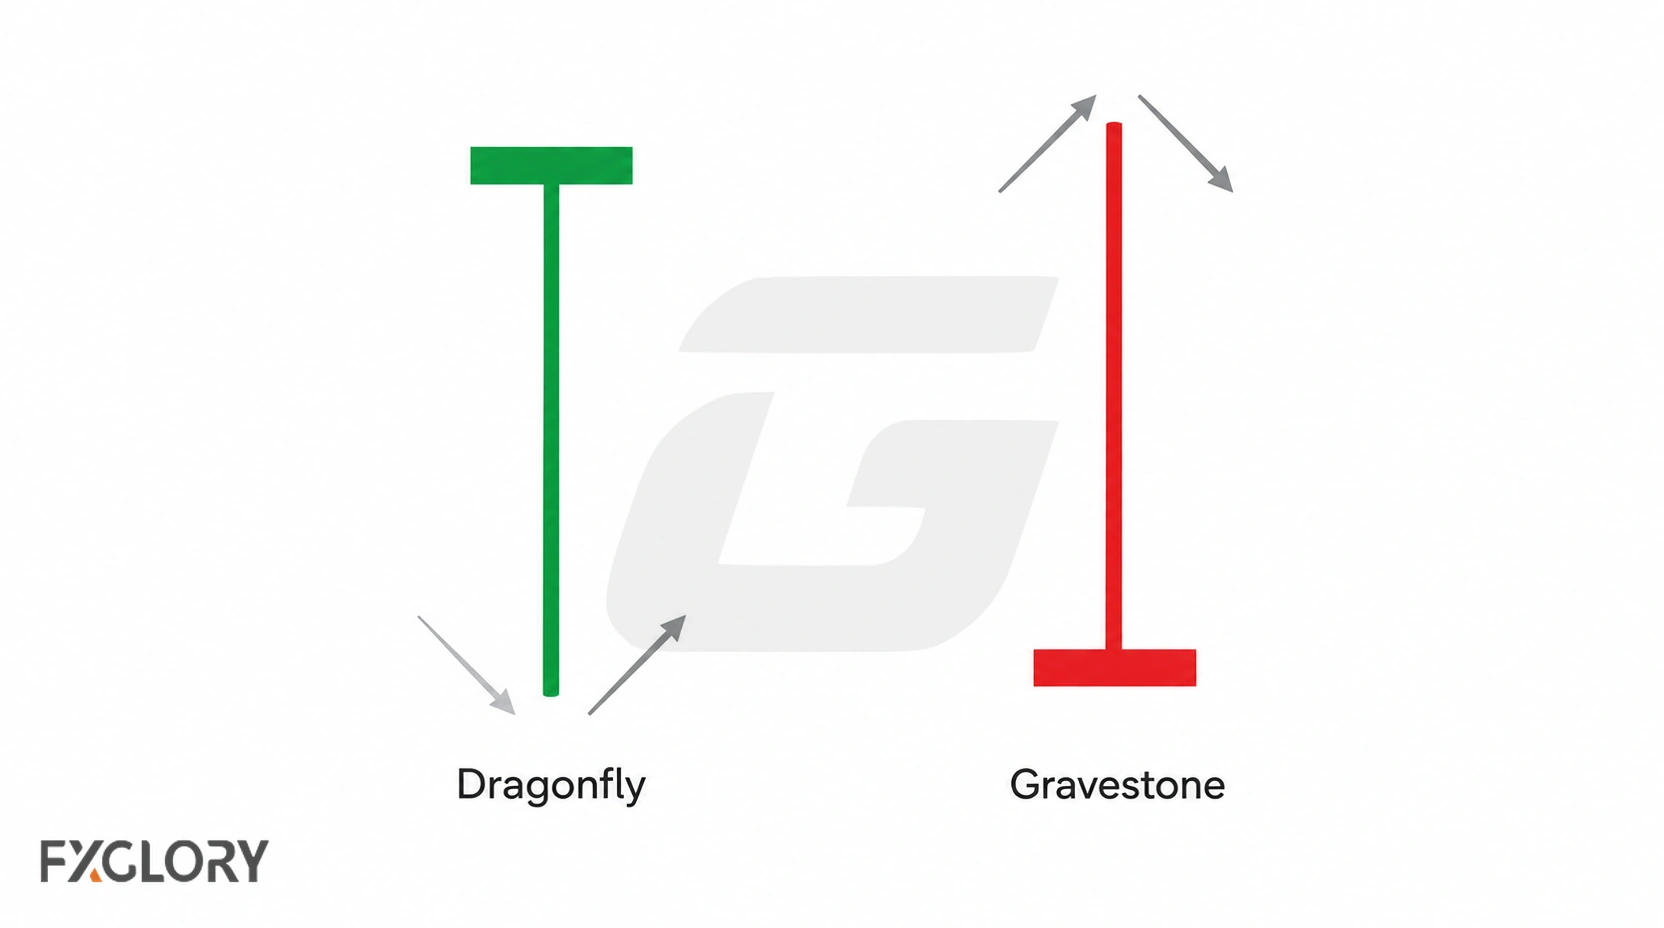
Dragonfly doji and gravestone doji are opposite doji subtypes. Both are single-candle patterns with a tiny or absent real body, but their shadows point in opposite directions.
| Doji Type | Main Structure | Common Pressure Reading | Main Difference |
|---|---|---|---|
| Dragonfly doji | Open, high, and close near the same upper level, with a long lower shadow. | Lower-price rejection during one candle period. | Long shadow is below the body. |
| Gravestone doji | Open, low, and close near the same lower level, with a long upper shadow. | Higher-price rejection during one candle period. | Long shadow is above the body. |
Use the gravestone comparison only to separate the structures. Dragonfly doji has a dominant lower shadow; gravestone doji has a dominant upper shadow.
Dragonfly Doji vs Hammer
Dragonfly doji and hammer candles can look similar because both can have long lower shadows and little or no upper shadow. The difference is the real body.
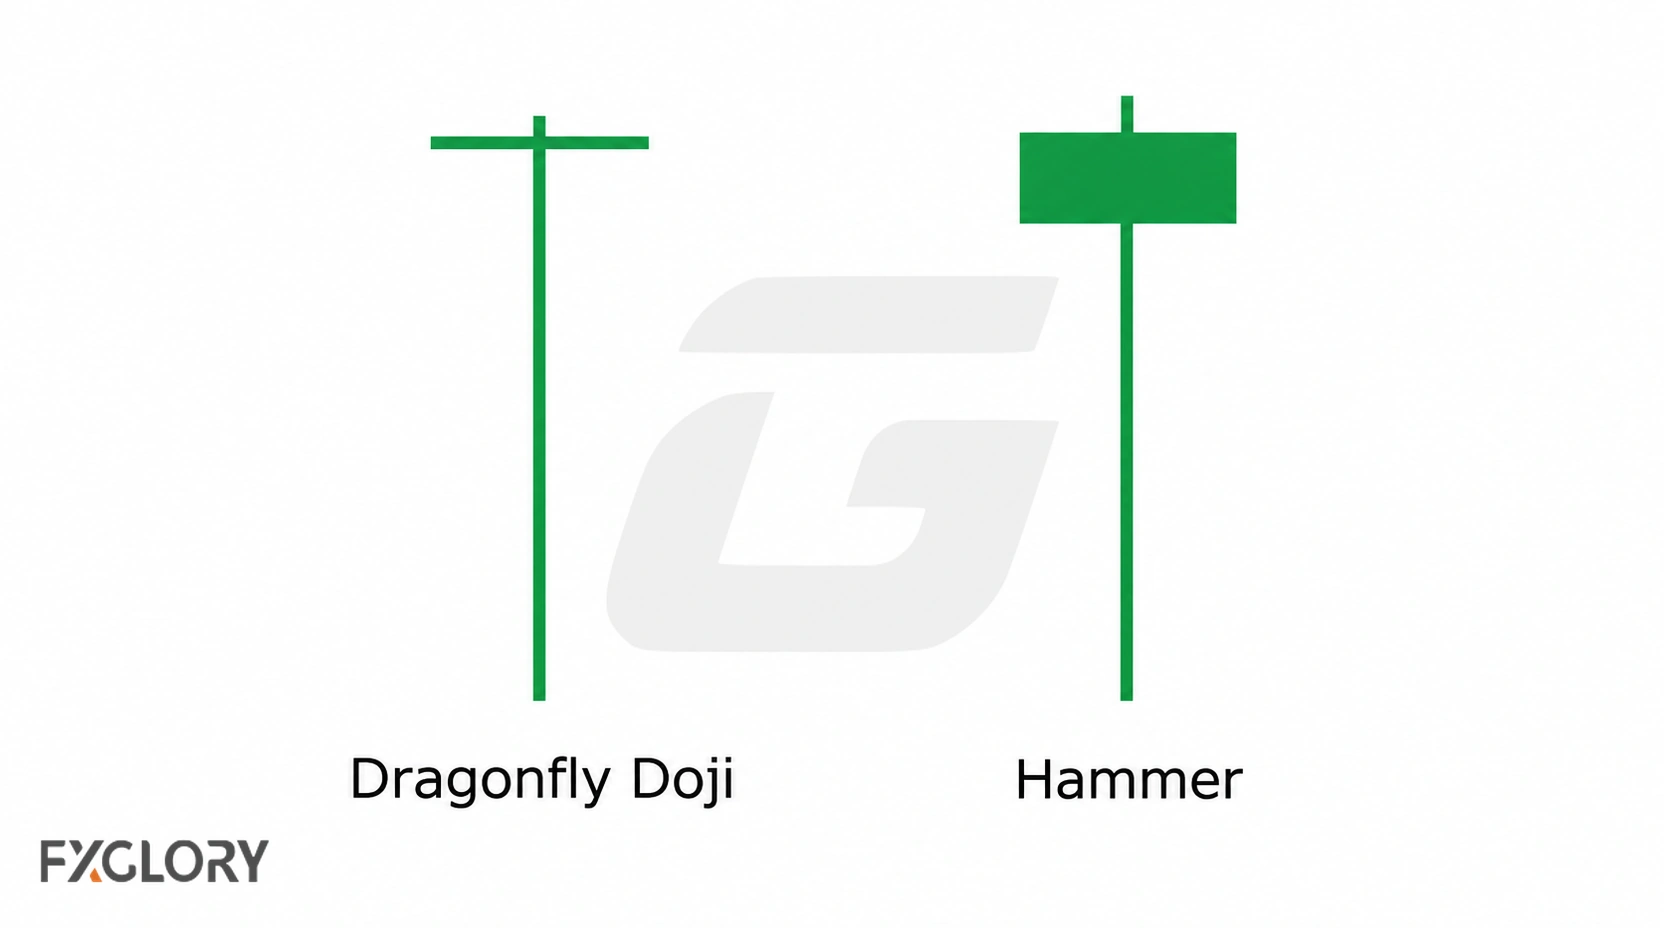
A dragonfly doji has a doji-like body near the candle high, where the open and close are the same or nearly the same. A hammer has a small real body near the high, but the open and close do not need to be nearly equal.
| Candle | Main Structure | Main Difference |
|---|---|---|
| Dragonfly doji | Tiny or absent body near the high, long lower shadow. | Doji-like open-close balance at the upper level. |
| Hammer | Small body near the high, long lower shadow after selling pressure. | Lower-wick rejection candle, not necessarily a doji. |
For the small-bodied lower-wick candle, use the hammer candle structure after selling pressure. Dragonfly doji should stay focused on the open-close alignment near the candle high.
Dragonfly Doji vs Long-Legged Doji And Spinning Top
Dragonfly doji can also be confused with long-legged doji and spinning top candles. These patterns all involve small bodies, but their wick structures are different.
| Candle | Main Structure | Main Difference From Dragonfly Doji |
|---|---|---|
| Dragonfly doji | Tiny body near the high, long lower shadow, little or no upper shadow. | Lower shadow dominates the candle. |
| Long-legged doji | Tiny body with long upper and lower shadows. | Both sides show wide movement, not only lower rejection. |
| Spinning top | Small body with upper and lower shadows. | Body is small but not necessarily doji-like, and both shadows matter. |
| Inverted hammer | Small body with long upper wick after selling pressure. | Upper wick dominates, not lower shadow. |
For related small-body structures, compare the two-sided spinning-top candle and the upper-wick inverted-hammer structure.
Dragonfly Doji vs The Doji Parent Pattern
Dragonfly doji belongs to the doji family, but it should not replace the broader doji topic. The doji parent pattern focuses on the open and close being close together. Dragonfly doji adds a specific shadow structure.
| Pattern | Main Focus | Main Difference |
|---|---|---|
| Doji candle | Open and close are the same or nearly the same. | Broad family of small-body balance candles. |
| Dragonfly doji | Open, high, and close near the same upper level, with a long lower shadow. | Specific doji subtype focused on lower-price rejection. |
For the broader family, use the general doji candle guide. This dragonfly page should stay focused on the long lower-shadow subtype.
Dragonfly Doji Strength Filter: Stronger vs Weaker Readings
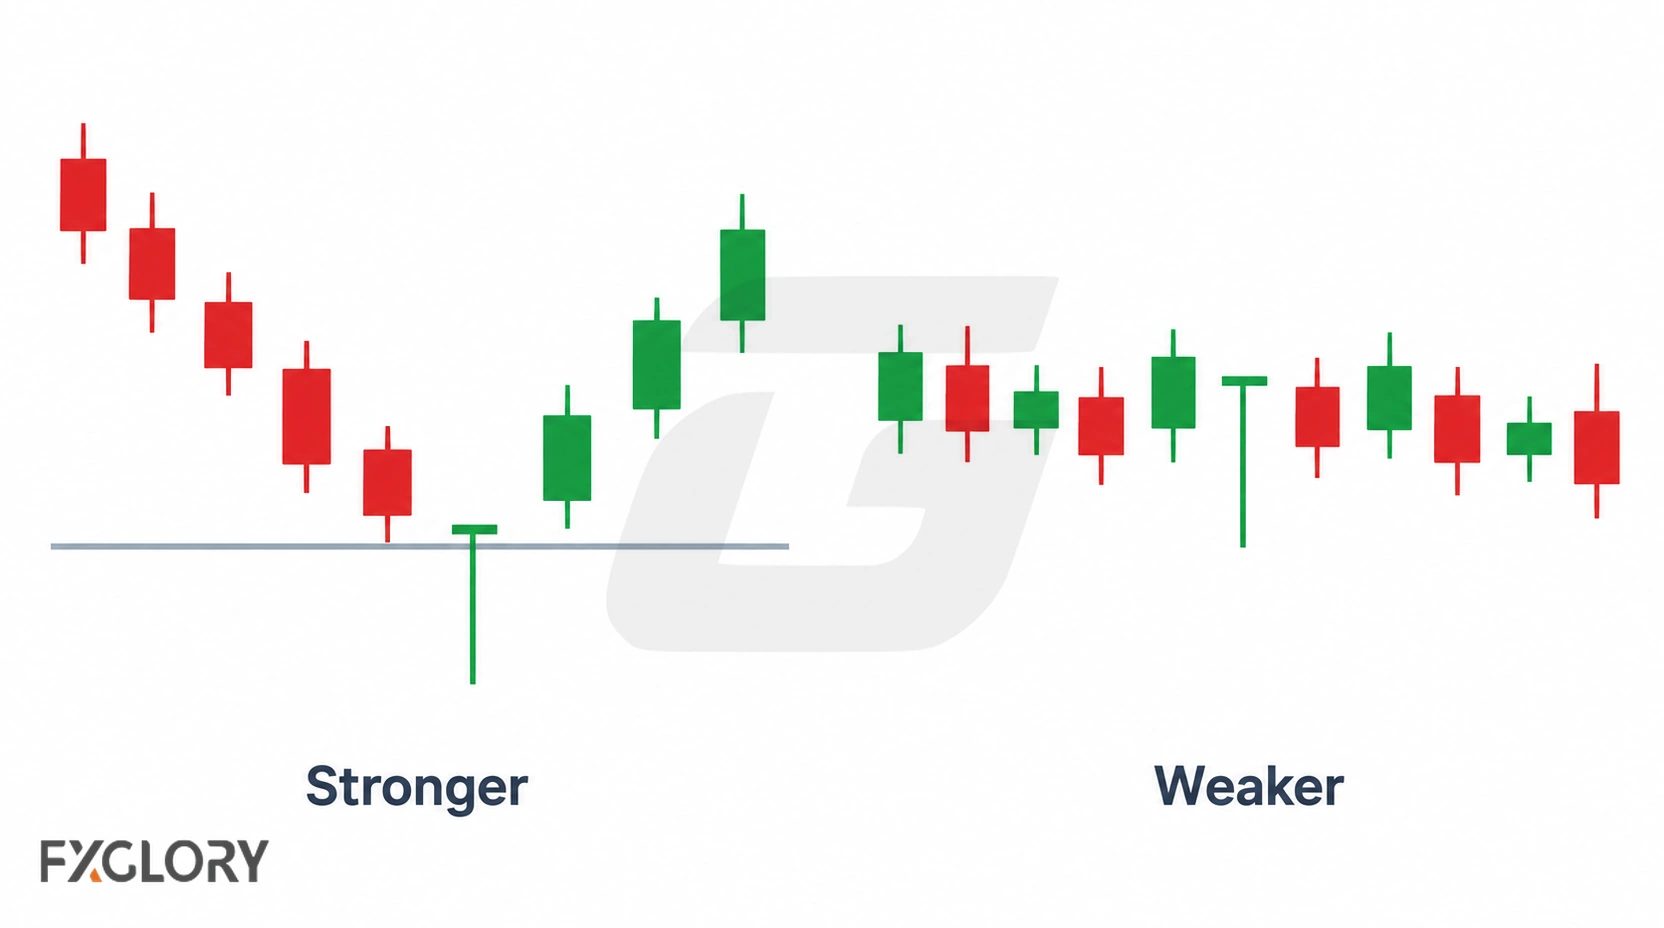
The table distinguishes structural quality, identifiable chart context, and subsequent price behavior. These are reading criteria rather than measured success-rate rankings.
| Dragonfly Doji Factor | Clearer Reading | Weaker Reading |
|---|---|---|
| Body position | Open and close sit near the high. | Body sits away from the high or becomes too large. |
| Upper shadow | No upper shadow or only a tiny one. | Visible upper shadow weakens the strict dragonfly structure. |
| Lower shadow | Long lower shadow clearly dominates the candle. | Short lower shadow does not show meaningful lower rejection. |
| Body size | Tiny or nearly absent real body. | A substantial body fails strict doji criteria; classify it separately. |
| Prior movement | Appears after selling pressure or a lower-price test. | Appears without useful prior movement or context. |
| Chart location | Forms near support, swing low, range low, or a failed downside push. | Forms away from identifiable support, prior lows, or range boundaries within sideways trading. |
| Market conditions | Spread and volatility conditions are stable enough for chart review. | Forms during abnormal news movement, rollover, or thin liquidity. |
| Completed candle | The candle has fully closed. | The candle is still forming and can change shape. |
| Follow-up movement | Later price movement keeps the candle area relevant. | Price immediately makes the candle area irrelevant. |
Dragonfly Doji Forex Reading Table
The table below shows how the same dragonfly doji structure can change depending on chart location and candle quality.
| Dragonfly Doji Situation | Possible Reading | What To Check Next |
|---|---|---|
| After selling pressure | Lower prices were tested and rejected during the candle. | Check whether follow-up movement keeps the candle area relevant. |
| Near support | The long lower shadow formed around a lower-price area already visible on the chart. | Check whether support remains relevant. |
| Near a swing low | The candle appeared around a previous lower turning area. | Compare the lower shadow with the earlier low. |
| At a range low | The candle formed near the lower boundary of a range. | Check whether the range boundary remains respected. |
| After an uptrend | The candle shows lower intraperiod testing and recovery. | Check whether the chart is extended or entering consolidation. |
| Inside consolidation | The candle may be ordinary range movement. | Check whether it appears near a meaningful boundary. |
| During news volatility | The long lower shadow may reflect unstable movement. | Review spread, candle range, and execution conditions. |
How To Read A Dragonfly Doji In Forex
A simple workflow helps keep dragonfly doji reading disciplined. The goal is to describe the candle structure before giving it more meaning than it deserves.
- Check the candle close: Review the candle only after it has completed.
- Check the doji body: Confirm that the open and close are the same or nearly the same.
- Check the body position: Review whether the open and close sit near the candle high.
- Check the upper shadow: Confirm that the upper shadow is absent or very small.
- Check the lower shadow: Review whether the lower shadow clearly dominates the candle.
- Compare with hammer: Check whether the body is truly doji-like or only a small hammer body.
- Check chart location: Look for support, swing lows, range lows, failed downside pushes, or consolidation boundaries.
- Review market conditions: Consider volatility, spread, liquidity, rollover, and scheduled news events.
- Watch follow-up movement: Review whether price keeps the dragonfly doji area relevant or cancels the reading.
Some traders compare dragonfly doji candles with technical indicators for additional context. For example, RSI can add momentum context, MACD can add trend-momentum context, ATR can add volatility context, and Bollinger Bands can help review range and expansion conditions. These tools can support candle review, but they do not remove trading risk.
Some traders also review activity or volume-style tools around a dragonfly doji, but spot forex volume is usually broker/platform-specific and should not be treated as a complete confirmation by itself.
False Dragonfly Doji Patterns In Forex
Two different issues are often called a false dragonfly doji. A candle may fail the structural definition because its body or shadows do not meet the criteria, or a structurally valid dragonfly doji may be followed by price action that does not support the anticipated bullish reversal. A subsequent decline does not retroactively change the candle’s identity.
Unfinished Candle
A candle can look like a dragonfly doji before it closes and then finish with a larger body, a visible upper shadow, or a weaker lower shadow. Dragonfly doji should be reviewed after the candle has closed.
Body Too Large
If the real body is too large for a doji, the candle fails the dragonfly definition. Evaluate any alternative candle type against its own requirements.
Visible Upper Shadow
A strict dragonfly doji has no upper shadow. A tiny upper shadow may be acceptable, but a visible upper shadow weakens the structure and may place the candle closer to another doji type.
Weak Lower Shadow
If the lower shadow does not clearly dominate the candle, the lower-price rejection message becomes weak.
Middle Of A Range
Within the middle of a defined range, the candle does not test the range-low boundary. It may still meet the dragonfly structure, but a support-rejection interpretation needs a separate reference level.
Lower-Timeframe Noise
Lower timeframes do not invalidate the structure. Compare candle size with spread and nearby price levels, since these can materially affect how a small candle appears and how an attempted trade might execute.
News Or Low-Liquidity Conditions
Major news, rollover, market opens, and thin liquidity can create long lower shadows that are difficult to interpret in real time. Spread and execution conditions may be unstable even when the final candle looks clean.
- Structural mismatch: A candle with the wrong body or shadow proportions is not a strict dragonfly doji.
- Unconfirmed reversal: A valid candle can form without a subsequent bullish reversal.
- Execution conditions: News, spread changes, and thin liquidity can complicate interpretation and trading around the candle.
Common Mistakes With Dragonfly Doji In Forex
Dragonfly doji is easy to label after a long lower shadow appears, but it is also easy to overread. Most mistakes come from treating one lower-shadow doji as a complete reversal answer.
- Calling every long lower-wick candle dragonfly doji: The open and close should be equal or nearly equal near the high.
- Confusing identification with outcome: A valid dragonfly doji does not guarantee an upward reversal.
- Assuming a support test: Check whether the candle actually formed near an established price level rather than in the middle of a range.
- Overlooking spread, liquidity, and news risk: Long shadows can appear during unstable conditions that are difficult to interpret in real time.
- Replacing risk planning with candle confidence: Dragonfly doji should not replace position sizing, risk limits, or a clear area where the reading becomes weak.
What To Study After Dragonfly Doji
After learning how to read dragonfly doji, the next step is to compare it with broader doji structures, lower-wick candles, and multi-candle reversal-focused formations.
You can compare dragonfly doji with the broader doji candle family, the hammer lower-wick candle, the spinning top candle, or the full-body marubozu candle. For nearby multi-candle comparisons, review the matching-low tweezer structure and the morning star sequence. For a wider map of candle formations, return to forex candlestick pattern groups.