
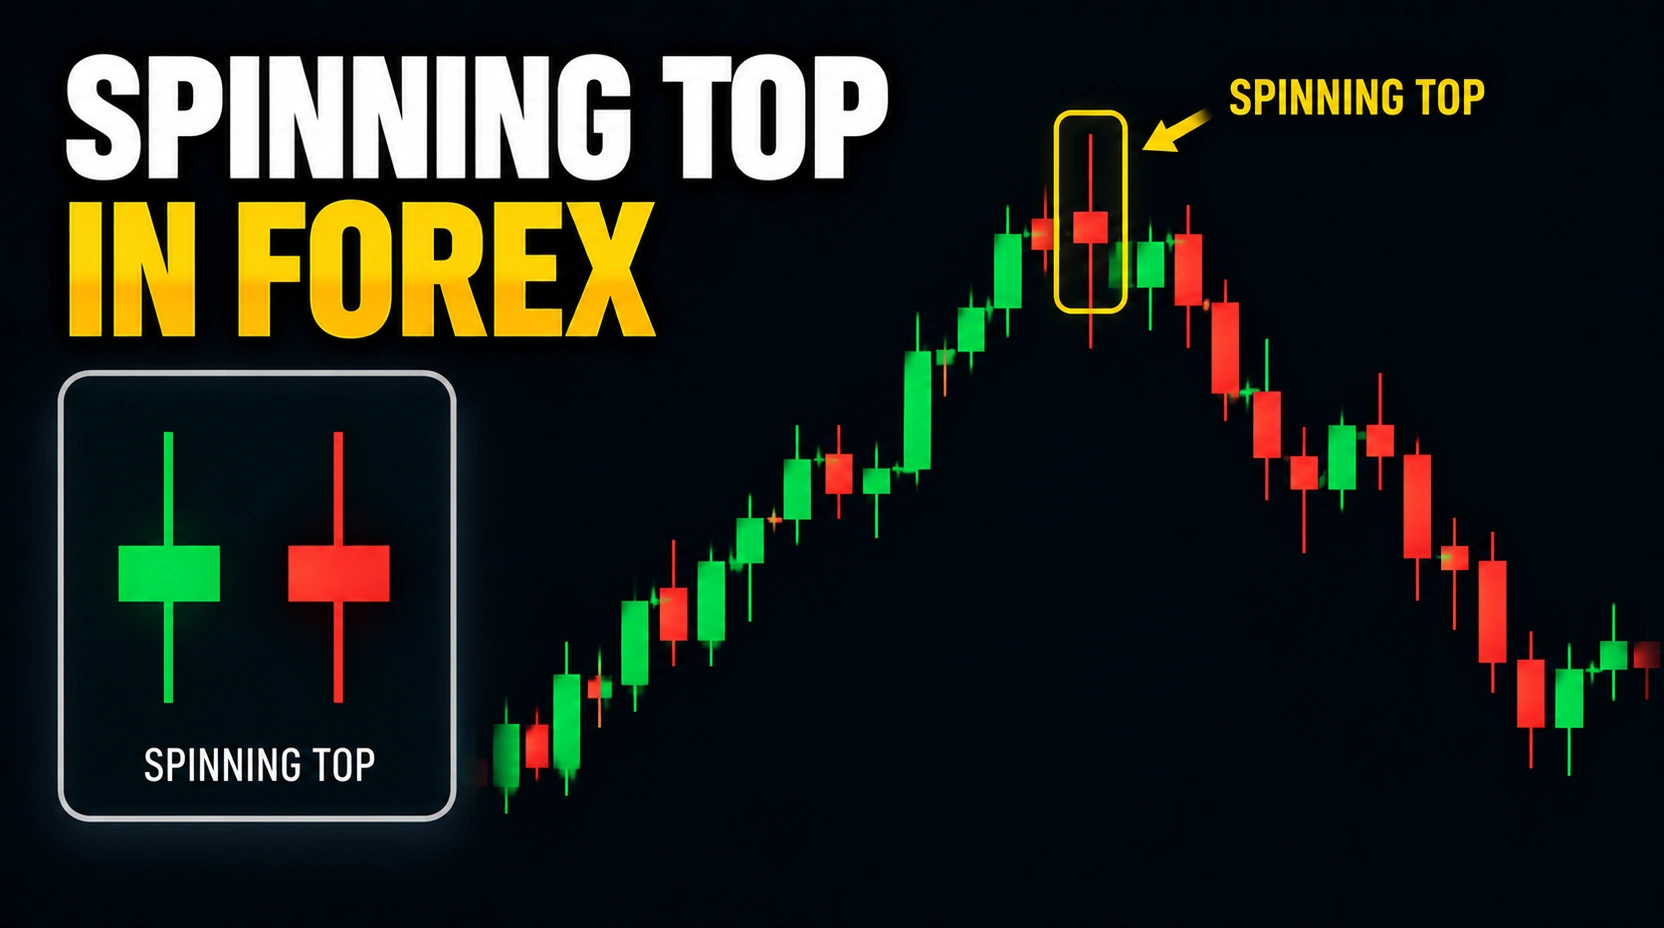
What Is a Spinning Top Forex Candle?
A spinning top forex candle has a small but visible real body and upper and lower wicks. Its open and close are near one another relative to the full high-low range, although price reached levels both above and below the body during the period.
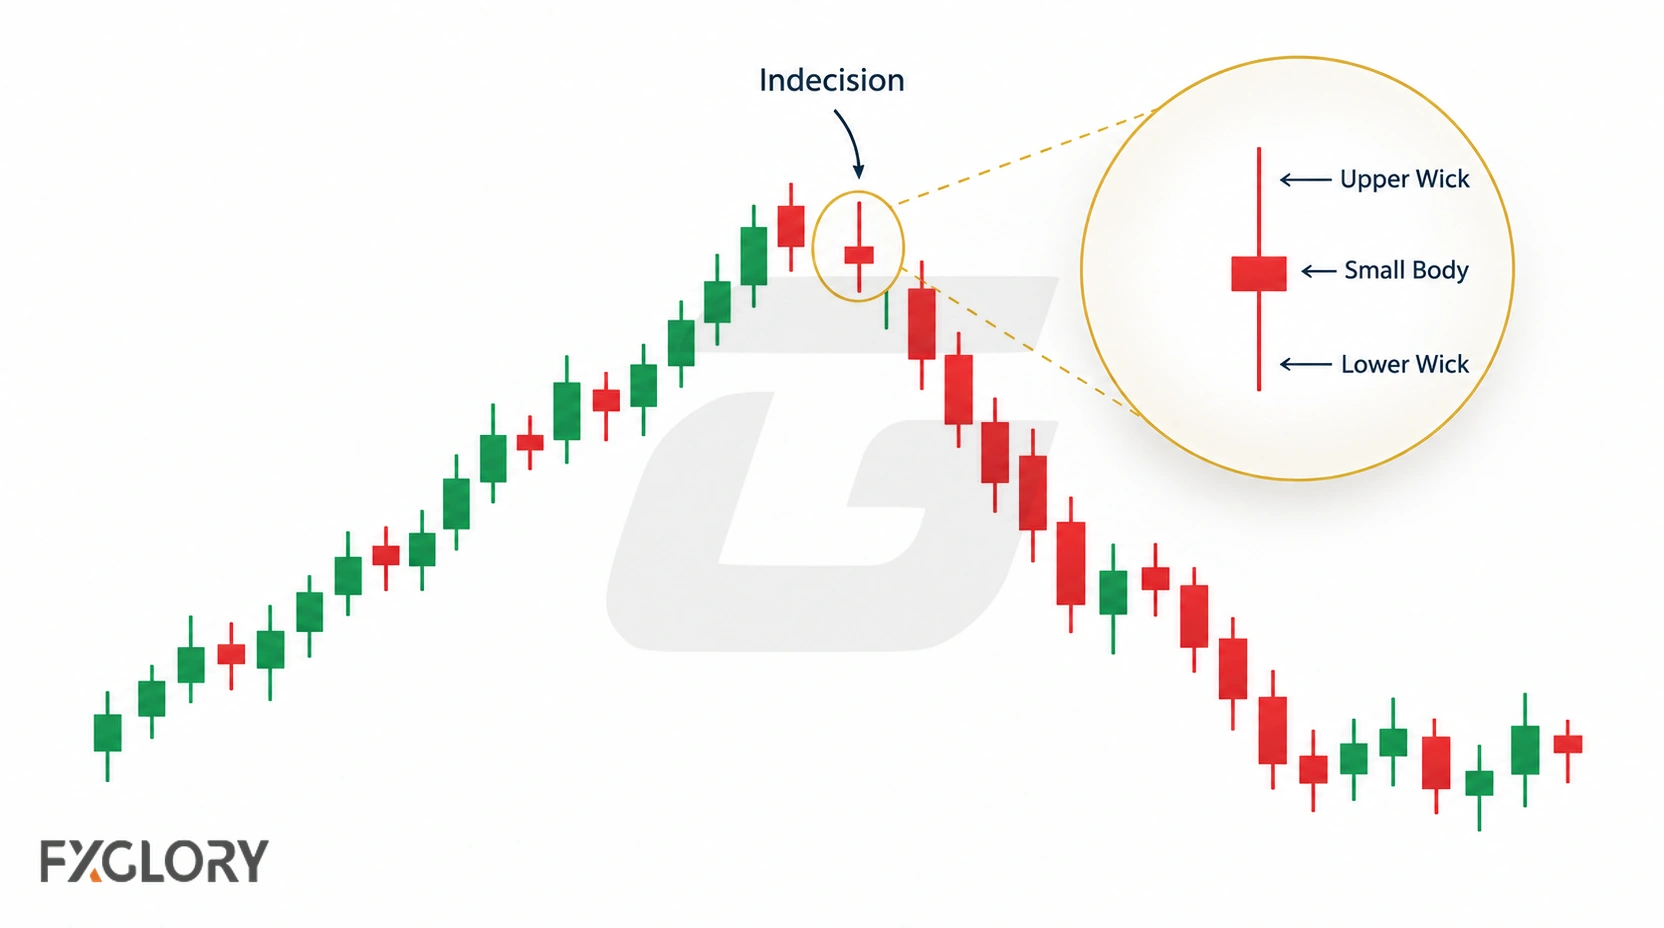
Traders often describe this shape as hesitation: the candle has a small net open-to-close change despite movement on both sides. An OHLC candle does not reveal which side traded first or prove that buying and selling pressure were equal. The pattern is a description of one completed period, not a reversal or continuation signal on its own.
If these terms are new, see the open, close, body, and wick relationship.
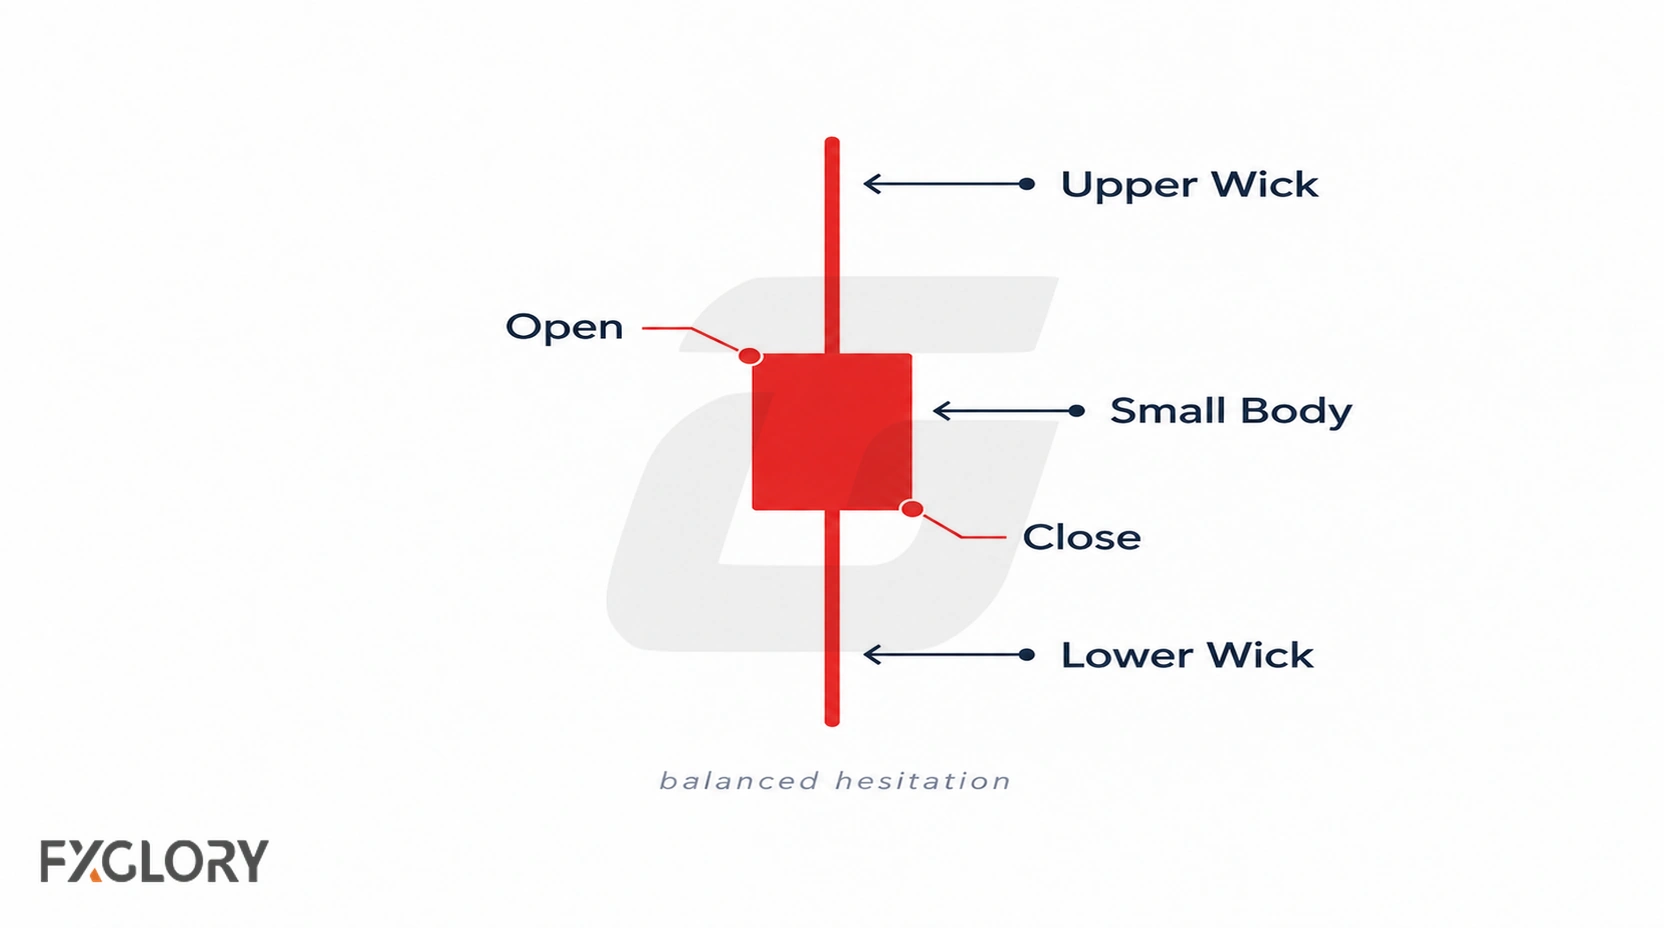
Spinning Top Candle Anatomy
Identify a small real body between visible wicks on both sides. The wicks need not be equal, and there is no universal body-to-range threshold. Compare the body and shadows with the candle’s total range and neighboring candles rather than applying an arbitrary fixed percentage.
| Spinning Top Part | What It Shows | Reading Caution |
|---|---|---|
| Small visible body | The open and close are close together but not necessarily identical. | A very tiny or almost invisible body may be closer to a doji. |
| Upper wick | Price moved above the body but did not close at the high. | A very dominant upper wick may shift the reading toward upper-wick rejection. |
| Lower wick | Price moved below the body but did not close at the low. | A very dominant lower wick may shift the reading toward lower-wick rejection. |
| Close location | Price finished near the opening area. | The close should support the hesitation reading. |
| Full candle range | The high-to-low movement during the candle period. | A wide range describes intraperiod movement; check news and liquidity before interpreting its cause. |
What a Spinning Top Shows in Forex
The small body captures limited net change between open and close; the two wicks capture excursions beyond both ends of that body. The candle may appear during a trend, a level test, or a range. Those surrounding conditions, not its shape alone, determine whether the observation is noteworthy.
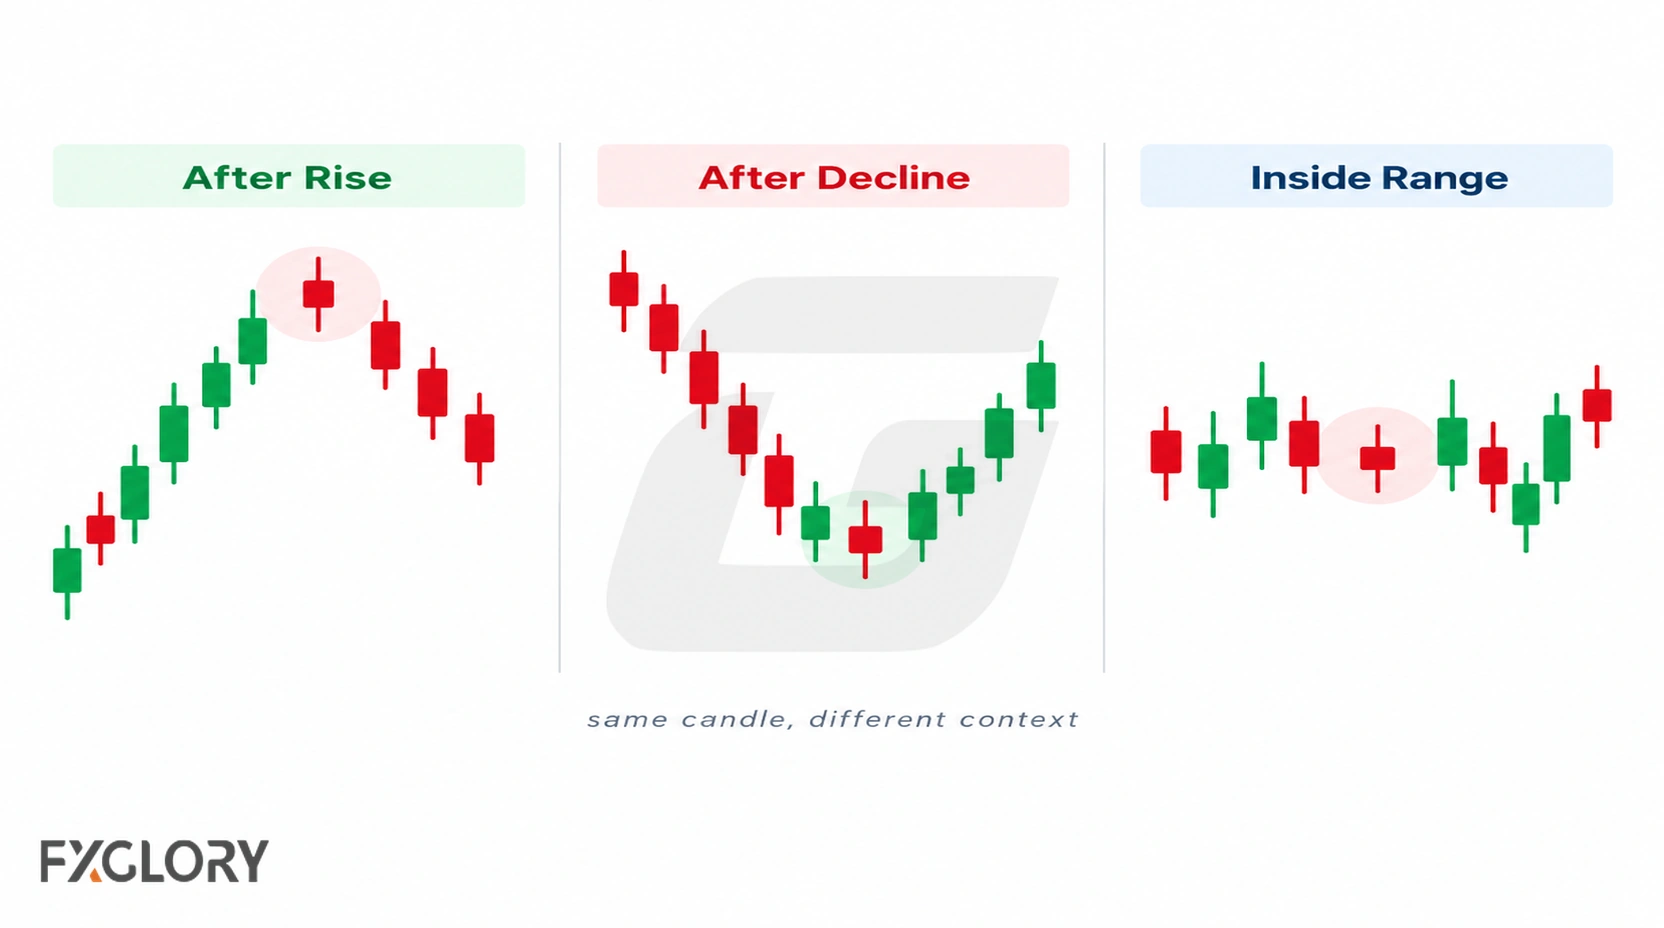
For example, after several large upward candles, a spinning top shows that the next period ended nearer its open. That does not establish that the earlier advance lost control or that a reversal started. Inside a narrow range, the same shape may simply reflect the usual back-and-forth trading.
Bullish and Bearish Spinning Tops in Forex
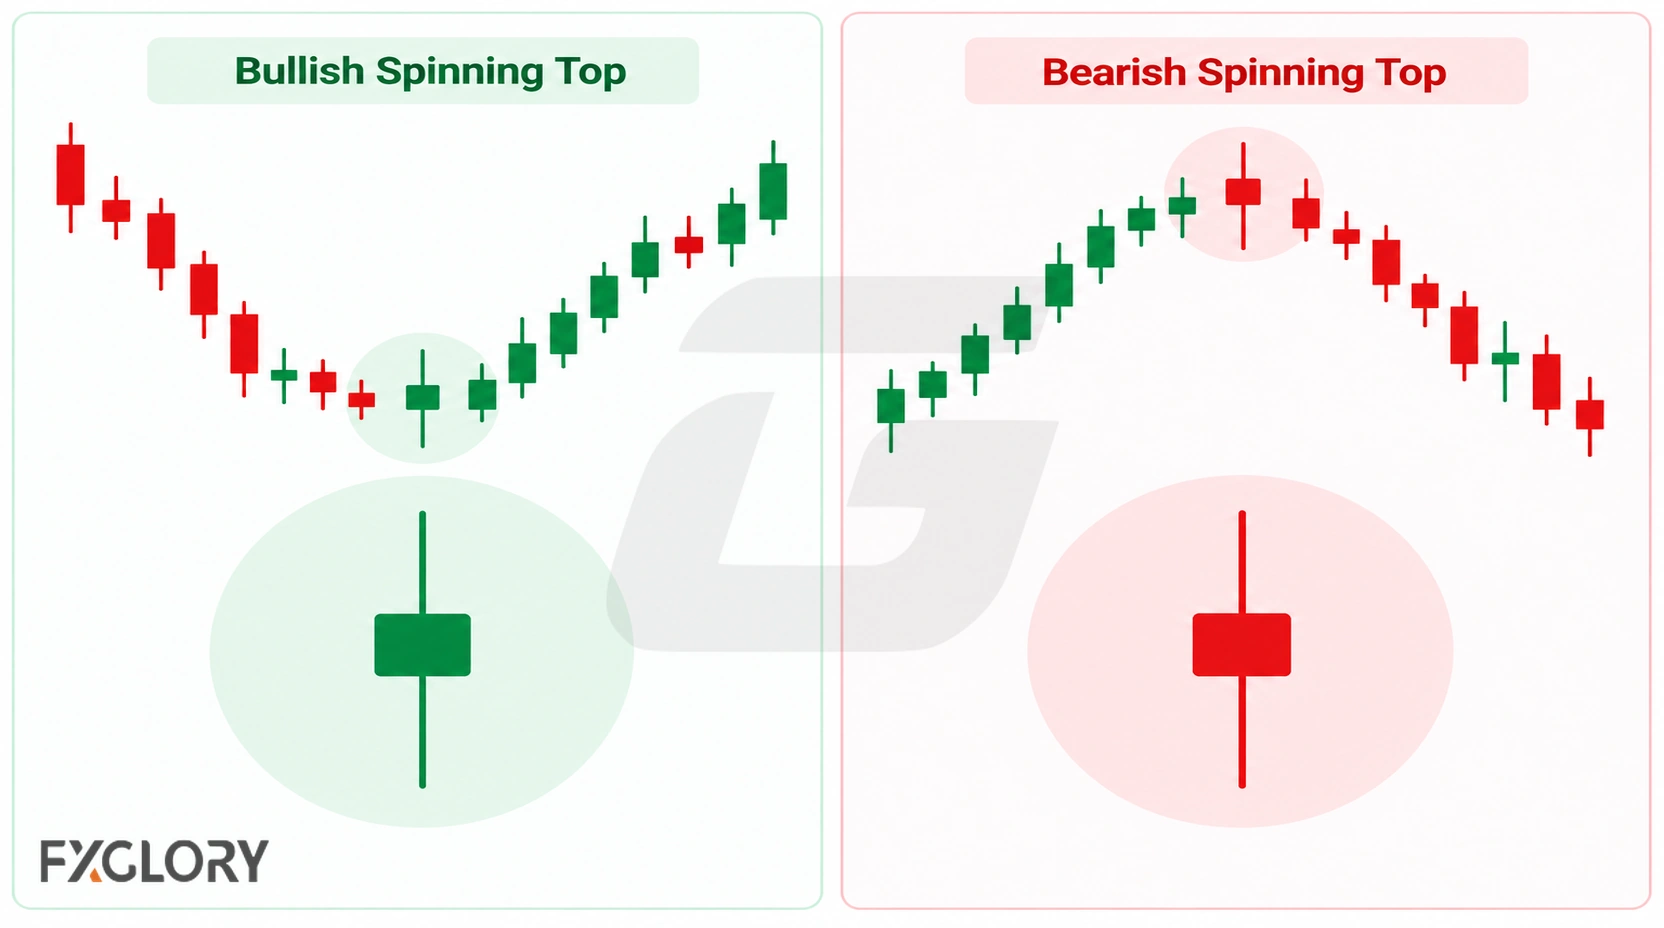
A bullish spinning top closes slightly above its open; a bearish one closes slightly below. Both retain small bodies and two-sided wicks. Color identifies only the direction of that small net change, so a green candle is not automatically strong buying pressure and a red one is not automatically strong selling pressure.
Spinning Top vs Doji in Forex
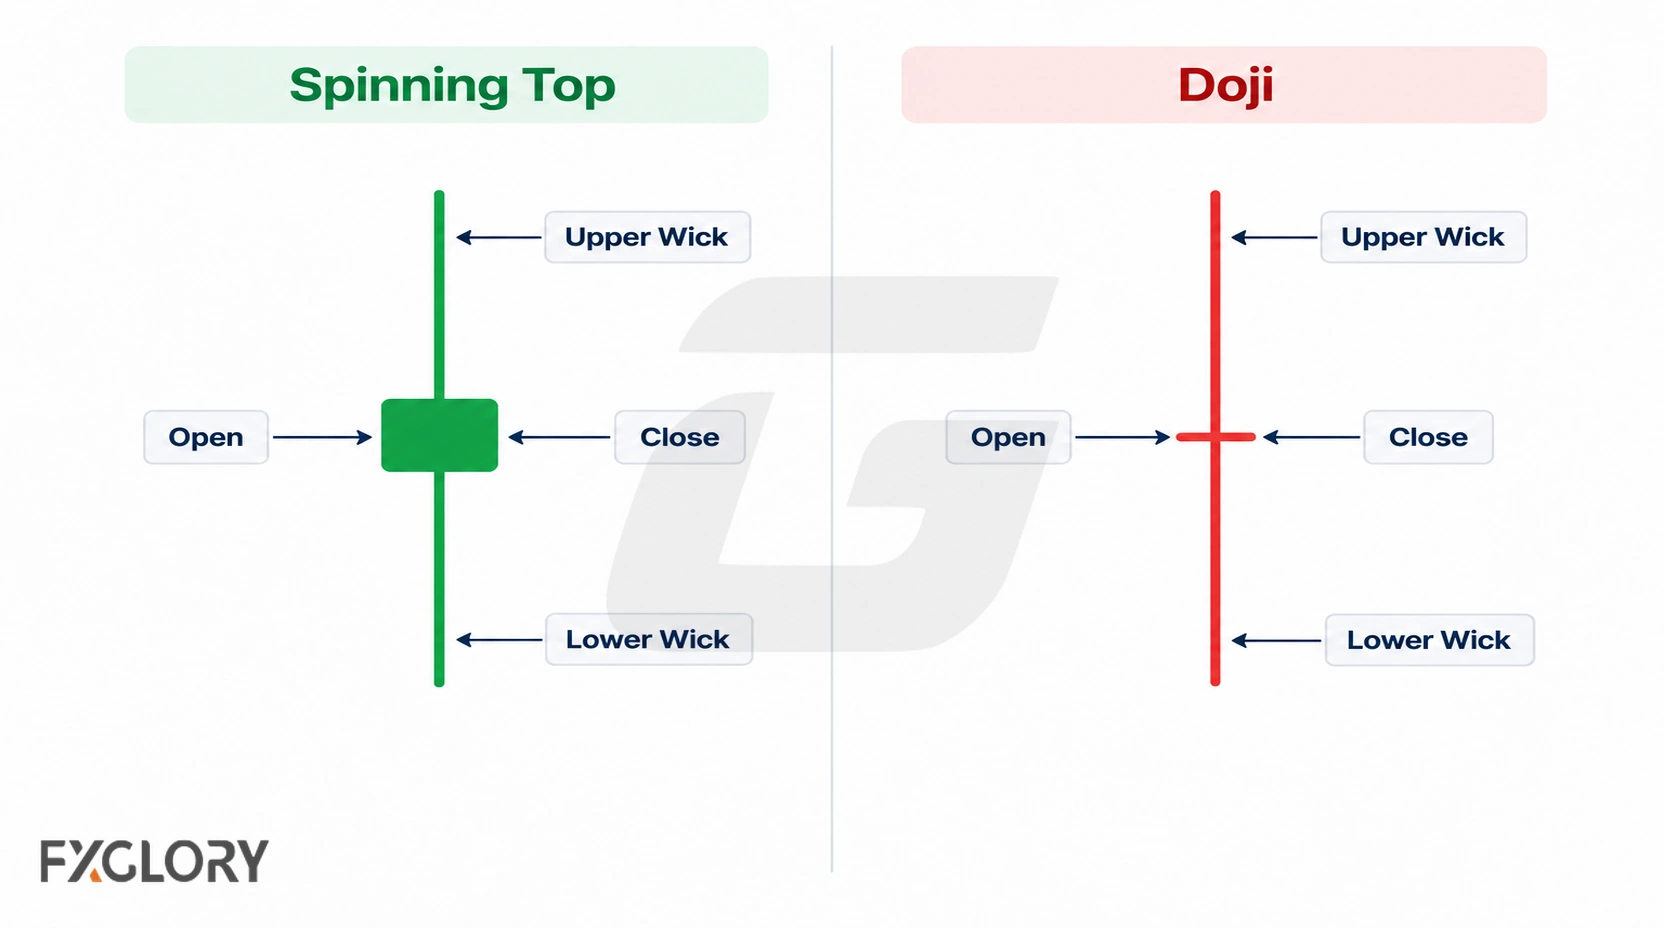
A doji has an open and close that are the same or nearly the same, leaving almost no body; a spinning top has a small but discernible body. In practice the dividing line varies with chart scale, market tick size, and convention, so borderline candles may be described differently.
| Candle | Body | Wicks | Main Reading | Deeper Guide |
|---|---|---|---|---|
| Spinning top | Small but visible body. | Upper and lower wicks usually visible. | Hesitation with some distance between open and close. | This guide. |
| Doji | Open and close are equal or almost equal. | Can vary by doji type. | Open-close balance or indecision. | Compare with doji structure |
Spinning Top vs Similar Forex Candles
Other small-bodied candlesticks can communicate a different shape or context. Focus on whether the upper and lower shadows are both prominent, whether one wick dominates, and where the formation appears.
| Candle | Main Structure | Main Difference From Spinning Top |
|---|---|---|
| High-wave candle | Small body with very long upper and lower wicks. | High-wave candles usually show more extreme two-sided movement. |
| Hammer | Small body near the top with a long lower wick. | Hammer focuses on lower-wick rejection after selling pressure. |
| Shooting star | Small body near the bottom with a long upper wick. | Shooting star focuses on upper-wick rejection after buying pressure. |
| Pin bar | Long dominant wick and smaller body. | Pin bar focuses on one-sided rejection, not balanced two-sided hesitation. |
| Marubozu | Large body with little or no wick. | Marubozu shows strong body control, while spinning top shows hesitation. |
A high-wave candle has especially extended shadows, although the terms can overlap. For more detail, compare lower-wick hammer structure, upper-wick shooting star structure, and long-wick rejection candles.
Where Spinning Top Candles Matter More
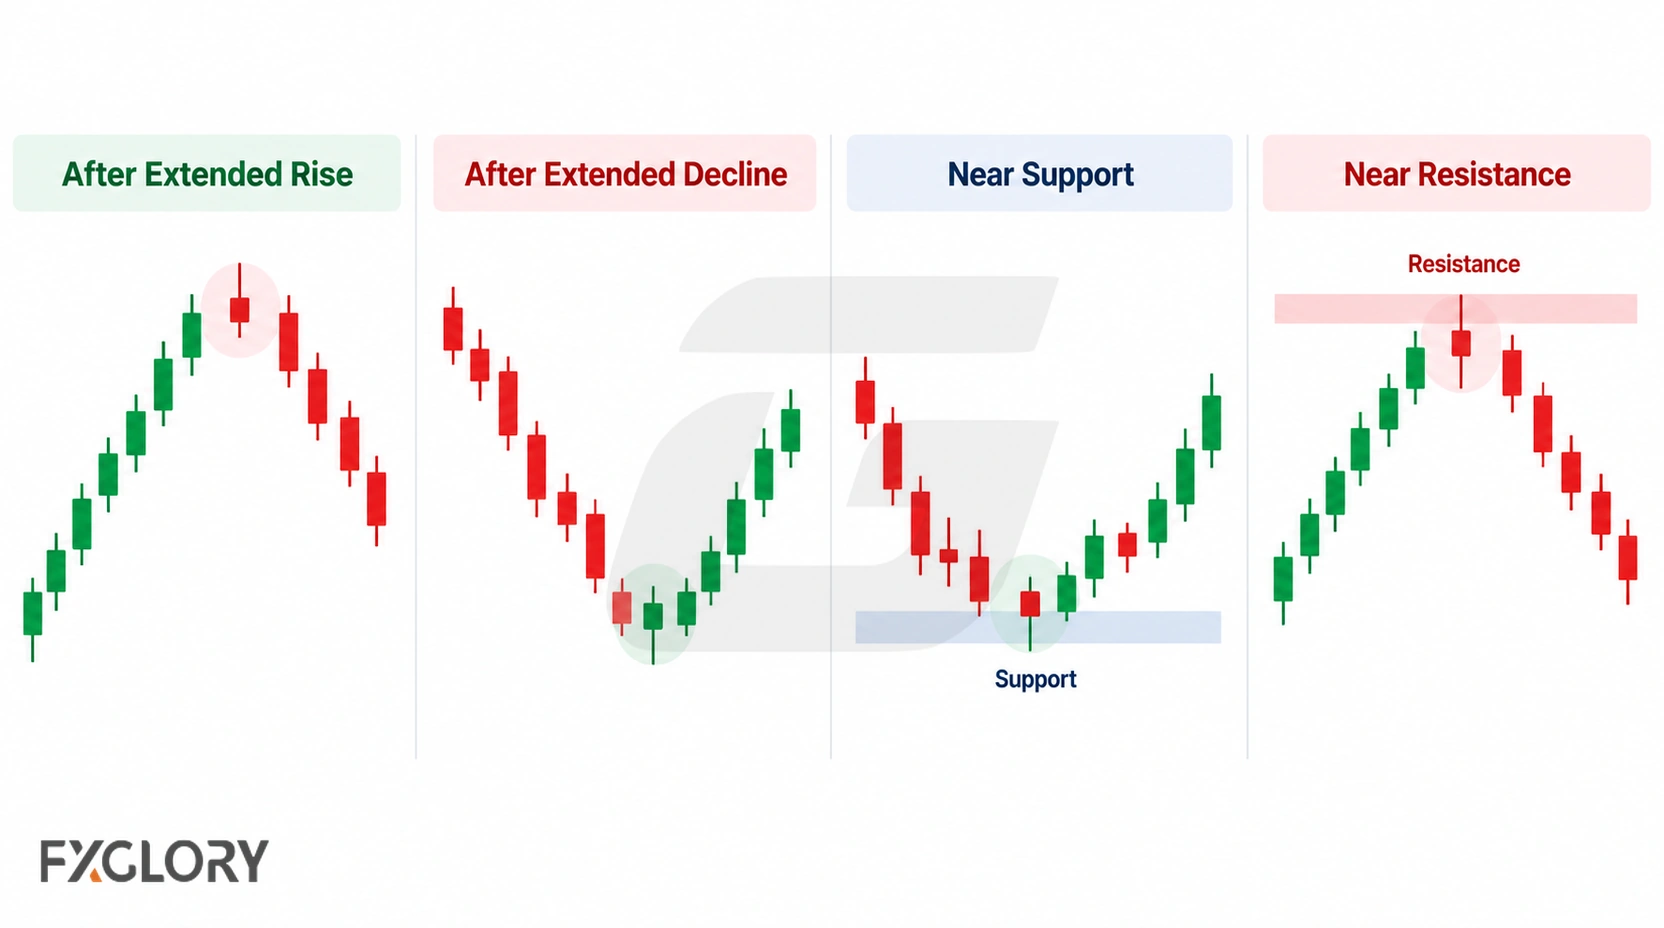
Chart location provides a reason to pay attention to an otherwise ordinary candle. Identify the relevant area before interpreting the spinning top; do not draw an arbitrary level solely to give it significance.
After an Extended Rise or Decline
After several directional candles, a spinning top identifies a period with little net open-to-close progress. Review whether later candles resume the prior move, remain in a range, or break a previously identified swing level; the spinning top itself establishes none of these outcomes.
Near Support or Resistance
Near a previously tested support or resistance zone, the candle shows limited net progress during that test. Watch the subsequent closes relative to the zone, rather than assuming the wick alone represents a successful defense or rejection.
Inside a Sideways Range
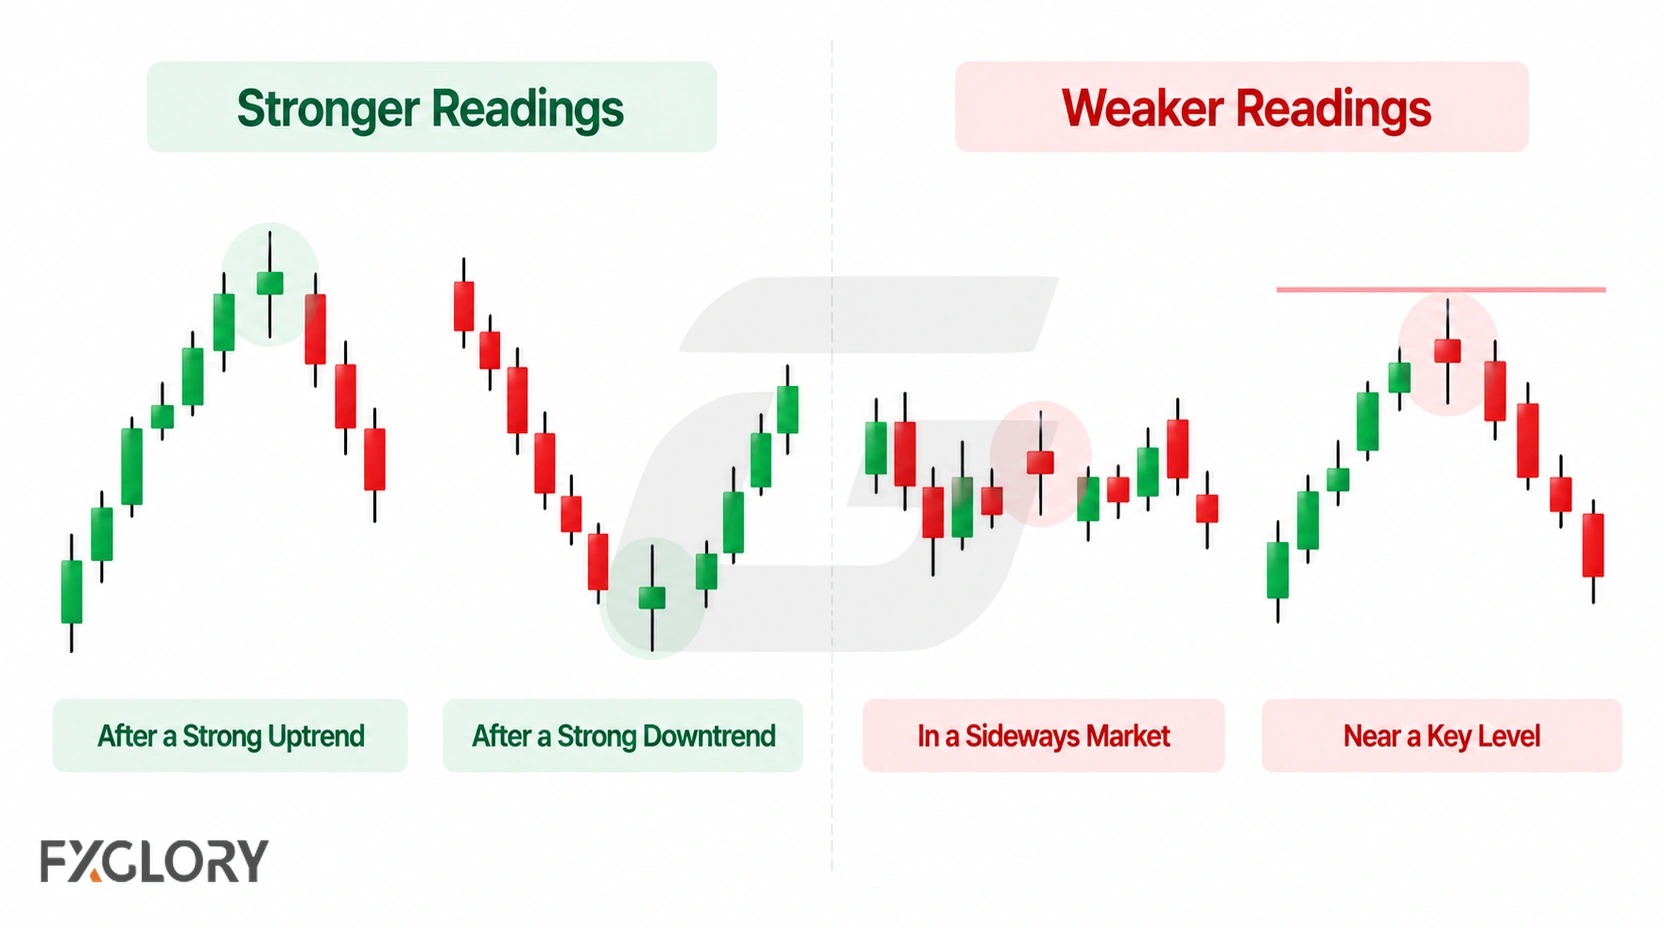
Near a range boundary the candle can help mark an ongoing test. In the middle of a range without a nearby decision level or preceding directional move, it may add little beyond the range already visible on the chart.
After a Large Candle
A smaller-bodied spinning top following a large directional candle indicates that the subsequent period closed closer to its own open. Compare full ranges as well as bodies: the spinning top can still have a large high-low range and does not erase or invalidate the prior candle.
For chart observation, compare EUR/GBP and GBP/USD across periods and timeframes; neither pair consistently guarantees a particular spinning-top interpretation.
How to Read a Spinning Top Candle in Forex
Use a short sequence that separates identifying the candle from evaluating a possible trade:
- Wait for the close: An unfinished candle may change shape.
- Classify the structure: Compare the body with the full range and check both shadows. If the body is nearly invisible or one wick dominates, consider a doji or rejection candle instead.
- Locate it: Mark the prior move, tested support or resistance, or range edge using surrounding price action.
- Check the trading environment: Note news releases, rollover, thin liquidity and whether spreads were unusually wide relative to the move. No fixed spread or volatility threshold works for every pair and timeframe.
- Observe subsequent candles: Specify what would count as holding the area, moving away from it, or breaking the level. These are follow-up observations, not conditions required to identify the original candle.
- Evaluate any trade separately: An entry decision needs its own invalidation logic, stop distance, position sizing and acceptable costs; none is supplied by the candle shape alone.
For further context, RSI measures momentum, ATR measures range-based volatility, and Bollinger Bands describe price variation around a moving average. None independently confirms what price will do after a spinning top.
Repeated Spinning Tops and Compression
Two or more spinning tops in a sequence mean that several periods finished with small open-to-close changes. That does not necessarily mean volatility or the overall trading range contracted: candles can have long opposing wicks even when their bodies remain small.
To identify actual compression, compare the consecutive high-low ranges and the outer boundaries of the sequence. Progressively narrower ranges or contained highs and lows support a compression description; wide, overlapping ranges describe continued two-sided volatility instead. A later break above or below the sequence is a separate price event, not an automatic trade signal.
When a Spinning Top Reading Is Weak or Unclear
Separate a structural mismatch from a valid spinning top with limited contextual value. A large real body, nearly absent shadows or a strongly dominant single wick may fit a different candle category. A structurally valid spinning top may still add little when there is no identifiable prior move, pre-existing level or range boundary relevant to the question being studied.
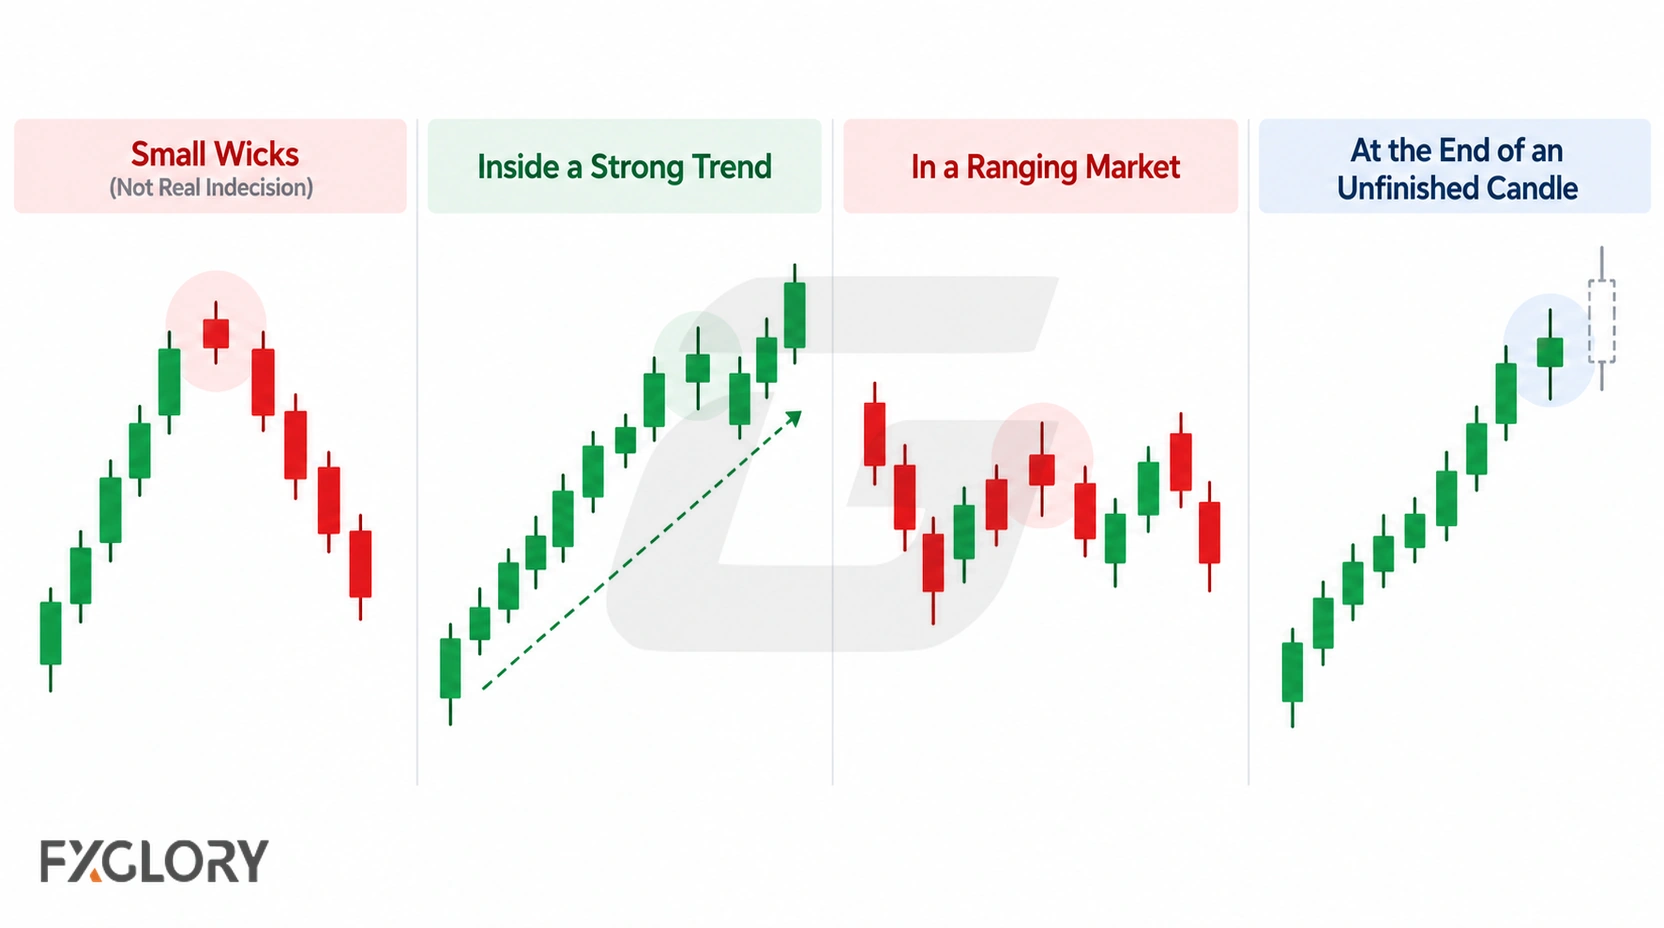
- Incomplete candle: Wait until the close before assigning the finished shape.
- Market disturbance: Around major news, rollover or illiquid trading, inspect spreads and the full range rather than interpreting long wicks as a specific directional contest.
- Superseded context: If subsequent closes decisively move beyond the level or zone that originally made the candle interesting, its earlier hesitation may no longer be useful for that level-specific reading. This does not change what the completed candle looked like.
- Unclear location: If no relevant prior move or independently identified price area exists, record the candle without forcing a directional narrative.
What to Study After Spinning Top Candles
Compare the doji candle guide for near-identical open and close prices, forex candlestick pattern groups for broader classification, and reversal candles in forex for the larger context of possible turning points.