
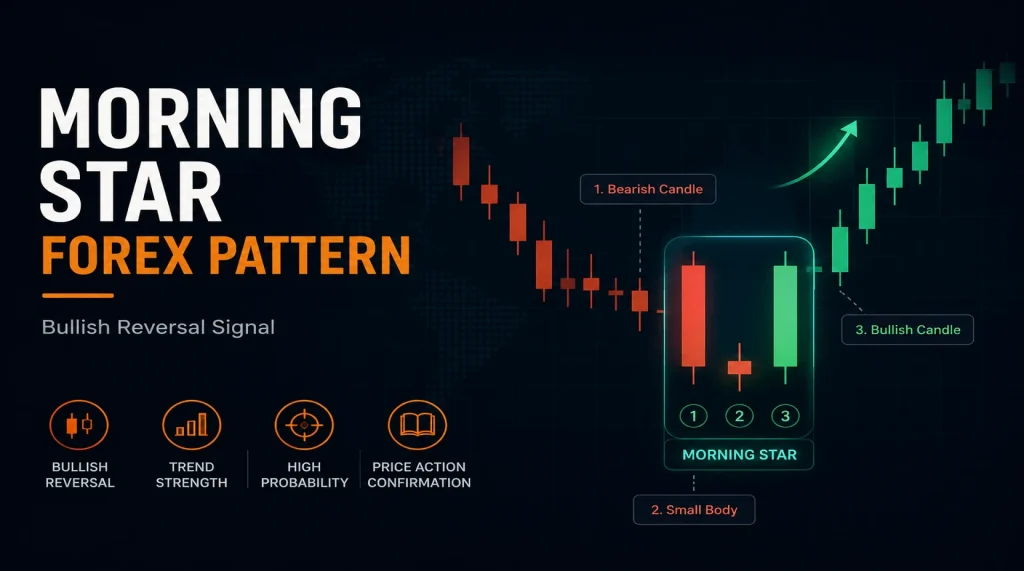
What Is a Morning Star Forex Pattern?
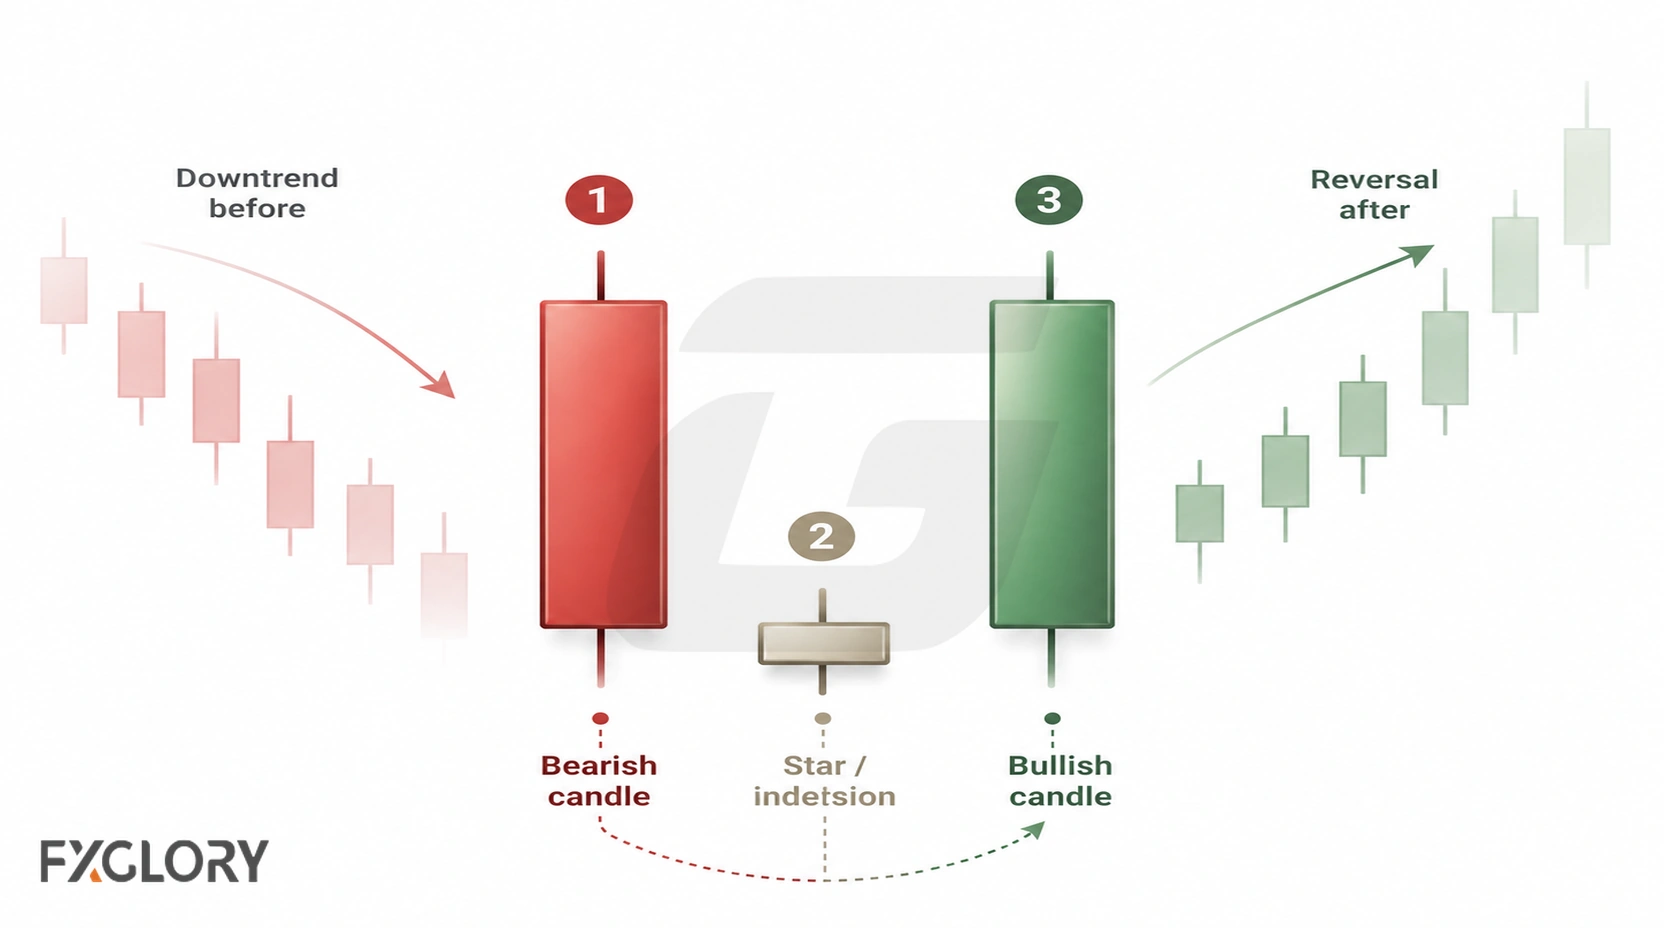
A morning star forex pattern is a three-candle candlestick formation usually studied after a decline or visible selling pressure. It moves from a bearish first candle, to a smaller or indecisive middle candle, to a bullish third candle.
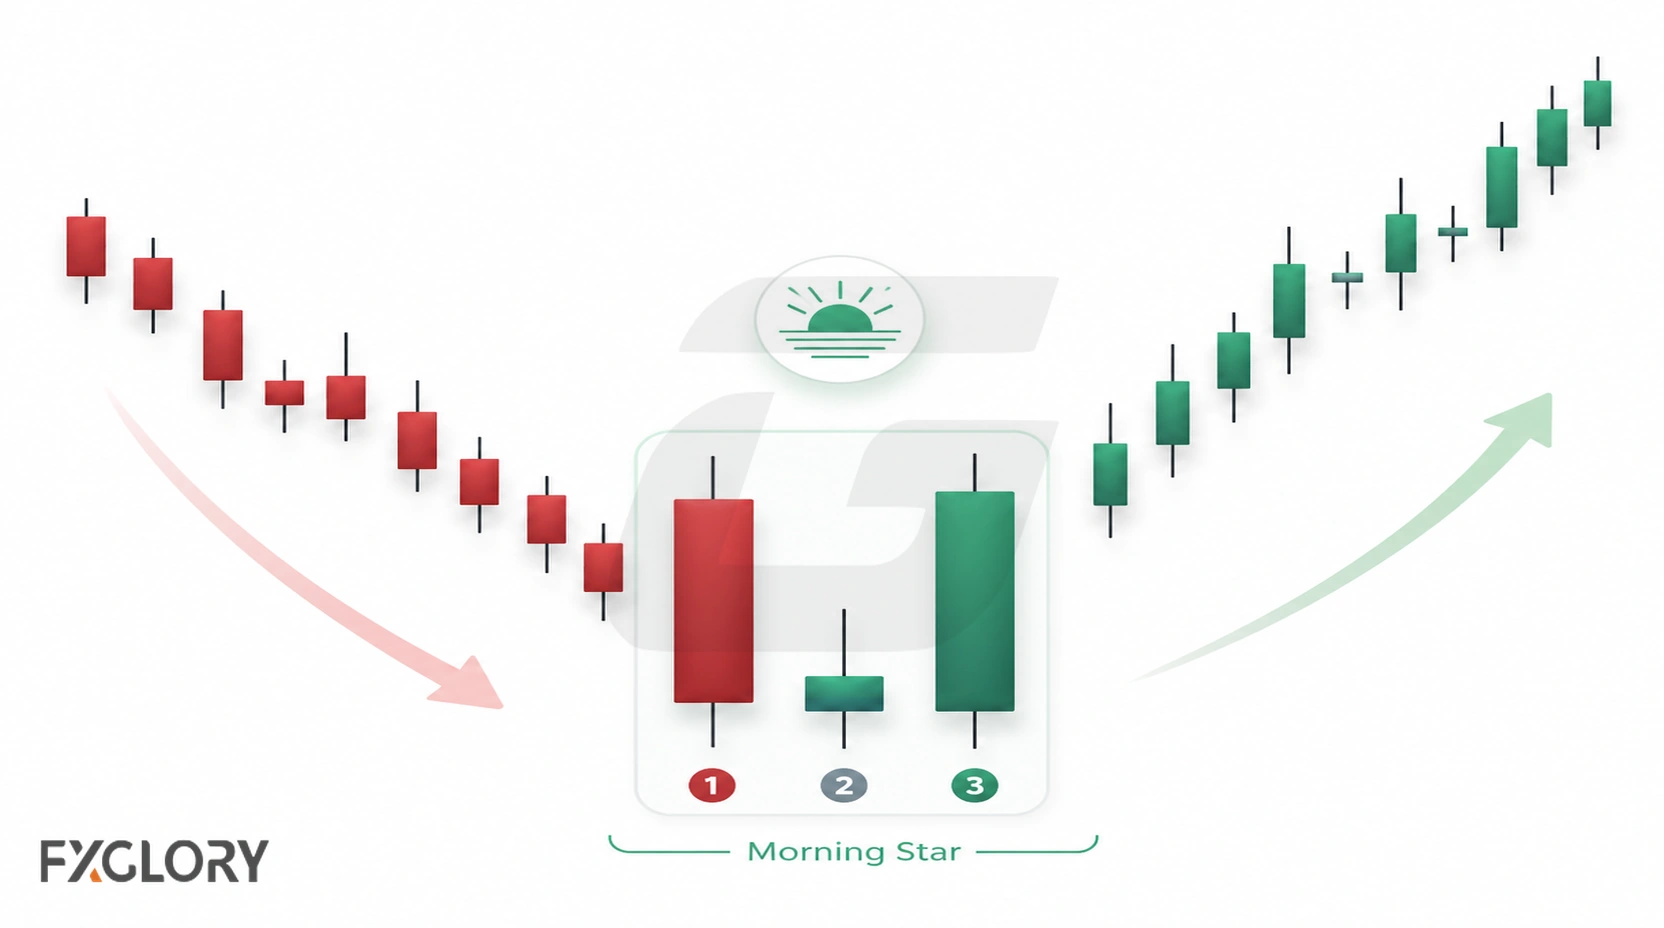
The pattern is generally treated as a bullish reversal-focused structure, but the label alone is not enough. Its value depends on the prior move, the quality of the three completed candles and where the sequence forms on the chart.
If you need the basic candle parts first, review the open, close, body and wick relationship.
Morning Star Pattern Anatomy
| Part | Common Structure | Role in the Pattern |
|---|---|---|
| First candle | Bearish candle after a decline or selling pressure. | Shows that sellers were still active before the pause. |
| Middle candle | Small body, doji, spinning top or narrow-range candle. | Shows hesitation or reduced continuation. |
| Third candle | Bullish candle that moves back into the first candle's body area. | Shows a buyer response after the pause. |
A clearer formation usually has a visibly smaller middle candle and a bullish third candle that closes meaningfully back into the body of the first candle. Some traders also watch whether the third candle reaches or passes the midpoint of the first candle's body, but that is a reading aid rather than a guarantee.
Why Prior Selling Pressure Matters
A morning star needs a prior move to react against. A formation after a clear decline, near a recent low or after a failed attempt to continue lower has more context than the same three candles in random sideways movement.
The prior move does not need to be a long trend. What matters is that the chart shows enough selling pressure for the later pause and bullish response to represent a change in short-term behavior.
The Middle Candle: Doji, Spinning Top or Small Body
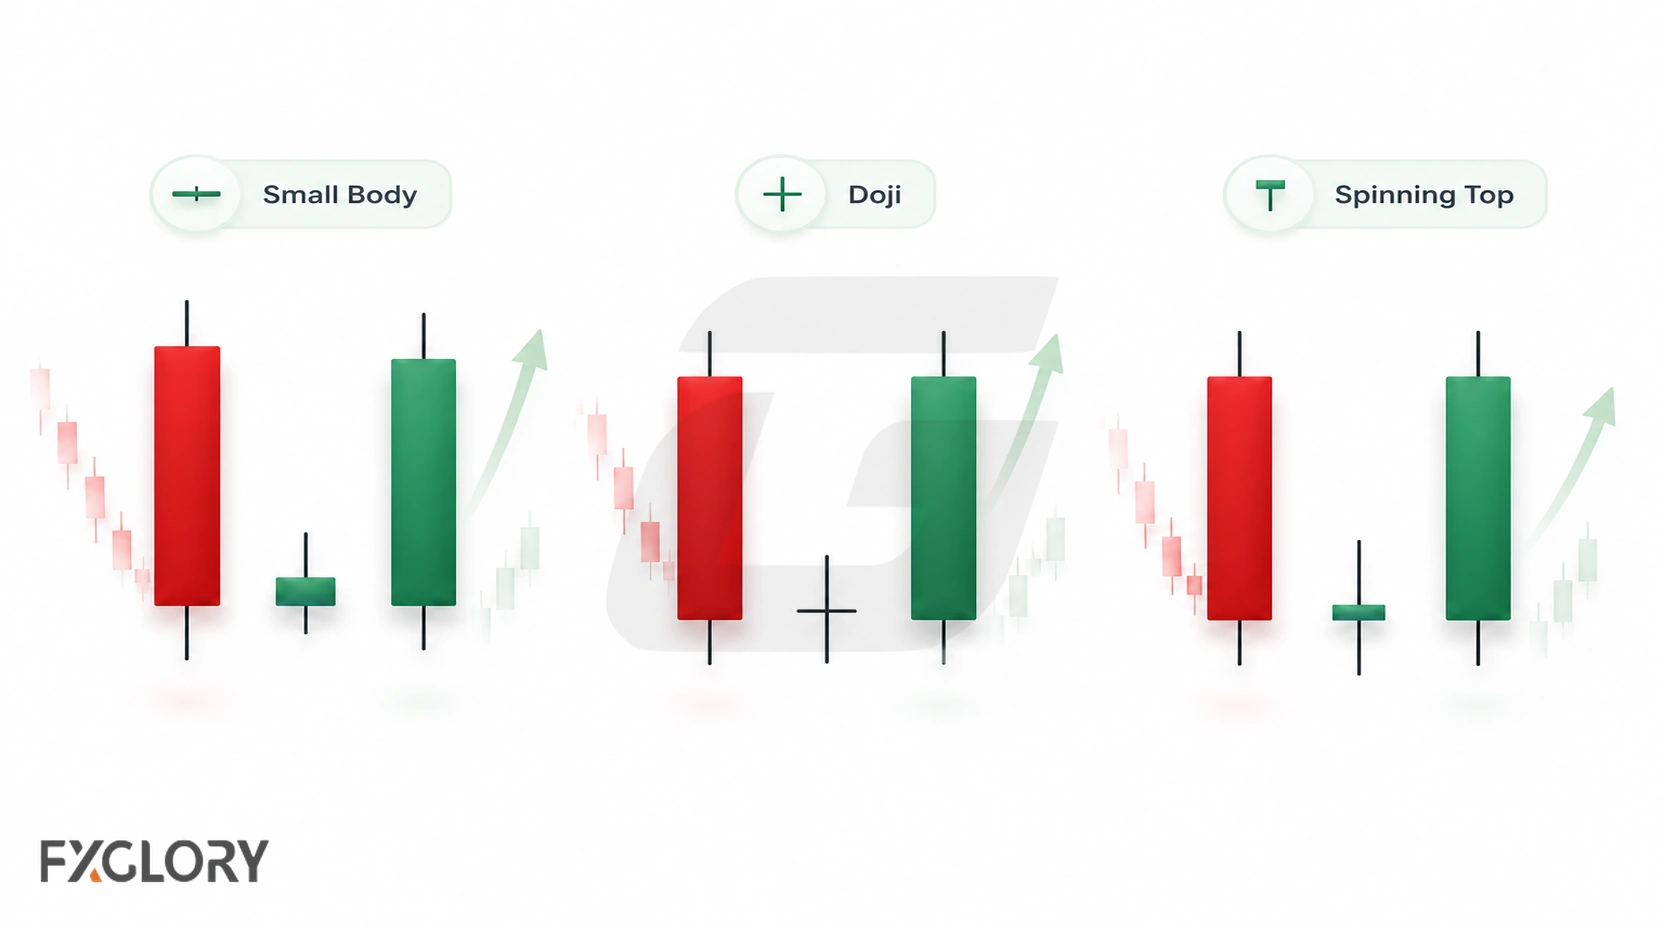
The middle candle represents the pause in the sequence. Its body is usually smaller than the first candle's body, and it can close bullish or bearish.
| Middle Candle | Typical Reading |
|---|---|
| Small body | Selling pressure slowed or narrowed. |
| Doji | The open and close were nearly balanced. |
| Spinning top | Two-sided movement occurred around a small real body. |
| Large body | The pause is less clear, making the morning star structure weaker. |
For more detail on these candle shapes, see doji candles and spinning top candles.
Why the Third Candle Matters
The first two candles show selling pressure followed by hesitation. The third candle determines whether that pause is followed by a clear bullish response.
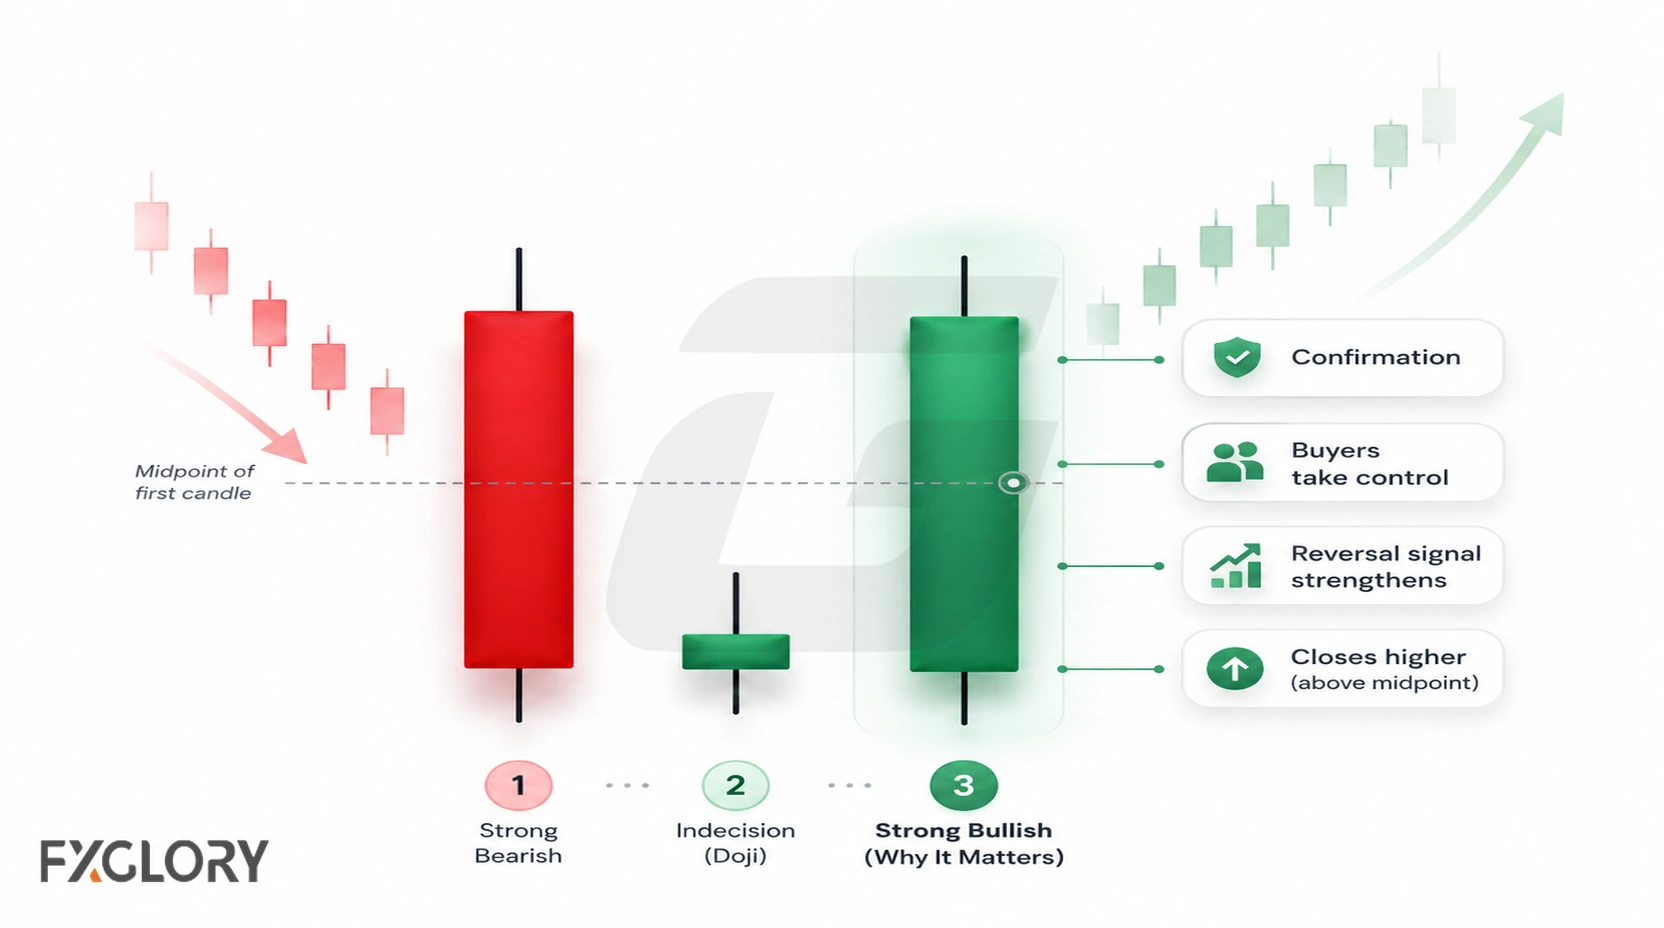
A stronger visual example has the third candle closing well into the first candle's body. A third candle that closes only slightly higher creates a weaker pattern because the shift in pressure is less distinct.
The candle should be allowed to close before the pattern is judged. An unfinished third candle can change substantially before the end of its period.
Morning Star vs Evening Star
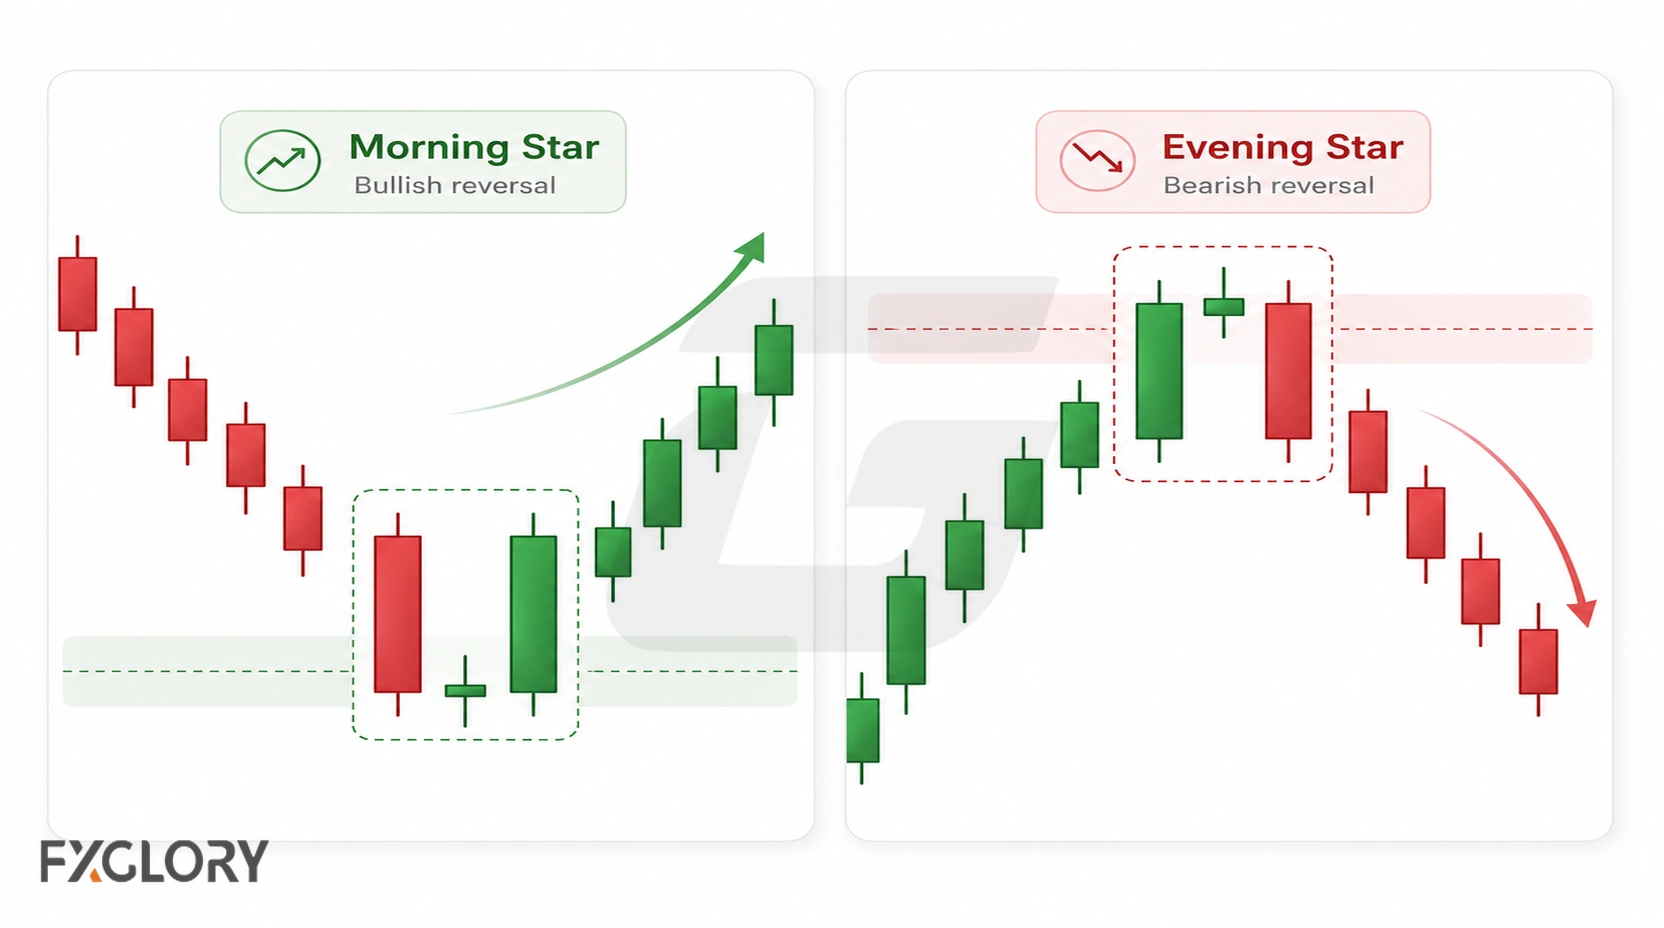
The morning star and evening star use similar three-candle structures but appear after opposite prior moves.
| Pattern | Typical Prior Move | Sequence |
|---|---|---|
| Morning star | Decline or selling pressure. | Bearish → small/indecisive → bullish. |
| Evening star | Rise or buying pressure. | Bullish → small/indecisive → bearish. |
For the opposite structure, see the evening star forex guide.
Morning Star vs Similar Forex Patterns
| Pattern | Main Structure | Difference From a Morning Star |
|---|---|---|
| Doji | Open and close are nearly equal. | Can be the middle candle but is not the full three-candle pattern. |
| Spinning top | Small body with upper and lower wicks. | Can be the middle candle but is not the full pattern. |
| Hammer | Single candle with a long lower wick and small body. | One-candle structure rather than a three-candle sequence. |
| Bullish engulfing | Two-candle body takeover. | Uses two candles instead of three. |
For a broader map of related structures, review forex candlestick patterns or reversal candles in forex. For a single-candle comparison after selling pressure, see the hammer candle guide.
Where Morning Star Patterns Matter More
Chart location gives the candle sequence context. The pattern is generally easier to interpret when it forms after a visible decline and near an area where selling has previously stalled.
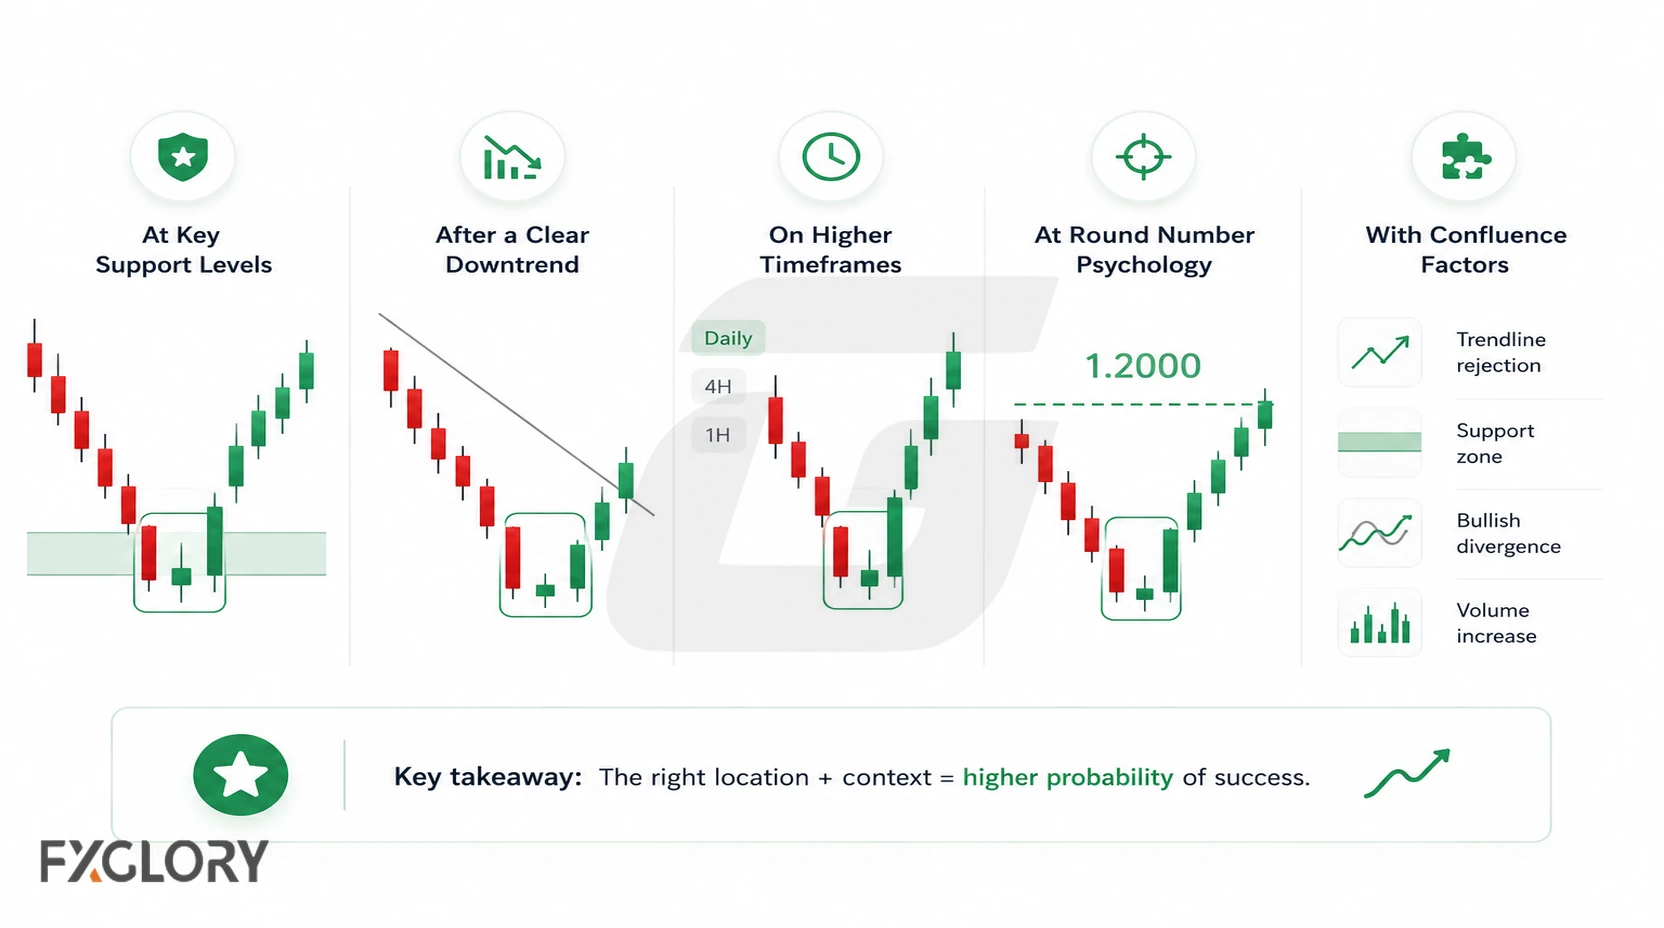
- Near support: The formation appears around an area where price has previously struggled to move lower.
- Near a swing low: The pattern forms around a recent lower turning point.
- At a range low: The sequence appears near the lower boundary of a sideways range rather than in its center.
- After a failed continuation: Price tries to extend the decline but loses momentum before the bullish third candle.
Stronger vs Weaker Morning Star Readings
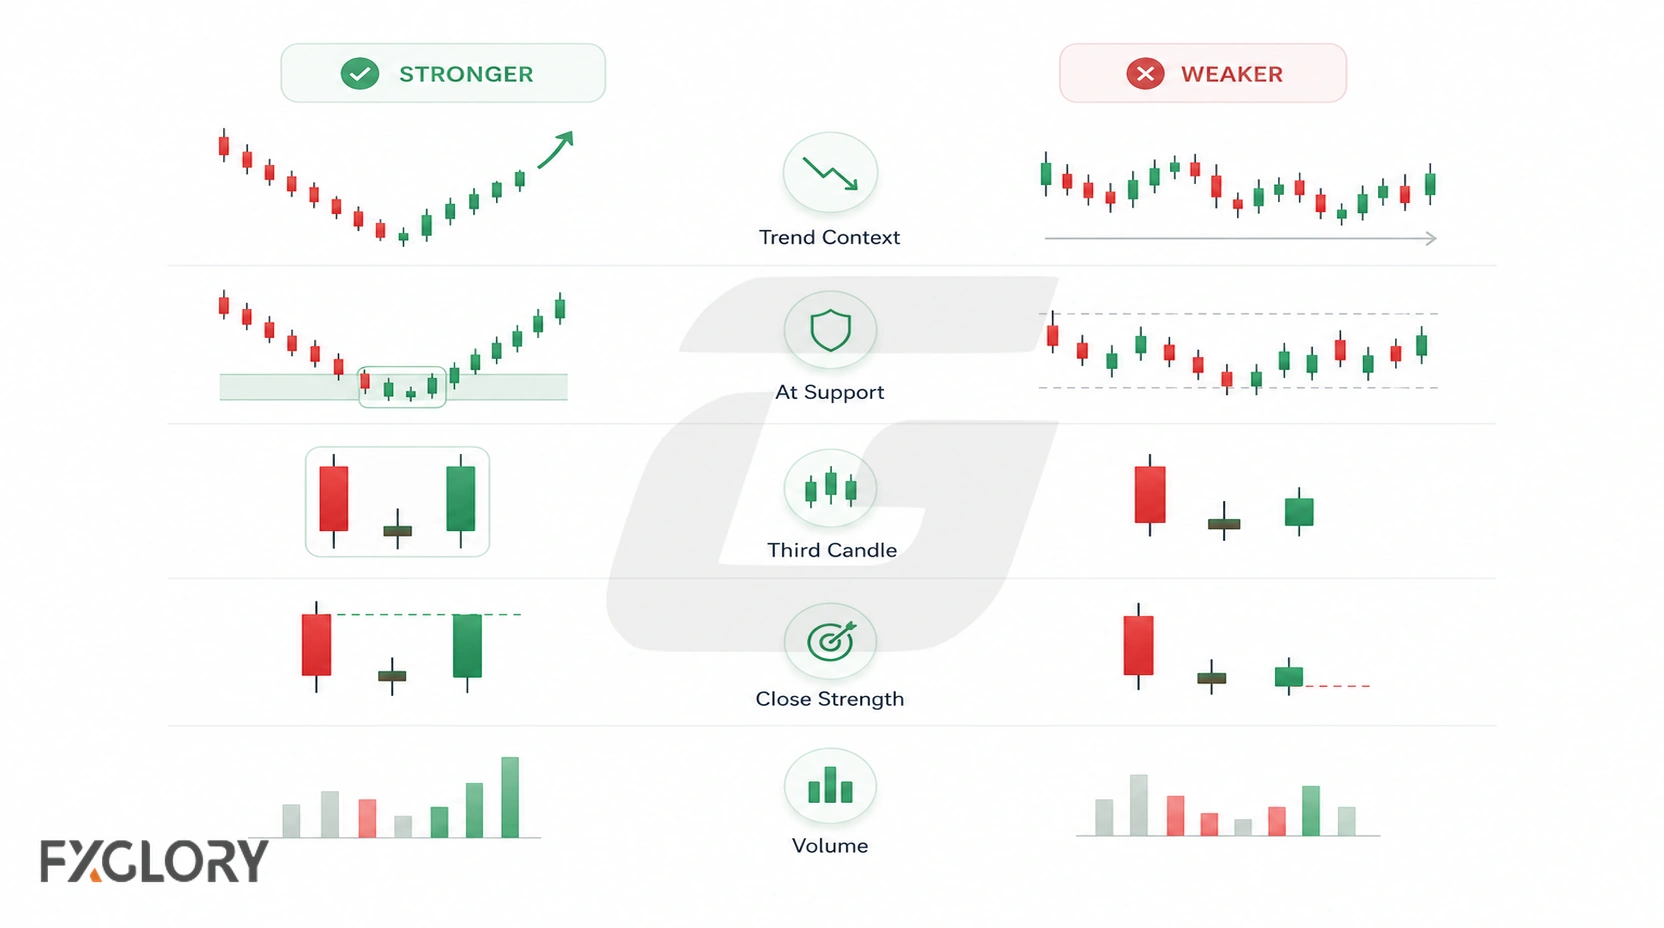
| Factor | Clearer Reading | Weaker Reading |
|---|---|---|
| Prior move | Visible decline or selling pressure. | No clear prior decline. |
| Middle candle | Clearly smaller or indecisive. | Large body with little evidence of a pause. |
| Third candle | Bullish close meaningfully into the first candle's body. | Small bullish response. |
| Location | Support, swing low or range low. | Middle of choppy price action. |
| Conditions | Normal spread and volatility for the instrument. | Unusually unstable news, rollover or thin-liquidity conditions. |
How to Read a Morning Star Pattern in Forex
- Check the prior move: Look for a decline or clear selling pressure before the formation.
- Confirm candle one: The first candle should show bearish pressure.
- Check the pause: The middle candle should be smaller or indecisive relative to the first.
- Wait for candle three to close: Review how far the bullish candle closes back into the first candle's body.
- Check location: Give more weight to patterns near support, a swing low, a range low or a failed continuation.
- Check market conditions: Consider spread, volatility, liquidity and scheduled news before interpreting an unusually large candle.
Some traders add indicators such as RSI, MACD, ATR or Bollinger Bands for additional context. These tools can support analysis but do not turn the pattern into a guaranteed signal.
Some stock-focused descriptions emphasize price gaps around the middle candle. In forex, where trading is largely continuous during the working week, it is more practical to focus on the selected timeframe, the three-candle sequence and chart context rather than requiring a textbook gap.
Common Mistakes With Morning Star Patterns in Forex
- Ignoring the prior move: A similar candle sequence without a preceding decline has less reversal context.
- Treating the middle candle as the whole pattern: A doji or spinning top alone is not a morning star.
- Reading the third candle before it closes: An unfinished candle can change the pattern substantially.
- Accepting any bullish third candle: A very small response may not create a clear shift in the sequence.
- Forcing patterns inside choppy movement: Random three-candle combinations are common when price lacks structure.
- Requiring stock-style gaps: Gaps are not essential for identifying a morning star on a forex chart.
- Ignoring execution conditions: News spikes, wide spreads or thin liquidity can make a dramatic pattern harder to interpret and trade.
- Treating the pattern as a complete trade plan: Pattern recognition does not replace position sizing, risk limits or a defined invalidation point.