

What Is A Forex Price Action Strategy?
A forex price action strategy is a trading plan that uses price movement itself as the main source of information. The plan may use swing highs and lows, support and resistance, candle structure, breakouts, retests, failed moves, liquidity areas, trendlines, chart patterns, ranges, and market structure to decide whether a setup is valid.
For example, an inside bar may describe temporary range contraction, while a failed break of its boundary can provide evidence for a different trade idea. Neither shape establishes an entry on its own: the chosen rule must specify what subsequent price movement changes the decision.
For chart-reading terminology, see what is price action in forex. The sections below show how traders can compare distinct price-based setups and translate observations into testable decisions.
Price Action Strategy vs Price Action Analysis
A chart can show a reaction at resistance without establishing a short trade. One trader may wait for a completed close below a nearby swing low; another may require a retest. Those are different decision rules applied to the same observation.
| Area | Price Action Analysis | Price Action Strategy |
|---|---|---|
| Main question | What is price doing? | What am I allowed to do, and where am I wrong? |
| Focus | Structure, levels, candles, swings, and volatility | Setup, trigger, entry, stop, target, exit, risk, and no-trade rules |
| Example | Price rejected resistance after a long wick | Sell only if the rejection appears at resistance, higher-timeframe context does not conflict, invalidation is clear, and the next support gives enough room |
| Main risk | Over-reading every candle | Taking signals without clear invalidation or risk limits |
A trader may read price action correctly and still have no valid trade. A strategy is needed because the chart can show several possible interpretations at the same time. Written rules reduce the chance of forcing a trade because a candle looks interesting.
Benefits And Limitations Of Price Action Strategies
Price action strategies can make chart decisions more structured because they focus on price, location, and invalidation. They can also create false confidence when traders treat patterns as automatic signals.
| Potential Benefit | Practical Meaning | Limitation To Control |
|---|---|---|
| Cleaner chart reading | The trader focuses on levels, swings, candles, and structure | A clean chart still needs exact entry, stop, and exit rules |
| Direct link to invalidation | The setup can often define where the idea is wrong | A stop behind structure can still be too wide for the account risk limit |
| Can be examined across pairs and timeframes | Similar types of swing, range, and candle structure can be described on different markets; results require separate testing | Lower timeframes may be more affected by spread, noise, and slippage |
| Can combine with indicators | Indicators may filter trend, momentum, or volatility | Indicators can duplicate the same signal or delay the decision |
| Supports no-trade decisions | Messy structure can be skipped | The trader must accept that many charts do not offer a clean setup |
The Price Action Rule Sequence
A price action strategy should follow a sequence. The order matters. Traders often start with the trigger because candle patterns are easy to see. A safer process starts with context and location first.
- Market condition: identify trend, range, transition, or unclear structure; note a breakout or pullback as an event or possible setup within that background.
- Location: identify the level, zone, swing, trendline, chart pattern boundary, range edge, liquidity area, or imbalance where price is reacting.
- Confirmation: use the predefined observable trigger, such as a completed close, a retest response, or a break-and-return through the marked boundary.
- Invalidation: define the price or structure that proves the idea wrong.
- Entry: choose whether the entry is at market, on a breakout, after a retest, or after confirmation.
- Stop: place the stop where the setup fails, not where the loss feels comfortable.
- Exit: define the target, trailing rule, partial exit, time stop, or manual close condition.
- Cost and risk: check spread, slippage, position size, margin, and reward distance before accepting the trade.
- Review: record whether the trade followed rules, not only whether it won or lost.
Price Action Setup Selection
A price action trader should choose the setup family that matches the market condition. Reversal logic, continuation logic, breakout logic, and failure logic are different plans. Mixing them after entry usually creates poor decisions.
| Setup Family | Use When | Avoid When | Main Decision |
|---|---|---|---|
| Rejection or reversal | Price reacts at major support, resistance, range edge, or liquidity area | There is no clear level or the higher timeframe strongly conflicts | Where does the rejection fail? |
| Continuation or pullback | The broader trend structure remains intact and price retraces to a predefined area | The pullback breaches the swing level used to define the trend, or no invalidation level is clear | Does the pullback preserve the specific swing structure required by the plan? |
| Breakout and retest | A range boundary or pattern boundary breaks and then holds | Spread, slippage, or nearby structure leaves poor target room | Does price hold beyond the broken area? |
| False breakout or fakey | Price breaks a level, fails to hold, and returns inside structure | There is no close or clear rejection back inside the prior structure | What proves the break failed? |
| Compression or inside bar | Price pauses before possible expansion at a meaningful location | The mother bar is too wide or the surrounding context is messy | Which side of the range gives a valid break? |
| Chart pattern context | Triangles, channels, flags, wedges, or ranges organize structure | The pattern is forced after the move has already happened | Is the pattern a real boundary or only a visual guess? |
Market Context Comes Before The Signal
Price action signals change meaning depending on context. An inside bar in a strong trend may show a pause before continuation. The same pattern in the middle of a noisy range may offer no clear advantage. A pin bar at a major level may show rejection. A pin bar in the middle of nowhere may be only a candle with a long wick.
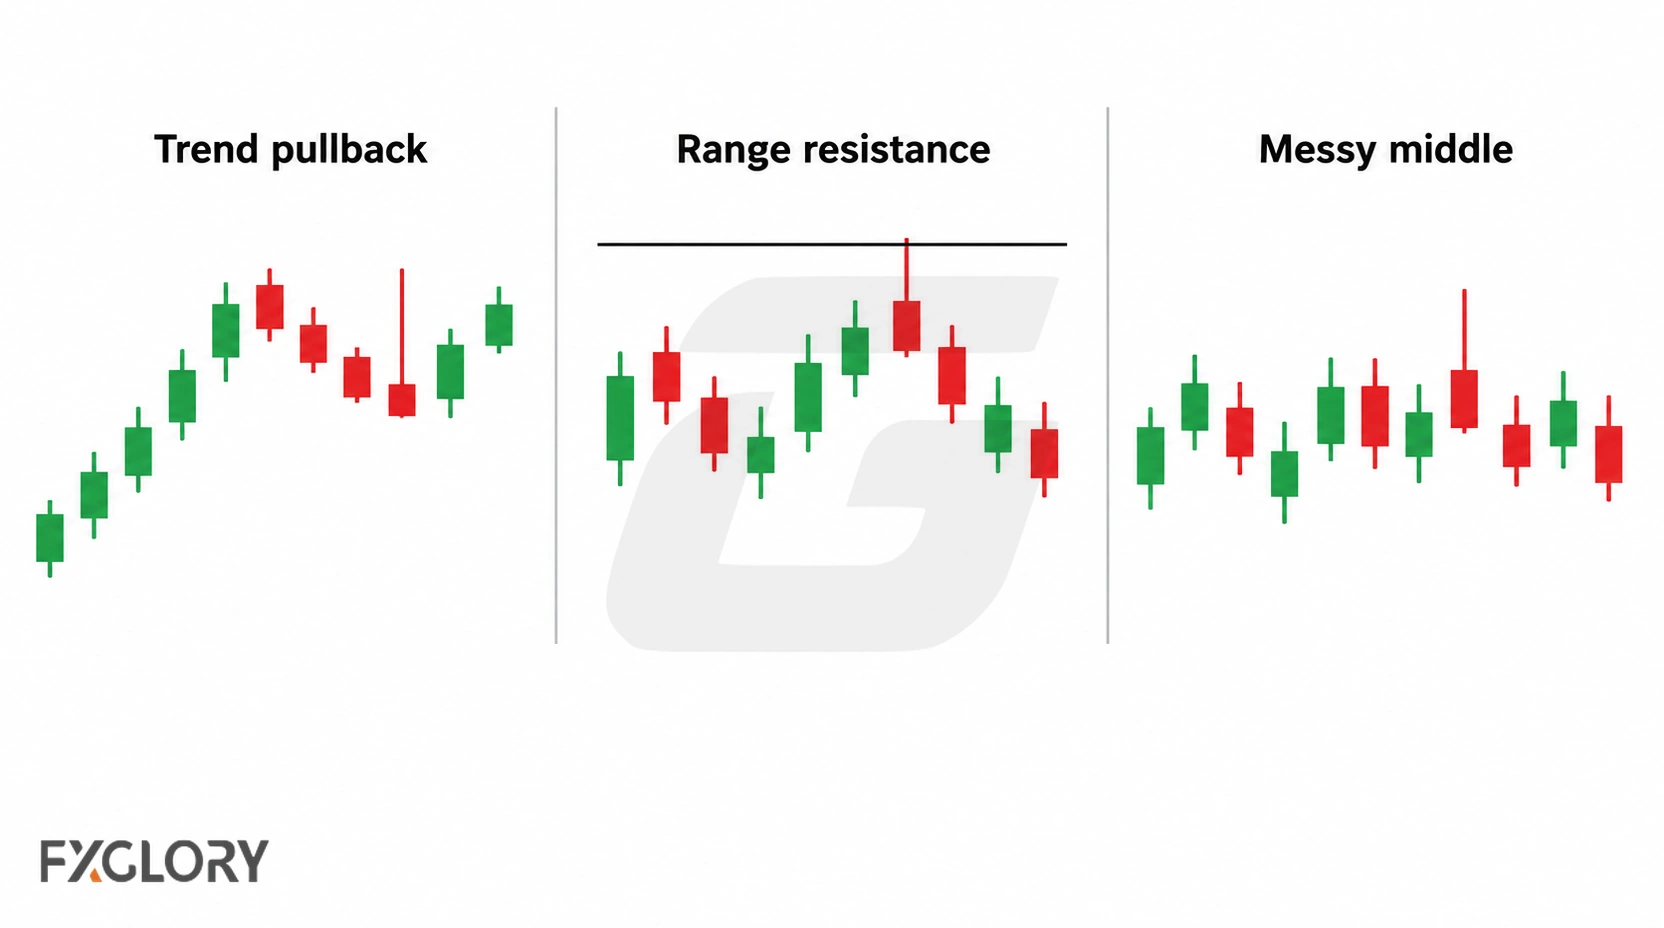
First classify the broader market condition; then identify a breakout or pullback event that may develop within it:
- Trend: price is making higher highs and higher lows, or lower highs and lower lows.
- Range: price is rotating between visible support and resistance.
- Breakout event: price moves beyond a previously marked range, level, or compression boundary; a completed close or other written condition determines whether the break qualifies.
- Pullback event: price retraces against a larger move; the relevant swing boundary determines whether the prevailing structure still holds.
- Transition: price is shifting from trend to range, range to breakout, or breakout to failure.
- Unclear condition: swings overlap, levels are messy, and signals appear in both directions.
If the condition is unclear, the best price action decision may be no trade. A clean strategy should filter out charts where the trader cannot define the structure in plain language.
Support And Resistance Rejection
Support and resistance rejection begins with a previously marked level, such as a swing high or low, a range edge, or a retested breakout zone. Reaching that level identifies a possible reaction area; only subsequent price behavior, such as a defined rejection close or failed move beyond the level, can satisfy the chosen rejection rule.
The sequence matters: mark the level first, observe the approach, and then evaluate the response against the written trigger. A wick alone does not establish the intrabar order of events or the identity of buyers and sellers.
- Mark the level from prior structure, not from a random candle.
- Wait for price to approach the level.
- Look for rejection, failed continuation, close behavior, or a retest response.
- Place invalidation beyond the level or beyond the rejection structure.
- Compare the next opposing level with the entry and invalidation distance before selecting a target.
Use the dedicated forex support and resistance strategy guide when the full setup depends on level selection, rejection, breakout, or retest rules.
Candlestick Trigger Strategies
Candlestick triggers describe observable ranges, bodies, wicks, and closing prices. A trader can use those measurements to time a setup at a marked level, but the candle itself does not reveal who initiated trades or establish what price will do next.
Pin bars can show rejection when a long wick forms at a level or pullback area. The weak version appears in the middle of a range without a clear level or trend context. Use the pin bar forex strategy when the setup depends on wick rejection.
Engulfing candles show a body that overtakes the preceding candle body under the chosen definition, which traders may interpret as a possible momentum shift after hesitation or rejection. The weak version appears after price has already traveled too far or directly into a nearby obstacle. Use the forex engulfing candle strategy when the setup depends on engulfing-candle rules.
Multi-candle reversal patterns such as evening-star or morning-star style structures can provide price action context near levels. They should still be judged by location, close behavior, invalidation, and target room. Use forex candlestick strategy when the setup depends mainly on candle-pattern structure.
Inside Bar, Fakey, And False Break Setups
An inside bar forms when the candle range sits inside the previous candle range. It can show compression before possible expansion, but it should not be traded only because the shape appears. The mother-bar range, trend context, location, and breakout side matter.
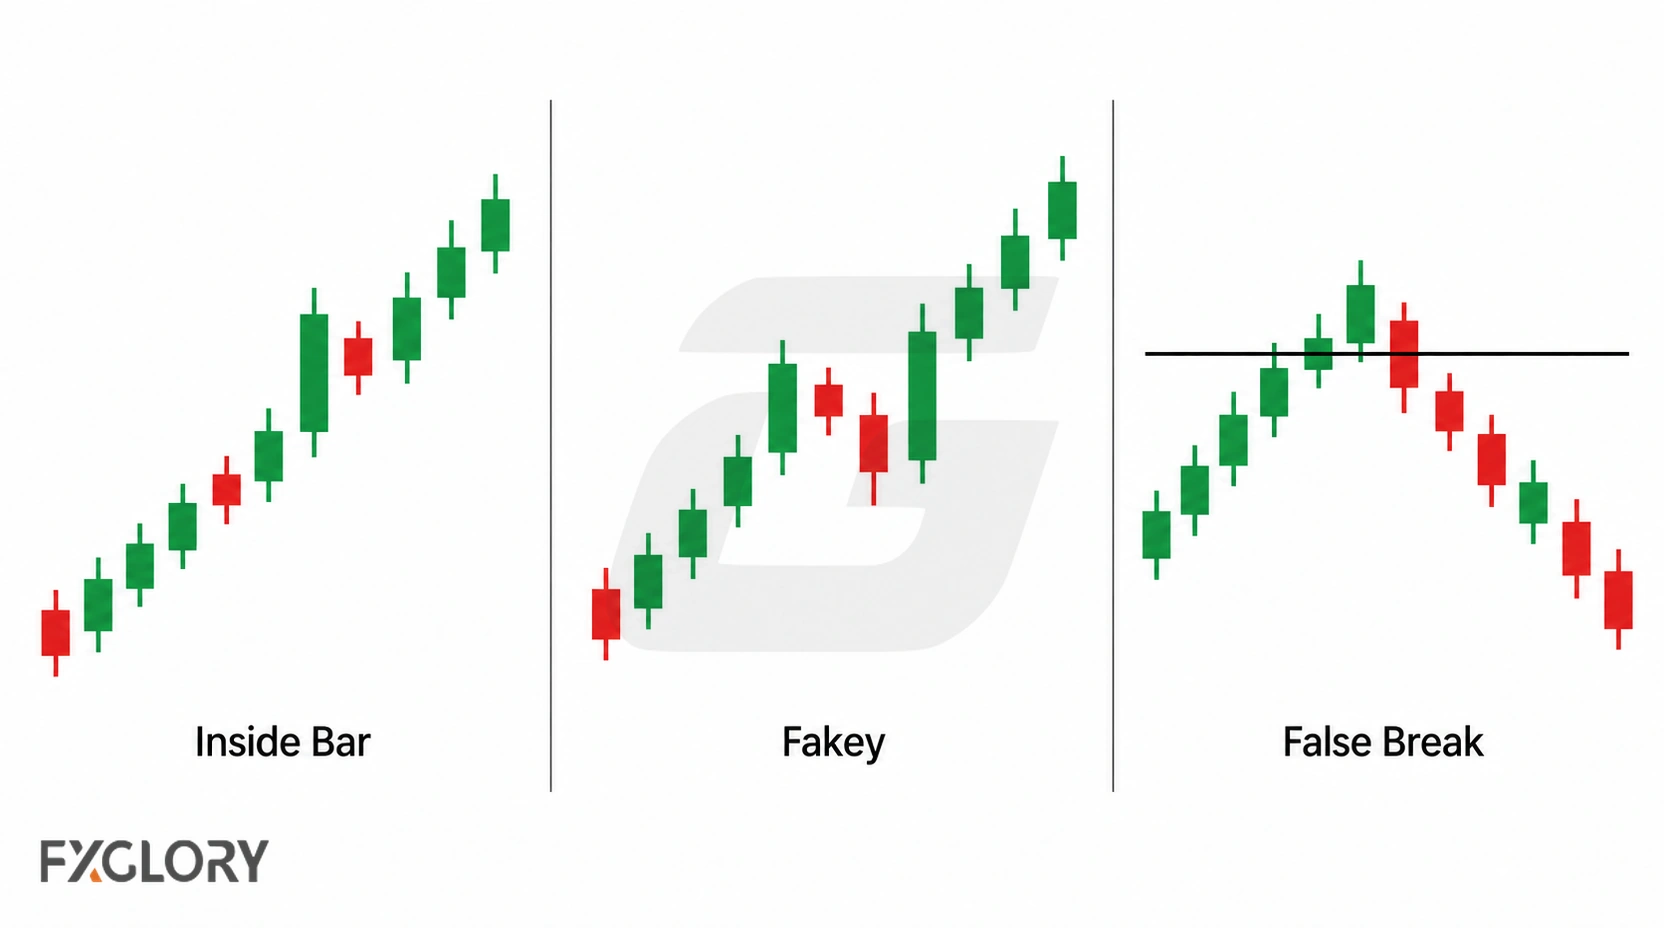
A fakey-style setup usually starts with compression, then a break that fails and returns back inside the prior structure. The useful question is not whether the pattern has a name. The useful question is whether the failed break changes the trade idea, creates a clear invalidation point, and leaves enough room for the target.
- Do not trade an inside bar in the middle of unclear structure.
- Do not accept a false-break idea without a clear return back inside structure.
- Do not use a very wide mother bar if the stop destroys the reward-to-risk plan.
- Do not switch from breakout logic to fakey logic after the breakout has already failed unless that rule was written before entry.
Use forex inside bar strategy for the complete inside-bar rule set.
Breakout, Retest, And Failed Breakout Logic
Breakout strategies use price action when price tries to move beyond a level, range, compression area, chart pattern boundary, or prior swing. The challenge is that not every break continues. Some breakouts fail quickly and trap late entries.
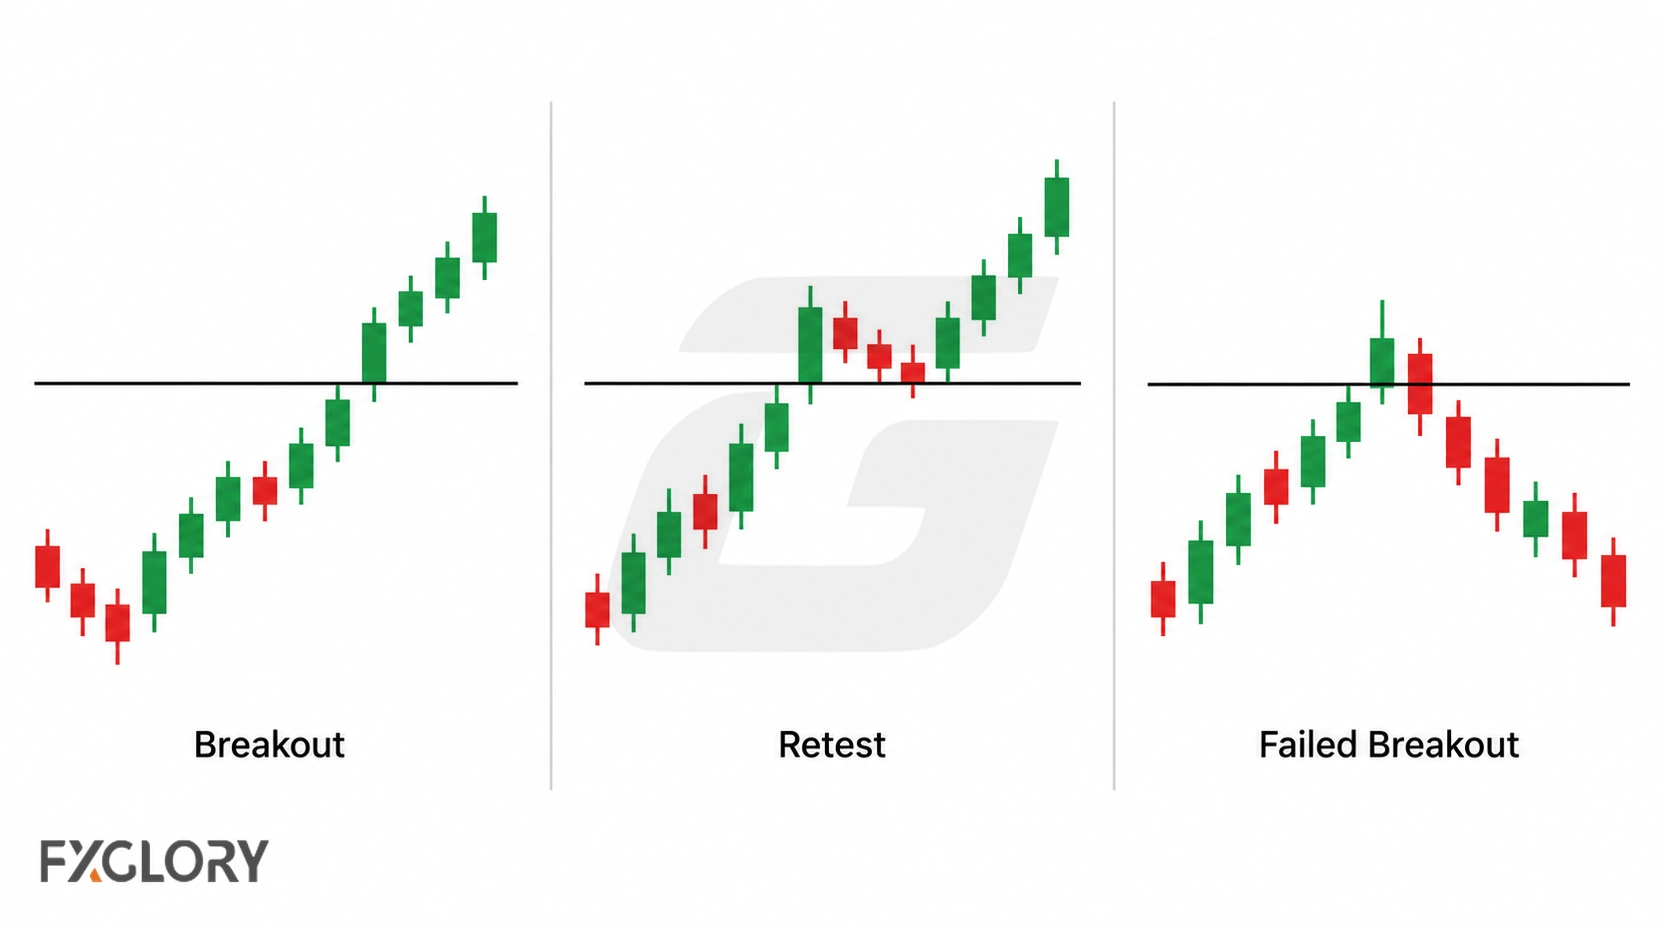
A breakout plan should define the type of break it accepts:
- Close-based breakout: price must close beyond the level before the setup is valid.
- Break and retest: price breaks the level, returns to test it, and then shows continuation.
- Momentum breakout: price exceeds a marked boundary by the predefined distance or close criterion, with the next opposing level assessed separately.
- Failed breakout: after a defined break beyond the level, price meets the written failure condition, such as a completed close back inside the prior range.
- Inside-bar breakout: price breaks the mother-bar range after compression.
The trader should decide before entry whether a failed breakout cancels the trade or creates a different setup. Use forex breakout strategy when the trade depends on range expansion, level breaks, or breakout failure risk.
Chart Patterns As Price Action Context
Chart patterns can support price action strategies because they organize market structure. Triangles, channels, flags, wedges, double tops, double bottoms, and ranges can highlight compression, potential continuation or reversal areas, and candidate breakout boundaries.
A chart pattern should not be forced after the move has already happened. It should create clear boundaries, invalidation, and decision points. The useful part of a pattern is not its label; it is the way it defines where price is trapped, where it breaks, and where the idea fails.
| Pattern Context | Price Action Use | Risk To Control |
|---|---|---|
| Triangle | Compression before expansion | False breakout and tight target room |
| Channel | Trend structure or range-like rotation | Late entries near the channel edge |
| Flag | Pullback continuation after a strong move | Continuation failure after exhaustion |
| Double top or double bottom | Rejection or failed continuation around a level | Entering before confirmation |
| Range or box | Rotation, breakout, or false-break setup | Mixing range-trade and breakout logic |
Use forex chart patterns when the setup depends mainly on pattern structure and boundaries.
Pullback, Trendline, And Continuation Logic
Price action pullback strategies look for continuation after price retraces inside a trend. The goal is not to chase price after a strong move. The goal is to wait for price to return to a location where risk can be defined.
A pullback may return to a prior swing, broken level, trendline, moving-average area, order block, fair value gap, or support and resistance zone. Each location can be assessed against the swing high or low that defines the existing directional structure; a breach of that level has a different meaning from a shallow retracement that leaves it intact.
- Confirm the larger trend or directional structure.
- Wait for a pullback into a defined area.
- Compare the pullback with a predefined swing boundary: has price closed beyond the higher low in an uptrend or the lower high in a downtrend, or does the original trend structure remain intact?
- Apply the chosen completion condition, such as a candle close back in the trend direction or a break of the pullback reaction high or low.
- Place the stop where the continuation idea fails.
Use forex trend trading strategy for trend context and forex pullback strategy for the full pullback framework.
Range, Box, And Liquidity Sweep Logic
Range strategies use price action when the market rotates between support and resistance. The trader looks for rejection near range edges, failed breakouts, or a move back toward the opposite side of the range.
A box strategy is a structured range approach. The trader defines the upper and lower boundary, then decides whether to trade rejection inside the box, breakout from the box, or a failed breakout back into the box. These should not be mixed without rules because each one has a different entry and invalidation.
What traders call a liquidity sweep is an observable move beyond a marked high or low followed by a return inside the earlier structure. Stops or pending orders may be clustered around such levels, but the chart alone does not prove that particular orders were triggered. The strategy should specify the break-and-return condition instead of assuming the order flow.
- Do not buy the bottom of a range if the range boundary is not clear.
- Do not sell the top of a range directly into strong breakout momentum.
- Do not treat every move beyond a high or low as a liquidity sweep.
- Do not trade range edges when news or session volatility can distort the level.
For range behavior, use forex range trading strategy. For liquidity concepts, use forex liquidity pools.
Order Block, Fair Value Gap, And Liquidity Context
Order blocks, fair value gaps, and liquidity pools are often used by traders who want more context behind price action. Traders use these labels to mark possible reaction or imbalance zones, but the labels alone cannot verify institutional participation or predict that price will revisit a zone.
An order block may point to a prior supply or demand area. A fair value gap may point to an imbalance where price moved quickly. A liquidity pool may point to a visible area where stops or pending orders could sit. These ideas still need price confirmation and invalidation.
| Concept | Useful Role | Weak Use |
|---|---|---|
| Order block | Marks a potential reaction zone from prior supply or demand behavior | Entering every touch without confirmation |
| Fair value gap | Marks an imbalance area that price may revisit or react around | Assuming every gap must be filled before price continues |
| Liquidity pool | Marks visible highs, lows, or clusters where orders may sit | Calling every break of a level a sweep |
| Structure shift | Flags an observable break in prior swing behavior that may support a change-of-structure hypothesis | Using a tiny lower-timeframe shift against a strong higher-timeframe trend |
Use order block forex, fair value gap forex, and forex liquidity pools when the setup depends mainly on that context.
Price Action Confirmation
Pattern identification means the specified candles or price structure are present. Confirmation requires a separate, predefined subsequent event—for example, a completed close beyond a level. A trade-ready plan then evaluates entry price, structural invalidation, stop, target, costs, and position size. One stage does not automatically establish the next.
| Confirmation Type | What It Shows | Weak Version |
|---|---|---|
| Rejection wick | Price tested a level and failed to hold beyond it | A long wick away from meaningful structure |
| Strong close | Price closed near one end of its candle range under the chosen body and close-location criteria | A strong close directly into nearby support or resistance |
| Retest hold | A broken level acts as support or resistance after the break | Retest happens in messy, low-room conditions |
| Structure shift | Price breaks the prior swing behavior | A tiny shift that conflicts with higher-timeframe structure |
| Failed continuation | Breakout or trend attempt cannot continue | Assuming failure before price returns inside structure |
A breakout close, a later retest, and follow-through on subsequent candles are distinct events. A strategy may require one or several of them; document which event is the trigger and which is only supporting evidence.
Using Indicators With Price Action
Price action can be used with indicators when each tool has a separate job. An indicator should support the decision process, not replace the price-based setup.
| Indicator Role | Possible Tool | Price Action Use | Weak Use |
|---|---|---|---|
| Trend filter | Moving average | Helps decide whether pullbacks align with the larger direction | Entering every moving-average touch without price confirmation |
| Volatility check | ATR | Helps judge stop distance and whether the market is expanding | Using the same stop size in every volatility condition |
| Momentum review | RSI or oscillator | Helps review exhaustion or divergence near structure | Buying or selling only because of overbought or oversold readings |
| Confluence | Multiple timeframe analysis | Separates higher-timeframe context from lower-timeframe entry | Ignoring the higher timeframe after a lower-timeframe trigger appears |
Use forex indicator strategies when an indicator becomes central to the method, and use forex multiple time frame analysis when the strategy depends on higher-timeframe context and lower-timeframe execution.
Entry, Stop, Target, And Exit Rules
Price action traders often focus on the entry, but the entry is only one part of the strategy. The stop and exit determine whether the setup can be reviewed with realistic risk.
| Rule | Price Action Example | Risk Check |
|---|---|---|
| Entry | Break above inside bar, retest of broken resistance, rejection candle at support | Entry should occur after the setup is valid, not after fear of missing out |
| Stop | Beyond mother bar, outside range edge, beyond rejection wick, behind swing low or high | Stop should mark invalidation, not a random small loss |
| Target | Next support or resistance, prior swing, range midpoint, range edge, measured move | Compare likely net reward with stop distance, including estimated transaction costs and nearby opposing structure |
| Exit | Failure to continue, opposite signal, time stop, partial close, trailing structure | Exit should be known before entry |
Use forex entry and exit strategy when building the full entry-to-exit sequence. Use forex risk management strategy before applying any setup with live exposure.
Timeframe, Session, Spread, And Execution Checks
Price action changes across timeframes and sessions. A pattern on a daily chart may reflect meaningful compression, while a similar pattern on a very low timeframe may be market noise. Lower timeframes can also be more sensitive to spread and slippage.
Before accepting a setup, check the trading environment:
- Timeframe: does the structure appear clearly on the chart used for decisions?
- Higher-timeframe context: does the setup conflict with a major level or trend?
- Session: do observed spreads, price range, and execution conditions fit the strategy's predefined trading window and cost limits?
- Spread: what share of the available entry-to-target distance would current spread and other expected costs consume?
- Slippage risk: could fast movement change the entry or stop outcome?
- News risk: is a scheduled event likely to distort the signal?
- Margin: does the position size fit available margin and account limits?
For short-target or low-timeframe entries, compare the observed spread and likely execution cost with the distance to the next target using FXGlory spreads. Estimate required margin for the intended size using the FXGlory margin calculator, without treating free margin as permission to take more risk. Check whether trading platforms support the needed pending-order type, stop management, chart timeframe, and exit workflow.
When Price Action Strategies Fail
A losing price-action trade can result from an unsuccessful but correctly executed rule set, unsuitable conditions, or a deviation from the written plan. Comparing entry location, volatility, actual cost, and higher-timeframe levels or swing direction helps identify which explanation fits the recorded trade.
- Location mismatch: the journal shows an entry away from the level specified in the setup rules.
- Undefined invalidation: the original trade record lacks a failure level or documents one only after entry.
- Late execution: the actual fill leaves less distance to the planned target than the signal-time plan allowed.
- Regime mismatch: the trade was classified as trend continuation even though recorded swings overlapped in a range.
- Cost assumption mismatch: recorded spread or slippage was worse than the amount used when evaluating expected reward.
- Event exposure: entry or exit occurred around scheduled news outside the permitted trading window.
- Unspecified trigger: the entry was justified by a pattern name rather than the actual close, break, or retest rule recorded before trading.
No-Trade Conditions
No-trade criteria apply before an order is placed, even when the observed price pattern matches its structural definition. Define them in advance so an appealing chart does not override a risk or execution constraint.
- Skip the trade if the market condition cannot be named clearly.
- Skip if the setup appears in the middle of a messy range.
- Skip if the candle trigger appears away from a meaningful level or structure.
- Skip if the stop has no logical invalidation point.
- Skip if the next support or resistance leaves poor target room.
- Skip if spread or slippage can erase the planned reward.
- Skip if a news event can distort the setup.
- Skip if the trade depends on hoping a false breakout will reverse without confirmation.
- Skip if the trader is switching from breakout logic to reversal logic after entry.
Backtesting Notes For Forex Price Action Strategies
This hypothetical educational model uses one daily price-action rule: an inside-bar fakey false-break setup with mother-bar filters, completed false-break confirmation, wick rejection, ADX filtering, ATR-based stop placement, a 1.5R target comparison, a pattern-failure exit, and spread/slippage sensitivity. It does not test pin bars, engulfing candles, support and resistance bounces, breakout-retests, chart-pattern trades, order blocks, fair value gaps, liquidity sweeps, indicator-supported setups, or discretionary price-action reads.
The model reviews EURUSD, GBPUSD, USDJPY, AUDUSD, USDCAD, and USDCHF on daily candles using public yfinance OHLC data where available. The mother bar, inside bar, false-break candle, stop, target, and failure level are defined before the simulated entry. The mother bar is the candle immediately preceding the inside bar; the false-break must appear within the next three daily candles, and any entry is at the next daily open after the completed false-break candle. Wick length in the specified 35% rejection filter is measured as a share of the full high-low range of the false-break candle.
| Rule Area | Educational Model Rule |
|---|---|
| Strategy type | Daily inside-bar fakey false-break price-action setup |
| Mother bar | Candle immediately before the inside bar, with range between 0.75 and 2.75 ATR(14) |
| Inside bar | High below the mother-bar high, low above the mother-bar low, and range no more than 0.70 of the mother-bar range |
| Inside-bar close | Close inside the middle 70% of the mother-bar range |
| False-break window | False-break candle must occur within 3 daily candles after the inside bar |
| Bullish fakey | Price breaks below the inside-bar low by 0.10 to 0.90 ATR(14), then closes above the inside-bar high with a bullish candle and lower wick of at least 35% |
| Bearish fakey | Price breaks above the inside-bar high by 0.10 to 0.90 ATR(14), then closes below the inside-bar low with a bearish candle and upper wick of at least 35% |
| ADX filter | ADX(14) no more than 40 |
| Entry | Next daily open after the completed false-break candle |
| Stop | Beyond the false-break candle extreme with a 0.25 ATR(14) buffer |
| Target comparison | Fixed 1.5R target from entry |
| Pattern-failure exit | Exit at daily close if price closes back through the opposite inside-bar boundary against the trade after entry |
| Maximum holding review | 15 daily candles after entry |
The review records trade count, win rate, average win in R, average loss in R, expectancy in R, profit factor, maximum drawdown in R, worst losing streak, average holding period, pair-level behavior, direction-level behavior, exit reasons, and spread/slippage sensitivity. Here R expresses each simulated outcome relative to its initial planned price risk; it is not a currency return or account-equity percentage. The model simulates neither a funded account balance nor lot sizing, leverage, or compounding.
| Cost Input | Assumptions Used |
|---|---|
| Spread | 0.5, 1.5, and 3.0 pips |
| Slippage | 0.1, 0.5, and 1.0 pips per side |
| Baseline comparison | 1.5-pip spread and 0.5-pip slippage per side |
| Swap and rollover | Not included |
Educational Sensitivity-Test Results
The hypothetical backtest used public yfinance daily OHLC data from 2016-06-29 through 2026-06-29 where available. The baseline cost assumption used a 1.5-pip spread and 0.5-pip slippage per side. The baseline result was negative, with expectancy of -0.2857R and total net result of -13.71R.
| Metric | Baseline Result |
|---|---|
| Number of trades | 48 |
| Win rate | 22.92% |
| Average win | 1.439R |
| Average loss | -0.7985R |
| Expectancy | -0.2857R |
| Profit factor | 0.5358 |
| Maximum drawdown | -16.62R |
| Worst losing streak | 10 |
| Average holding period | 2.17 daily candles |
| Median holding period | 1 daily candles |
| Total net result | -13.71R |
Pair-Level Baseline Results
| Pair | Trades | Win Rate | Expectancy | Profit Factor | Max Drawdown | Total Net Result |
|---|---|---|---|---|---|---|
| AUDUSD | 8 | 25% | -0.2504R | 0.5911 | -4.3074R | -2.0036R |
| EURUSD | 7 | 28.57% | -0.0963R | 0.8083 | -2.249R | -0.6741R |
| GBPUSD | 11 | 18.18% | -0.2645R | 0.4956 | -4.6419R | -2.9094R |
| USDCAD | 9 | 22.22% | -0.2429R | 0.5727 | -3.6469R | -2.186R |
| USDCHF | 6 | 16.67% | -0.6724R | 0.2635 | -5.4779R | -4.0344R |
| USDJPY | 7 | 28.57% | -0.2724R | 0.5997 | -2.2641R | -1.9069R |
Spread And Slippage Sensitivity
| Spread | Slippage Per Side | Trades | Win Rate | Expectancy | Profit Factor | Max Drawdown | Total Net Result |
|---|---|---|---|---|---|---|---|
| 0.5 pips | 0.1 pips | 48 | 29.17% | -0.2391R | 0.5876 | -14.45R | -11.48R |
| 0.5 pips | 0.5 pips | 48 | 25% | -0.2598R | 0.5636 | -15.42R | -12.47R |
| 0.5 pips | 1 pips | 48 | 22.92% | -0.2857R | 0.5358 | -16.62R | -13.71R |
| 1.5 pips | 0.1 pips | 48 | 25% | -0.265R | 0.5579 | -15.66R | -12.72R |
| 1.5 pips | 0.5 pips | 48 | 22.92% | -0.2857R | 0.5358 | -16.62R | -13.71R |
| 1.5 pips | 1 pips | 48 | 22.92% | -0.3116R | 0.5099 | -17.83R | -14.96R |
| 3 pips | 0.1 pips | 48 | 22.92% | -0.3038R | 0.5175 | -17.47R | -14.58R |
| 3 pips | 0.5 pips | 48 | 22.92% | -0.3245R | 0.4976 | -18.43R | -15.58R |
| 3 pips | 1 pips | 48 | 22.92% | -0.3504R | 0.474 | -19.64R | -16.82R |
Exit Reason Counts
| Exit Reason | Trades |
|---|---|
| pattern failure close | 13 |
| stop first same bar | 2 |
| stop loss | 22 |
| target 1 5r | 11 |
Testing And Review Checklist
Price action strategies should be tested with the same rule sequence that would be used in live markets. A review should not only record whether a pin bar, inside bar, breakout, or rejection candle won. It should record whether the setup followed the plan.
- Choose one setup type: do not mix every price action pattern into one test.
- Define the broader condition and event separately: record trend, range, transition, or unclear structure; then identify a breakout, pullback, or failed-break setup within it.
- Mark the required location: support, resistance, swing point, chart pattern boundary, range edge, order block, fair value gap, or liquidity area.
- Write the trigger: the exact candle, break, close, retest, rejection, or confirmation that allows entry.
- Write invalidation: the price or structure that cancels the idea.
- Record costs: include spread, slippage, and holding cost where relevant.
- Record execution quality: entry timing, stop placement, target management, missed rules, and emotional errors.
- Review no-trade examples: record why a candidate was rejected, whether the rule was applied consistently, and whether the rule filters unsuitable situations without excluding too many otherwise eligible setups. Use a forex trading journal to compare accepted, rejected, and rule-breaking cases.