

What Are Forex Indicator Strategies?
A forex indicator strategy is a rule-based method that uses one or more technical indicators to support trading decisions. The indicator may help define trend, momentum, volatility, timing, exit logic, or risk planning, but it should not replace market context.
This guide distinguishes the outputs of indicators from the market conditions, entry triggers, and risk rules needed to evaluate an indicator-based trading method. Specific indicator roles and limitations are covered in the sections below.
This page focuses on indicator use inside strategy rules. For the broader strategy map, use the parent guide to forex trading strategies. For indicator definitions and mechanics, use the separate guide to forex technical indicators.
Indicator Signal vs Setup vs Strategy
A common mistake is treating an indicator signal as a full trade decision. A signal is only one part of the process. A setup explains why the market is worth watching. A strategy explains how the trade is selected, managed, invalidated, and reviewed.
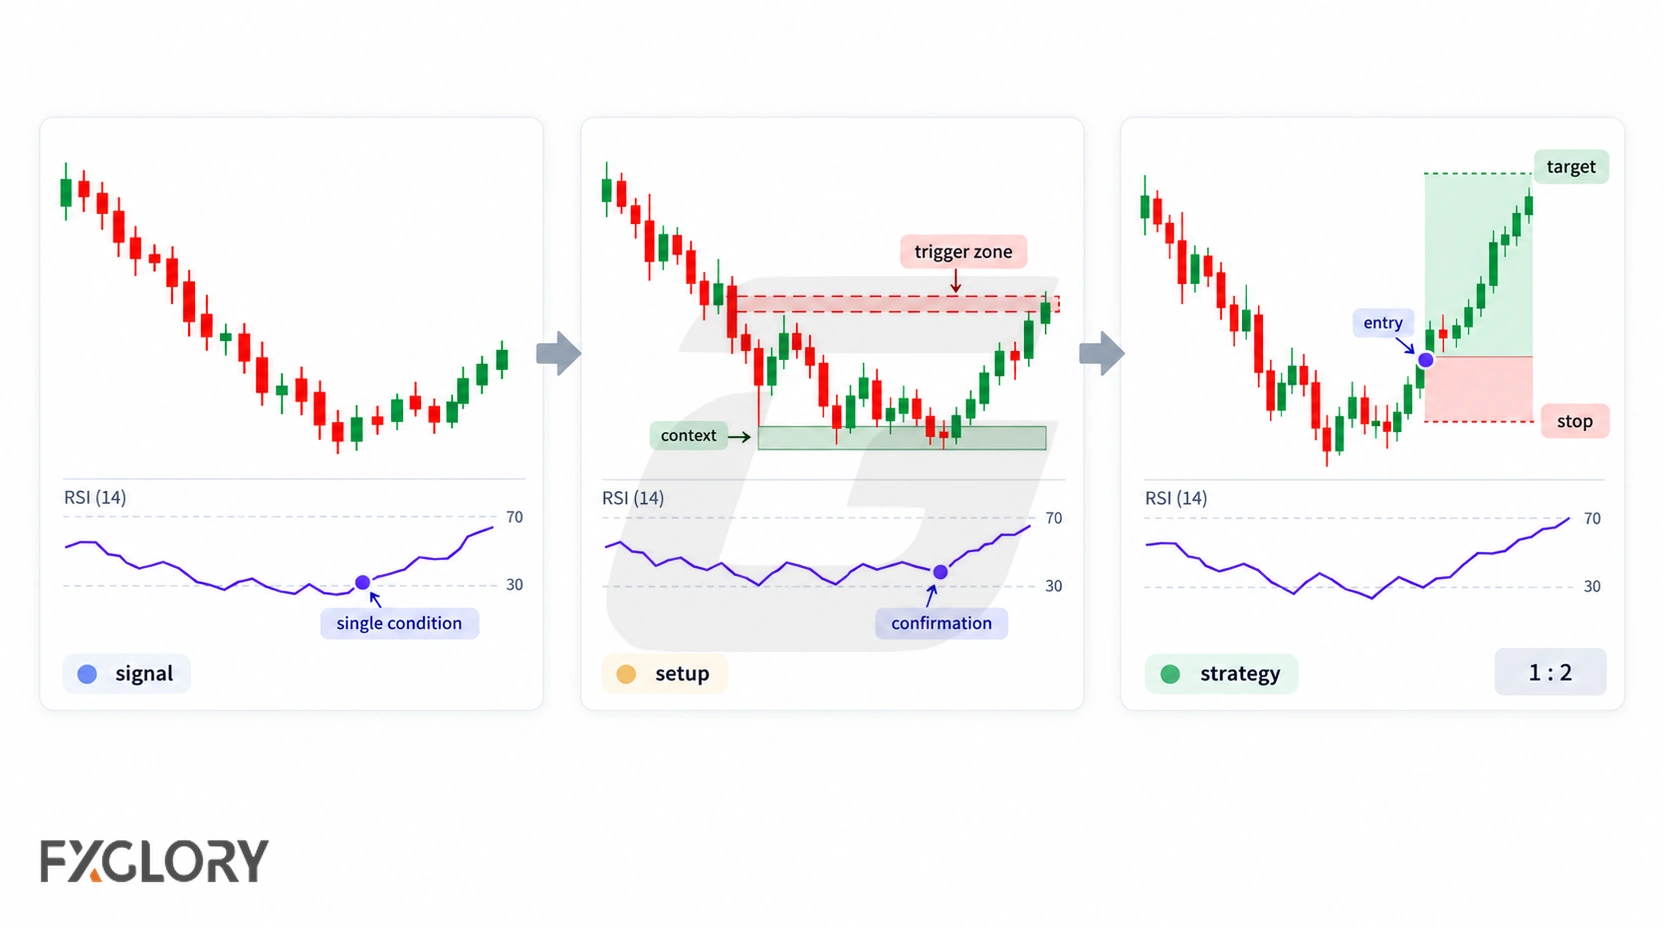
| Term | What It Means | Example |
|---|---|---|
| Indicator | The technical tool applied to the chart | RSI, MACD, ATR, ADX, moving average |
| Signal | The output or condition created by the indicator | RSI leaves an extreme zone or MACD crosses |
| Setup | The chart condition worth watching | Price pulls back in a trend while momentum weakens |
| Strategy | The full rule set for trading the setup | Trend filter, trigger, invalidation, risk, exit, and review |
For the full structure behind context, trigger, invalidation, risk, and review, use the guide to forex trading setups.
Choose Forex Indicators By Role
Assign each tool a testable function. For example, a directional filter and a trend-strength filter answer different questions; agreement between multiple calculations of the same price behaviour is not necessarily independent evidence.
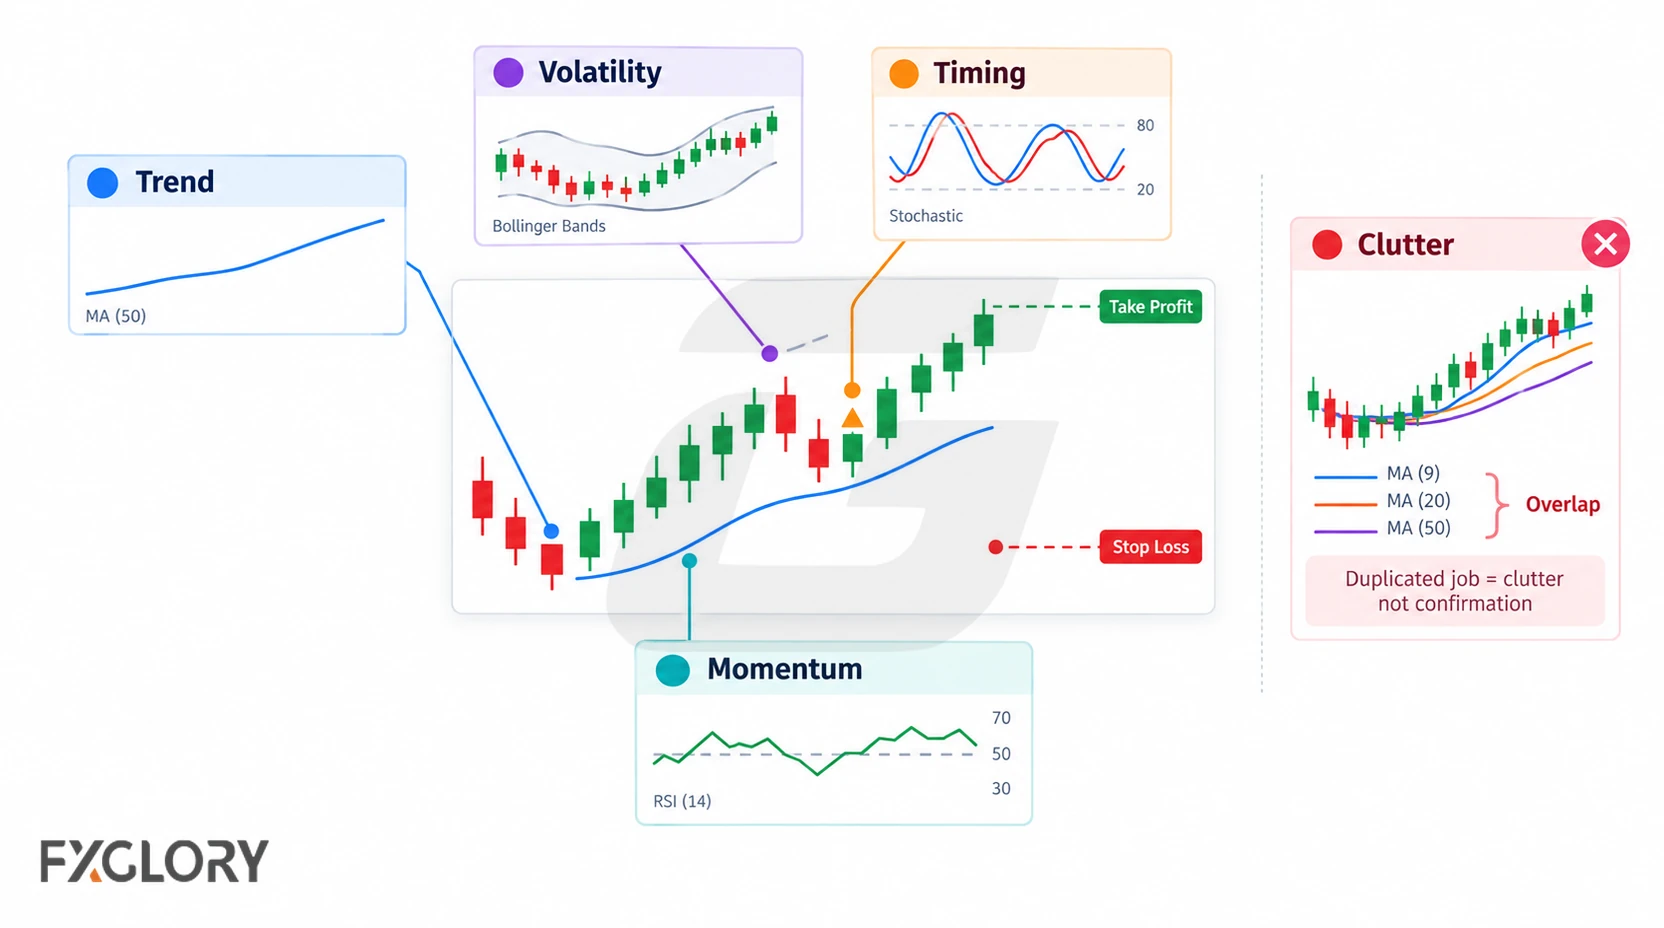
| Indicator Role | What It Helps With | Common Tools | Common Mistake |
|---|---|---|---|
| Directional trend filter | Identifying price direction or trend alignment | Moving averages, Alligator | Assuming an average slope guarantees continuation |
| Trend-strength filter | Measuring the strength of a trend, not its direction | ADX | Interpreting ADX alone as a buy or sell direction signal |
| Momentum check | Reading strength, weakness, or possible exhaustion | RSI, MACD, stochastic, CCI | Using several momentum indicators that repeat the same message |
| Volatility measure | Reviewing expansion, contraction, or stop distance | ATR, Bollinger Bands | Ignoring whether the target still makes sense after spread |
| Timing aid | Supporting entry timing after context is clear | Moving averages, MACD, RSI, stochastic | Entering only because a line crosses or a signal appears |
| Exit support | Helping with trailing, reduction, or review points | Moving averages, Parabolic SAR, ATR | Changing exits after the trade is already under pressure |
| Structure support | Marking swings, zones, or chart behaviour | ZigZag, Fractals, moving averages | Treating repainting or delayed structure tools as precise entry signals |
When trend is the main condition, review forex trend behaviour. When the indicator is used near a level, review support and resistance in forex so the signal is not floating without chart context.
Common Forex Indicator Strategy Roles
These indicators differ in what they measure and when their signals can be misleading. The descriptions focus on their specific behaviour and limitations rather than prescribing a standalone entry system.
Moving Averages As A Trend Filter
Moving averages can help filter direction, smooth price movement, or support pullback timing. A moving-average crossover may act as a timing signal, but it should not be used alone without market context.
- Useful role: Trend filter or timing aid.
- Needs context: A trending or directional market.
- Risk point: Crossovers can appear late in fast-moving markets and can whipsaw in ranges.
RSI As A Momentum Check
RSI can help review momentum conditions, overbought or oversold context, divergence, or a return from an extreme area. The signal is more useful when it appears near a meaningful level or inside a defined market condition.
- Useful role: Momentum check or exhaustion warning.
- Needs context: Trend, range, or support/resistance area.
- Risk point: RSI can remain extreme during a strong trend.
MACD As Confirmation
MACD can support a directional idea through crossovers, histogram changes, or momentum shifts. It is often more useful when it confirms an existing setup rather than creating a trade idea by itself.
- Useful role: Momentum and trend confirmation.
- Needs context: Directional movement or a setup already worth watching.
- Risk point: Signals can lag after price has already moved.
Bollinger Bands As Volatility Context
Bollinger Bands can help read volatility expansion, contraction, and price movement around a moving average. Some traders use the bands to study breakouts, mean reversion, or volatility changes, but the band touch alone is not a full strategy.
- Useful role: Volatility context, range pressure, or breakout observation.
- Needs context: Range, compression, trend, or level-based setup.
- Risk point: Price can ride the band during strong movement instead of reversing immediately.
ADX As A Trend-Strength Filter
ADX can help judge trend strength rather than direction by itself. In an indicator strategy, it can help decide whether trend-following rules deserve attention or whether the market may be too weak for continuation planning.
- Useful role: Trend-strength filter.
- Needs context: Directional setup from price structure or another tool.
- Risk point: ADX does not tell the trader where to enter or where the idea is invalid.
ATR As Risk And Volatility Support
ATR can help review average movement, stop distance, trailing logic, or volatility changes. It is usually a risk and volatility tool, not a directional signal.
- Useful role: Volatility measure and risk planning support.
- Needs context: A separate directional or range-based setup.
- Risk point: ATR can describe movement size, but it does not choose direction.
Stochastic And CCI As Momentum-Turn Tools
Stochastic and CCI are often used to study momentum turns, overbought or oversold context, and possible reversals. They are easier to review when used near a chart level rather than in the middle of unclear price action.
- Useful role: Momentum turn or overbought/oversold context.
- Needs context: Range, support/resistance, or price-action reaction.
- Risk point: Reversal signals can fail quickly in strong trends.
Parabolic SAR, Alligator, ZigZag, And Fractals As Support Tools
These tools are often used as support indicators. Parabolic SAR may help with trailing logic, Alligator may help describe trend phases, and ZigZag or Fractals may help visualize swings or structure. They should still be connected to a full trade framework.
- Do not treat a plotted marker or line change as a complete trade decision.
- Check whether the tool is delayed, repainting, or easier to interpret only after price has moved.
- Use the tool for one job, then define trigger, invalidation, and risk separately.
Some traders also review Aroon or volume-based tools such as OBV and Accumulation/Distribution. In forex, volume-style indicators should be handled carefully because available volume data may depend on the platform or feed, so they should be tested as support tools rather than treated as complete signals.
How To Combine Forex Indicators Without Cluttering The Chart
Compare each tool's input and calculation before treating the combination as additional evidence. Two differently named indicators may be closely correlated because both transform recent price movement; test whether adding one actually changes the rule set's results after costs.
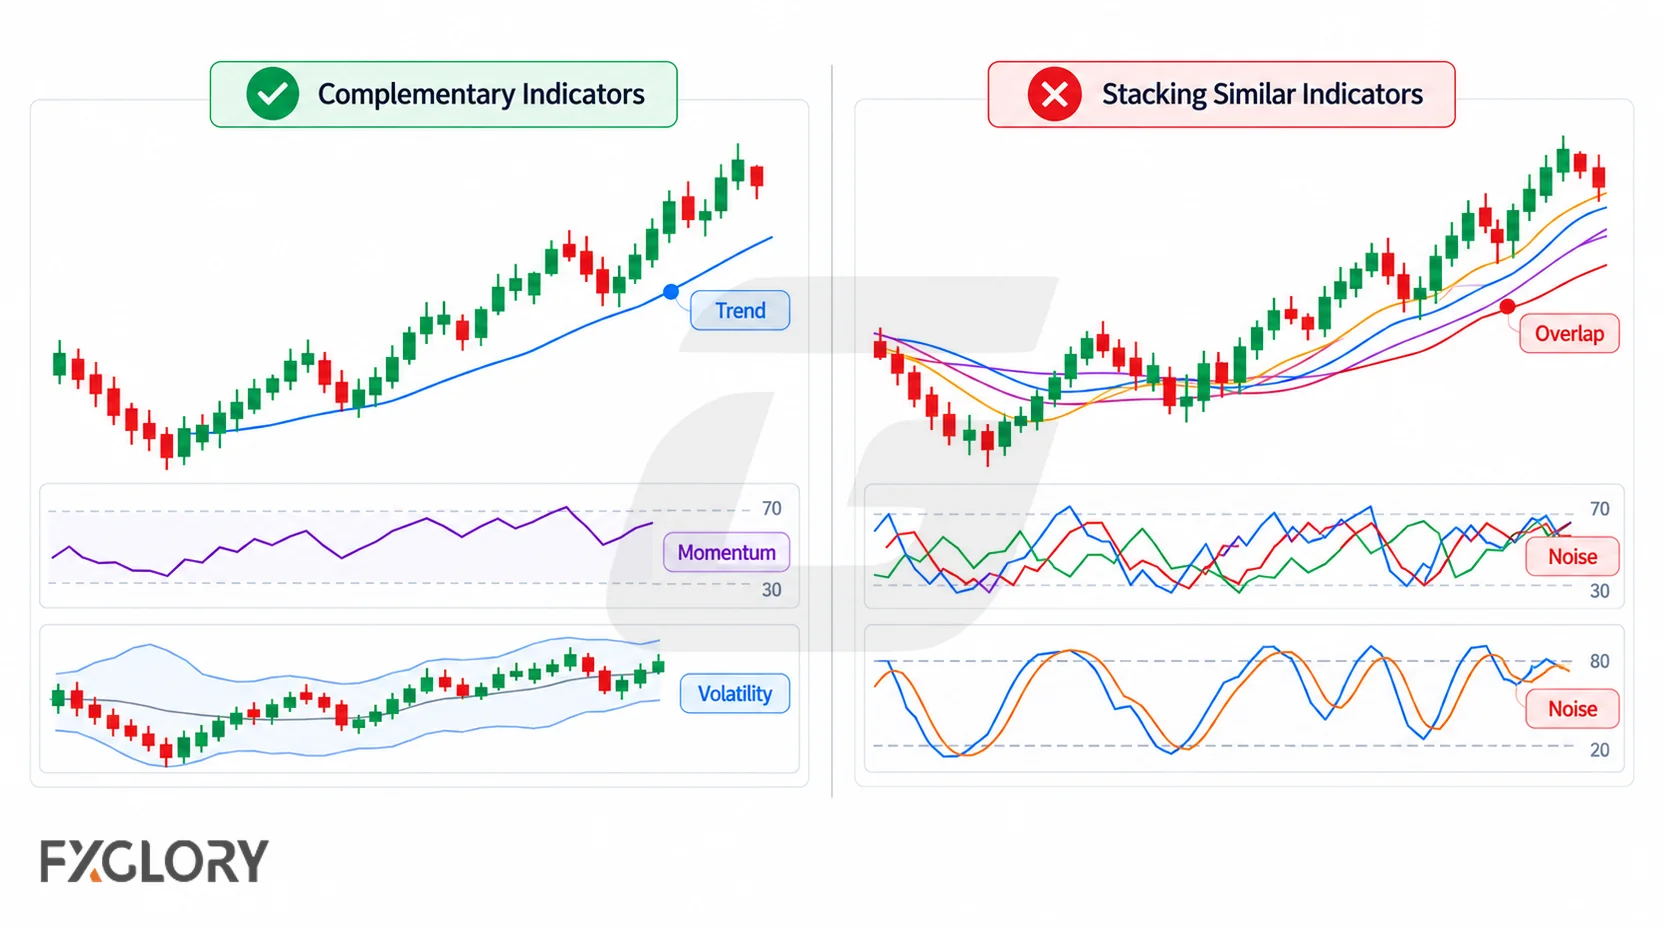
| Combination Type | Example Role Pairing | Why It Can Be Cleaner | What To Avoid |
|---|---|---|---|
| Trend plus momentum | Moving average plus RSI or MACD | One tool filters direction while the other checks momentum. | Entering when momentum conflicts with the price structure. |
| Trend strength plus trigger | ADX plus price-action or moving-average setup | ADX checks whether trend conditions are strong enough to study. | Using ADX alone as an entry signal. |
| Volatility plus risk | ATR plus support/resistance or trend setup | ATR helps review stop distance and market movement size. | Using ATR to choose direction. |
| Volatility plus momentum | Bollinger Bands plus RSI | One tool reads volatility pressure while the other checks momentum. | Assuming every band touch must reverse. |
| Structure plus confirmation | ZigZag or Fractals plus price-action confirmation | Structure tools help mark swings while the trigger comes from price behaviour. | Treating delayed swing markers as precise live signals. |
For deeper examples of role-based pairings, review forex indicator combinations, including ADX and Moving Average Strategy, ATR and ADX Strategy, ADX and RSI Strategy, and Bollinger Bands and RSI Strategy.
A Forex Indicator Strategy Framework
An indicator strategy should be built in the same order as any other strategy. The indicator role comes after the market condition, not before it.
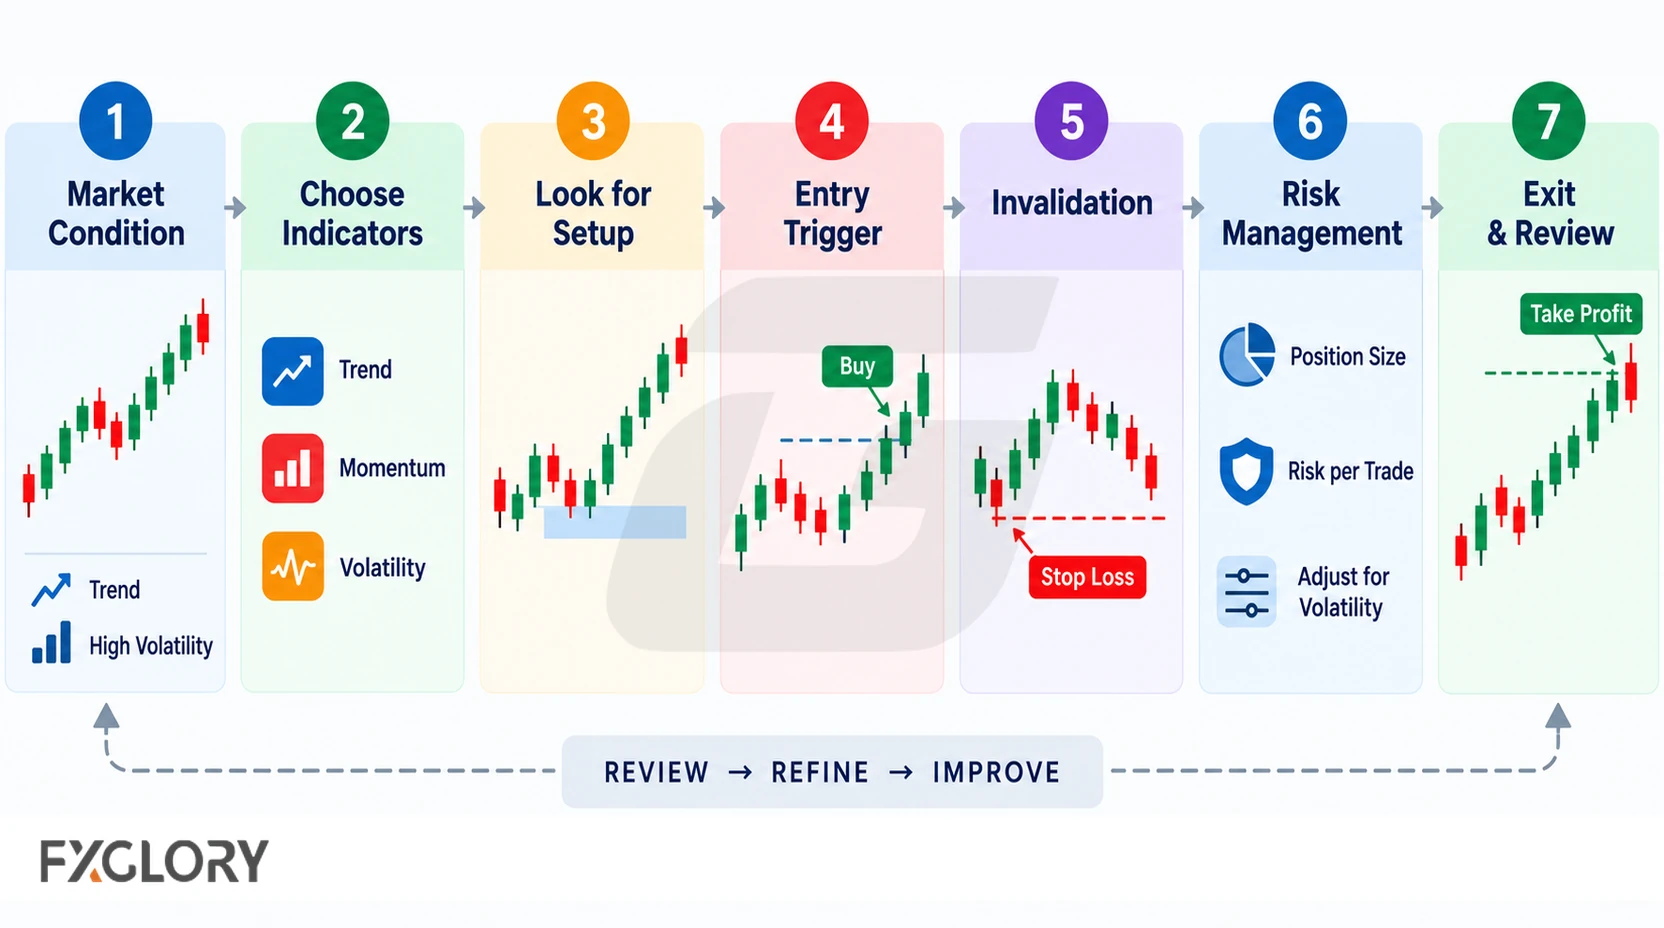
- Market condition: Is the pair trending, ranging, compressing, or unclear?
- Indicator role: Is the tool filtering trend, checking momentum, measuring volatility, supporting timing, or helping exits?
- Setup condition: What makes the chart worth watching?
- Trigger: What exact signal or price behaviour allows entry?
- Invalidation: Where or when is the trade idea wrong?
- Risk check: Does the target still make sense after spread, stop distance, position size, and margin are considered?
- Exit logic: Is the exit fixed, trailed, indicator-supported, structure-based, or time-based?
- Review rule: Was the indicator used for its role, or did the trader force the signal?
Use the forex trading setups framework when an indicator signal needs to be turned into a complete trade idea.
Worked Example: Trend Filter, Momentum Check, And Risk Support
The following hypothetical EUR/USD daily-chart example illustrates how separate indicators can be used in one candidate setup. These are invented prices and readings, not a historical trade or an observation from the educational backtest later in this article.
| Decision | Illustrative Observation | Interpretation |
|---|---|---|
| Direction | EMA(50) is above EMA(200) and price closes above EMA(50) | The chosen direction filter supports studying a long setup, but gives no entry by itself. |
| Momentum trigger | RSI(14) was 38 three completed candles earlier, then crosses from 44 to 47 on the signal candle | The hypothetical RSI readings meet a defined pullback-and-recovery example rather than an unspecified momentum impression. |
| Trend strength | ADX(14) reads 21 | This gives a numerical trend-strength observation; ADX alone does not indicate long versus short. |
| Entry and invalidation | Assume the next daily open fills at 1.1000 and the example stop is 1.0970 | The 30-pip stop distance is defined for this illustration. It is not claimed to reproduce the tested ATR-buffer stop. |
| Potential target | Illustrative target at 1.1045 | 45 pips of gross target distance versus 30 pips of stop distance gives 1.5R before costs. |
| Execution decision | Check spread, slippage, nearby price obstacles and account-risk position size | Skip the hypothetical entry if those conditions do not fit the prewritten rules. |
The indicator readings identify possible conditions, not the sequence of future prices. Actual stop placement, fill prices, transaction costs and target feasibility would need separate evaluation.
When Forex Indicator Strategies Fail
Indicator strategies often fail because the tool is used outside the condition it was meant to support. A trend tool can struggle in a range. A reversal indicator can fail during strong continuation. A volatility tool can describe movement without giving direction.
- No market context: The trader follows an indicator signal without checking trend, range, or structure.
- Duplicate indicators: Several momentum tools repeat the same message and create false confidence.
- Lagging entries: The indicator confirms only after price has already moved far from the risk area.
- No invalidation: The trader knows the signal but not where the idea is wrong.
- Spread problem: A short-term signal has too little room after trading cost.
- Over-optimization: Settings are adjusted to fit old examples but fail in current conditions.
- Script complexity: A custom or community-built indicator looks advanced, but the trader cannot explain its role, trigger, or risk rule.
- Event risk: News volatility changes the market condition before the indicator setup can be managed.
Before testing short-term or signal-heavy methods, review FXGlory spreads. When position size and stop distance need a margin check, use the FXGlory margin calculator.
Testing Forex Indicator Strategies
Evaluate a frozen set of rules across market conditions and out-of-sample periods. Unlike the pre-trade checklist below, this review asks whether the method can be reproduced, where its results are sensitive, and whether an additional indicator contributes measurable information.
- Define the sample: Record each pair, timeframe, data source, historical dates, warm-up data, and how missing observations were handled.
- Freeze the method: Store indicator versions, exact settings, entry and exit thresholds, signal lookbacks, candle-close timing, and risk assumptions.
- Avoid look-ahead: Use only indicator values and higher-timeframe candles that were complete at the decision point.
- Account for trading costs: Include spreads, entry and exit slippage, and overnight funding where applicable; disclose costs that cannot be modeled.
- Preserve rejected signals: Log signals skipped for market context, insufficient target room, duplicate indicators, news exposure, or portfolio risk.
- Analyze distributions: Review sample size, wins and losses, expectancy, drawdown, holding periods, and breakdowns by pair, direction, and market regime.
- Compare components: Test the stated strategy with and without a proposed extra indicator, using a documented method and the same cost assumptions.
- Test robustness: Use separate training and evaluation periods where feasible, and document changes to settings instead of treating repeated optimization as independent evidence.
Review available currency pairs before applying one indicator method across too many markets. Review FXGlory trading platforms when the strategy depends on charting tools, indicators, alerts, order placement, or trade-management workflow.
Backtesting Notes For Forex Indicator Strategies
This hypothetical educational model uses one daily indicator-role rule: EMA(50) and EMA(200) for trend direction, RSI(14) for pullback and momentum re-entry, ADX(14) for trend-strength filtering, ATR(14) for stop-buffer logic, a 1.5R target comparison, an indicator-failure exit, and spread/slippage sensitivity. It does not test MACD systems, Bollinger Bands, stochastic, CCI, Parabolic SAR, Alligator, ZigZag, Fractals, Aroon, OBV, Accumulation/Distribution, custom indicators, or discretionary indicator combinations.
The model reviews EURUSD, GBPUSD, USDJPY, AUDUSD, USDCAD, and USDCHF on daily candles using public yfinance OHLC data where available. The trend filter, RSI trigger, ADX filter, stop, target, and failure exit are defined before the simulated entry.
| Rule Area | Educational Model Rule |
|---|---|
| Strategy type | Daily EMA-RSI indicator pullback with ADX filter and ATR risk buffer |
| Trend role | EMA(50), EMA(200), and EMA(50) slope over 10 completed daily candles define direction |
| Momentum role | RSI(14) defines pullback and re-entry trigger |
| Trend-strength role | ADX(14) must be at least 18 and no more than 35 |
| Risk role | ATR(14) sets the stop-buffer distance |
| Long setup | Daily close above EMA(200), EMA(50) above EMA(200), EMA(50) slope over 10 completed daily candles positive, RSI(14) at or below 40 within the previous 5 completed daily candles, signal RSI crosses above 45, RSI no more than 60, and close above EMA(50) |
| Short setup | Daily close below EMA(200), EMA(50) below EMA(200), EMA(50) slope over 10 completed daily candles negative, RSI(14) at or above 60 within the previous 5 completed daily candles, signal RSI crosses below 55, RSI at least 40, and close below EMA(50) |
| Entry | Next daily open after the completed signal candle |
| Stop | Beyond the previous 5-candle extreme with a 0.25 ATR(14) buffer |
| Target comparison | Fixed 1.5R target from entry |
| Indicator-failure exit | Long exits at daily close below EMA(50) or RSI below 40; short exits at daily close above EMA(50) or RSI above 60 |
| Maximum holding review | 20 daily candles after entry |
The review records trade count, win rate, average win in R, average loss in R, expectancy in R, profit factor, maximum drawdown in R, worst losing streak, average holding period, pair-level behavior, direction-level behavior, exit reasons, and spread/slippage sensitivity.
| Cost Input | Assumptions Used |
|---|---|
| Spread | 0.5, 1.5, and 3.0 pips |
| Slippage | 0.1, 0.5, and 1.0 pips per side |
| Baseline comparison | 1.5-pip spread and 0.5-pip slippage per side |
| Swap and rollover | Not included |
Educational Sensitivity-Test Results
The hypothetical backtest used public yfinance daily OHLC data from 2016-06-29 through 2026-06-29 where available. Under an assumed 1.5-pip spread and 0.5-pip slippage per side, its 26 trades returned 0.0633R expectancy and 1.6452R total net, a positive but small observed outcome. This sample is too limited to establish a reliable edge; the individual pair samples contain only 3 to 7 trades, so unusually high pair-level ratios can be driven by very few observations.
| Metric | Baseline Result |
|---|---|
| Number of trades | 26 |
| Win rate | 34.62% |
| Average win | 0.9394R |
| Average loss | -0.4006R |
| Expectancy | 0.0633R |
| Profit factor | 1.2416 |
| Maximum drawdown | -2.52R |
| Worst losing streak | 5 |
| Average holding period | 6.88 daily candles |
| Median holding period | 3.5 daily candles |
| Total net result | 1.65R |
Pair-Level Baseline Results
| Pair | Trades | Win Rate | Expectancy | Profit Factor | Max Drawdown | Total Net Result |
|---|---|---|---|---|---|---|
| AUDUSD | 3 | 66.67% | 0.1572R | 34.8091 | -0.0139R | 0.4716R |
| EURUSD | 6 | 33.33% | 0.1658R | 2.0343 | -0.5955R | 0.995R |
| GBPUSD | 3 | 0% | -0.4164R | 0 | -0.8722R | -1.2493R |
| USDCAD | 3 | 33.33% | 0.0833R | 1.2272 | -0.0308R | 0.2499R |
| USDCHF | 4 | 25% | 0.1532R | 1.7168 | -0.855R | 0.6129R |
| USDJPY | 7 | 42.86% | 0.0807R | 1.215 | -1.2038R | 0.5652R |
Spread And Slippage Sensitivity
| Spread | Slippage Per Side | Trades | Win Rate | Expectancy | Profit Factor | Max Drawdown | Total Net Result |
|---|---|---|---|---|---|---|---|
| 0.5 pips | 0.1 pips | 26 | 38.46% | 0.0829R | 1.3305 | -2.42R | 2.16R |
| 0.5 pips | 0.5 pips | 26 | 34.62% | 0.0742R | 1.2901 | -2.46R | 1.93R |
| 0.5 pips | 1 pips | 26 | 34.62% | 0.0633R | 1.2416 | -2.52R | 1.65R |
| 1.5 pips | 0.1 pips | 26 | 34.62% | 0.072R | 1.2802 | -2.48R | 1.87R |
| 1.5 pips | 0.5 pips | 26 | 34.62% | 0.0633R | 1.2416 | -2.52R | 1.65R |
| 1.5 pips | 1 pips | 26 | 30.77% | 0.0524R | 1.1953 | -2.57R | 1.36R |
| 3 pips | 0.1 pips | 26 | 30.77% | 0.0556R | 1.209 | -2.56R | 1.45R |
| 3 pips | 0.5 pips | 26 | 30.77% | 0.0469R | 1.1728 | -2.6R | 1.22R |
| 3 pips | 1 pips | 26 | 30.77% | 0.036R | 1.1295 | -2.65R | 0.93R |
Exit Reason Counts
| Exit Reason | Trades |
|---|---|
| indicator failure close | 16 |
| stop loss | 2 |
| target 1 5r | 5 |
| time exit | 3 |
Forex Indicator Strategy Checklist
Use this brief screen for a specific candidate trade; the testing section above covers performance evaluation.
- Does the current market condition match the rule set's allowed conditions?
- Have the setup and exact entry trigger occurred, using completed data when the rules require it?
- Is the invalidation level defined, with position size inside the account-risk limit?
- Do quoted spread, plausible slippage, nearby obstacles, and available margin permit this trade?
- Are exit, event and no-trade conditions already written down?