

What Is A Bollinger Bands Forex Strategy?
A Bollinger Bands forex strategy uses Bollinger Bands to support trading decisions in currency pairs. The bands can help review volatility, price location, range pressure, squeeze conditions, trend strength, and possible overextension.
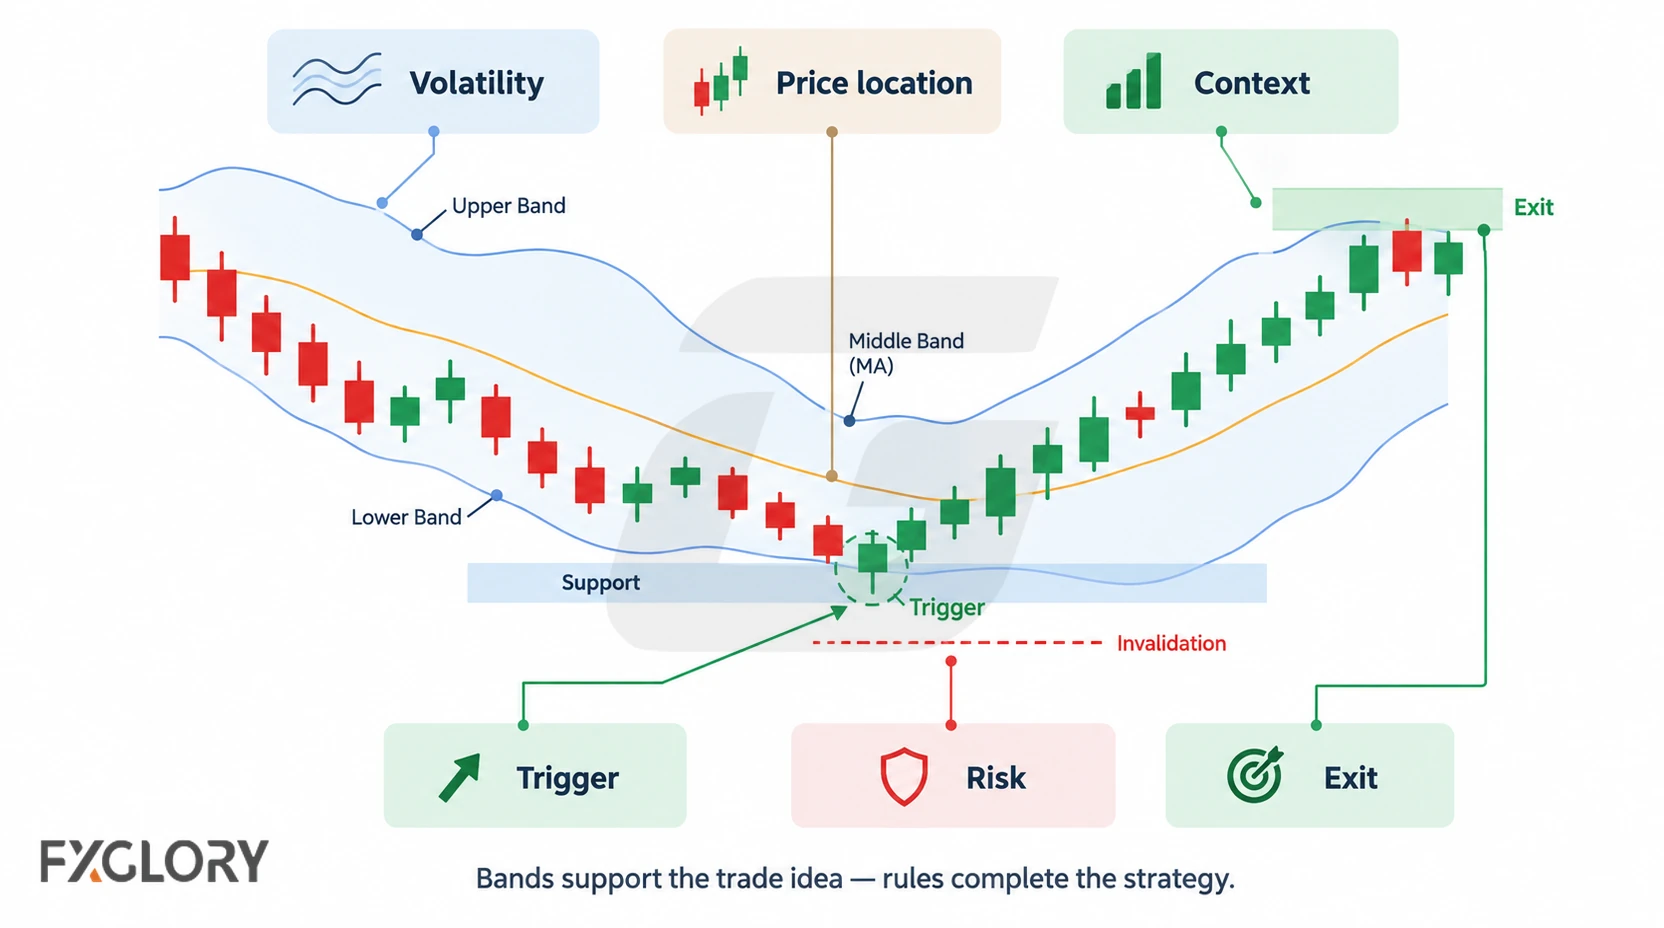
Band behavior only becomes useful when it is tied to a trade condition and a rule for being wrong. A complete Bollinger Bands strategy needs market context, a setup condition, an entry trigger, an invalidation point, position risk, exit logic, and review rules.
This page focuses on Bollinger Bands as a strategy tool. For the broader indicator-strategy framework, use forex indicator strategies. For Bollinger Bands mechanics, band structure, BandWidth, %B, settings, and indicator basics, use the dedicated Bollinger Bands Forex guide.
Band Touch vs Bollinger Bands Setup vs Strategy
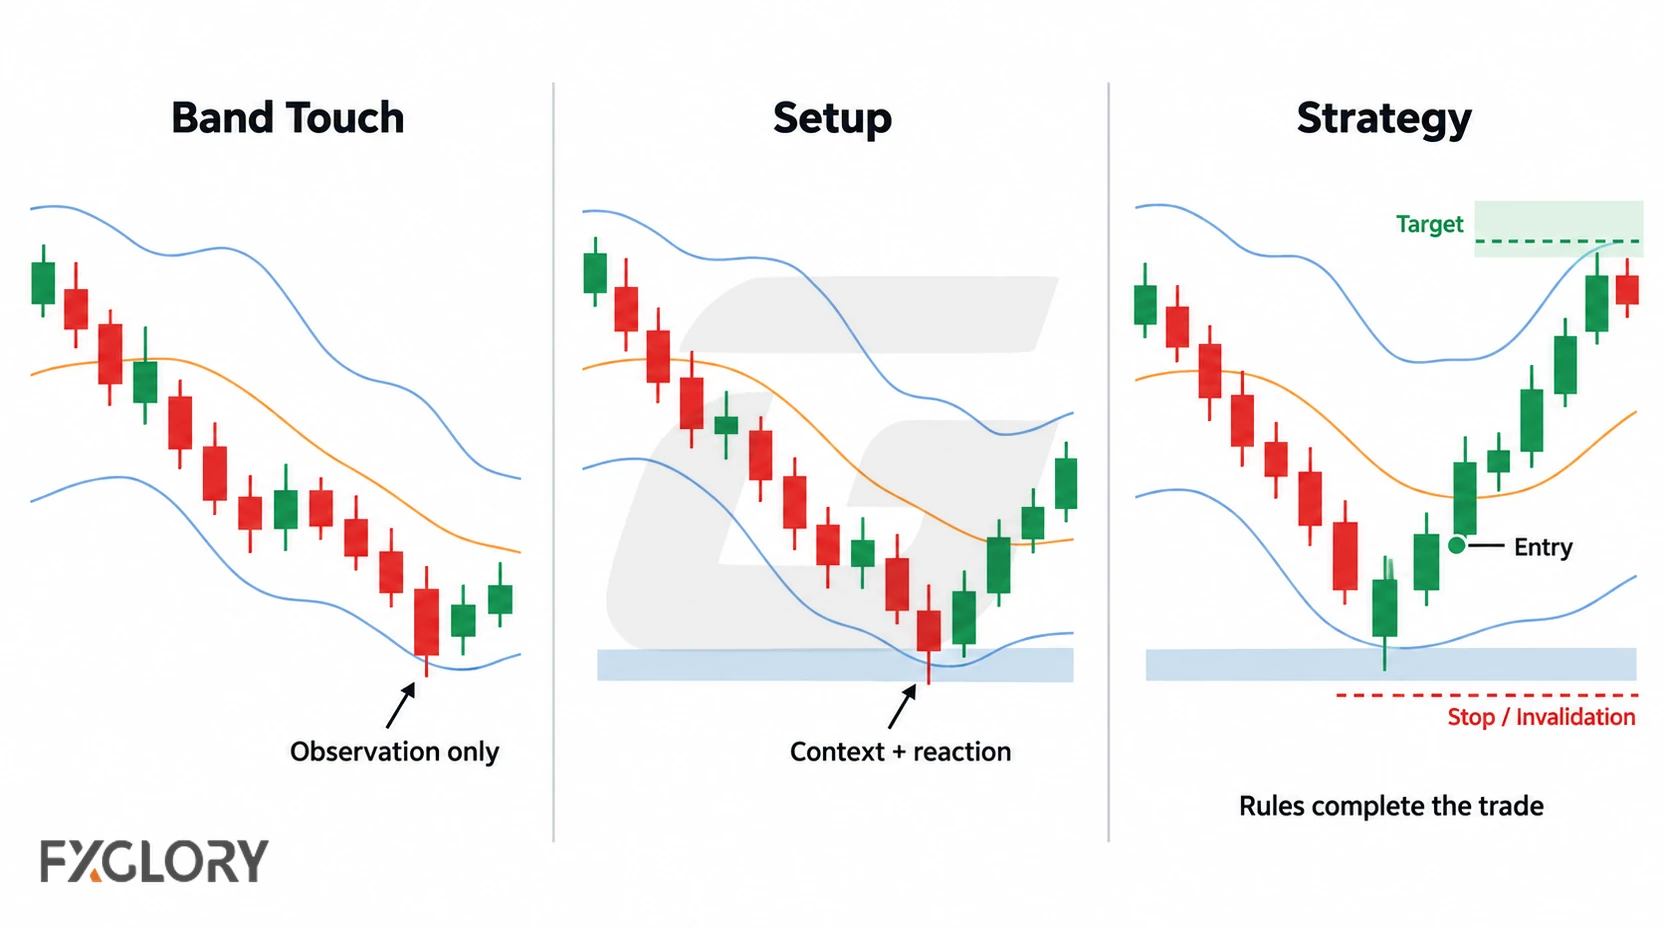
Many Bollinger Bands mistakes start when a trader treats a band touch as a complete trade decision. Price reaching the upper band, lower band, middle band, or a narrow squeeze may be useful, but only when the wider trade idea is clear.
| Term | What It Means | Bollinger Bands Example |
|---|---|---|
| Band touch | Price reaches or moves outside an upper or lower band | Price touches the lower band near a support area |
| Band condition | The band behaviour that makes the chart worth watching | Bands contract before a possible volatility expansion |
| Bollinger Bands setup | The chart condition where band behaviour becomes relevant | Price rejects the lower band while support still holds |
| Bollinger Bands strategy | The full rule set for trading the setup | Context, trigger, invalidation, risk, exit, and review rules |
| Bollinger Bands filter | A condition used to accept or reject another trade idea | Only consider breakout setups when the squeeze has ended with structure confirmation |
Use the forex trading setups framework when a band condition needs to become a structured trade idea.
Market Conditions Where Bollinger Bands Change Meaning
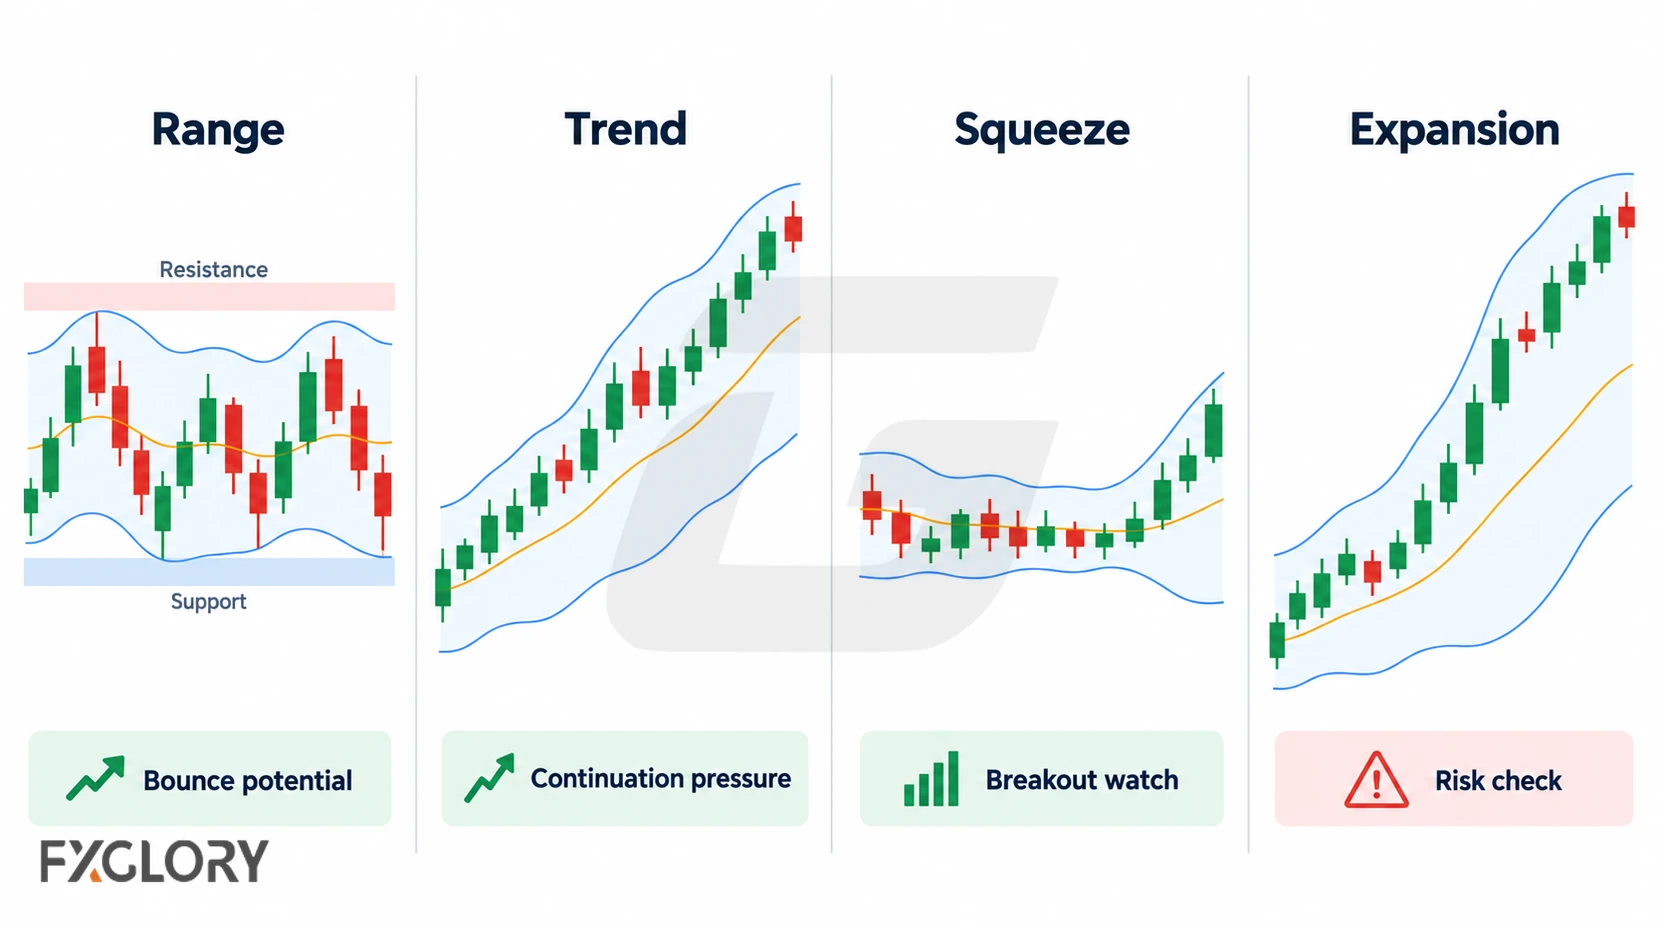
Bollinger Bands behave differently across market conditions. The same band touch can mean a possible range reaction, a trend continuation, a breakout warning, or no trade at all.
| Market Condition | Bollinger Bands Use | Better Focus | Skip When |
|---|---|---|---|
| Sideways range | Outer-band reactions | Band touch near support or resistance | The range breaks or becomes too narrow after spread |
| Clear trend | Band walk or middle-band pullback | Continuation with trend context | The trader uses the outer band to fight the trend without confirmation |
| Volatility compression | Squeeze observation | Breakout confirmation after bands narrow | The breakout direction is guessed before price confirms |
| Strong expansion | Momentum and risk check | Whether price is riding the band or becoming too extended | Price is already far from invalidation |
| Event volatility | Usually a caution filter | Wait until spread, slippage, and risk are definable | News changes the market before the setup can be managed |
When Bollinger Bands are used with directional movement, review forex trend behaviour. When they are used near range boundaries or reversal areas, review support and resistance in forex.
Bollinger Bands Forex Strategy Types
The examples below show how Bollinger Bands can support different strategy roles. They are not guaranteed systems, and each still needs confirmation, invalidation, risk control, and review.
Bollinger Band Bounce Strategy
A Bollinger Band bounce strategy watches for price reaction near the outer bands during a range or slower market. The lower band may become relevant near support, and the upper band may become relevant near resistance. The band touch matters only when the chart location supports the idea.
- Context: Price is rotating between visible support and resistance.
- Band role: Price-location and volatility boundary check.
- Trigger: Price confirms reaction at the range boundary or outer band area.
- Invalidation: Price breaks and holds beyond the range boundary or removes the reaction idea.
- Skip rule: Skip if the market is trending strongly or the range is too narrow after spread.
Bollinger Band Squeeze Strategy
A Bollinger Band squeeze strategy watches for narrow bands that show volatility compression. The squeeze does not show direction by itself. It only tells the trader that volatility has contracted and that a larger move may need attention if price confirms structure.
- Context: Bands narrow after a quieter period or compression phase.
- Band role: Volatility compression warning.
- Trigger: Price breaks structure and confirms direction after the squeeze.
- Invalidation: Price returns inside the old structure or the breakout fails.
- Skip rule: Skip if the breakout is only a fast spike with unclear stop placement.
Some traders compare Bollinger Bands with other volatility tools, such as Keltner Channel, when studying squeeze conditions. Treat that as confirmation context only; breakout direction, invalidation, and risk still need price structure.
Band Walk Trend Continuation Strategy
A band walk appears when price keeps moving along one outer band during a strong trend. This can trap traders who assume every upper-band touch must reverse or every lower-band touch must bounce. In a trend, the outer band may show pressure, not exhaustion.
- Context: Price shows clear directional structure.
- Band role: Trend pressure and continuation context.
- Trigger: Price continues with the trend after a controlled pause or pullback.
- Invalidation: Price breaks the structure that supported the trend idea.
- Skip rule: Skip reversal entries based only on an outer-band touch.
Middle Band Pullback Strategy
The middle band is commonly based on a moving average. In a trend, some traders use it as a reference area for pullbacks or continuation review. The middle band should not replace price structure; it should support the context already visible on the chart.
- Context: Directional market with controlled pullbacks.
- Band role: Pullback reference and timing support.
- Trigger: Price reacts near the middle band and resumes with the trend.
- Invalidation: Price breaks the structure behind the trend or pullback idea.
- Skip rule: Skip when the middle band is flat and price is choppy.
Double Bollinger Bands Zone Filter
Double Bollinger Bands use two sets of bands to divide the chart into zones. This can help traders study whether price is pressing into a stronger directional zone or returning toward a middle area. It should still be treated as a filter, not a complete entry method.
A full Double Bollinger Bands strategy would need separate rules for zones, trend context, triggers, invalidation, and exits. This section only explains how double bands can act as a zone filter.
- Context: Directional or range condition already visible on the chart.
- Band role: Zone filter for trend pressure, pullback, or range behaviour.
- Trigger: Price action confirms the zone-based idea.
- Invalidation: Price leaves the zone in a way that removes the strategy context.
- Skip rule: Skip when zones create confusion instead of clearer rules.
Bollinger Bands With RSI Or MACD
Bollinger Bands can be combined with RSI or MACD when each tool has a separate role. Bollinger Bands may review volatility and price location, RSI may check momentum, and MACD may support momentum or directional confirmation.
A full Bollinger Bands and RSI strategy would need separate rules for market condition, trigger, invalidation, risk, and exit. This section only explains role separation so the main Bollinger Bands page does not become an indicator-combination article.
Volume-style tools may be used by some traders as confirmation, but in forex they should be tested carefully because available volume data can depend on the platform or feed.
- Do not use multiple tools only to make a band touch feel more certain.
- Use Bollinger Bands for volatility or location, RSI for momentum, and price structure for invalidation.
- Skip the setup if the tools conflict and the chart context is unclear.
For RSI-specific strategy rules, use the RSI forex trading strategy guide.
Using Settings, BandWidth, And %B Inside Strategy Rules
The common default Bollinger Bands setting uses a 20-period moving average with bands placed two standard deviations away. In strategy use, the setting should be tested as part of a rule set, not changed after every losing trade.
| Band Tool Or Setting | Strategy Use | Main Risk |
|---|---|---|
| 20-period, 2-standard-deviation bands | Use as a baseline for testing band behaviour inside a written strategy. | Not automatically suitable for every pair, timeframe, or setup type. |
| Shorter setting | Use only if the strategy needs faster band reaction and the extra signals are reviewable. | More noise, more false signals, and more spread sensitivity. |
| Longer setting | Use only if the strategy needs smoother band behaviour and fewer signals. | Later confirmation and fewer examples to review. |
| BandWidth | Use only as a compression or expansion filter before checking breakout structure. | Shows volatility change, not trade direction. |
| %B | Use only as a price-location filter before checking trigger and invalidation. | Location data still needs market context and price confirmation. |
Shorter timeframes can create more band touches and more squeeze signals, but they can also make spread and timing more important. Before testing short-term Bollinger Bands methods, review FXGlory spreads.
Bollinger Bands Multi-Timeframe Confirmation
Bollinger Bands can be reviewed across more than one timeframe, but each timeframe should have a different job. The goal is to clarify context, not to collect conflicting band signals.
| Timeframe Role | What To Check | Use In The Strategy | Skip If |
|---|---|---|---|
| Higher timeframe | Trend, range, major level, or broader volatility condition | Defines the background context for the band idea | The lower-timeframe setup fights the broader structure |
| Trading timeframe | Band touch, squeeze, band walk, or middle-band pullback | Defines the setup being reviewed | The band signal appears in unclear price action |
| Entry timeframe | Price trigger, rejection, structure shift, or retest | Helps refine entry and invalidation | The entry timeframe creates noise instead of clearer risk |
Worked Example: One Band Touch, Four Outcomes
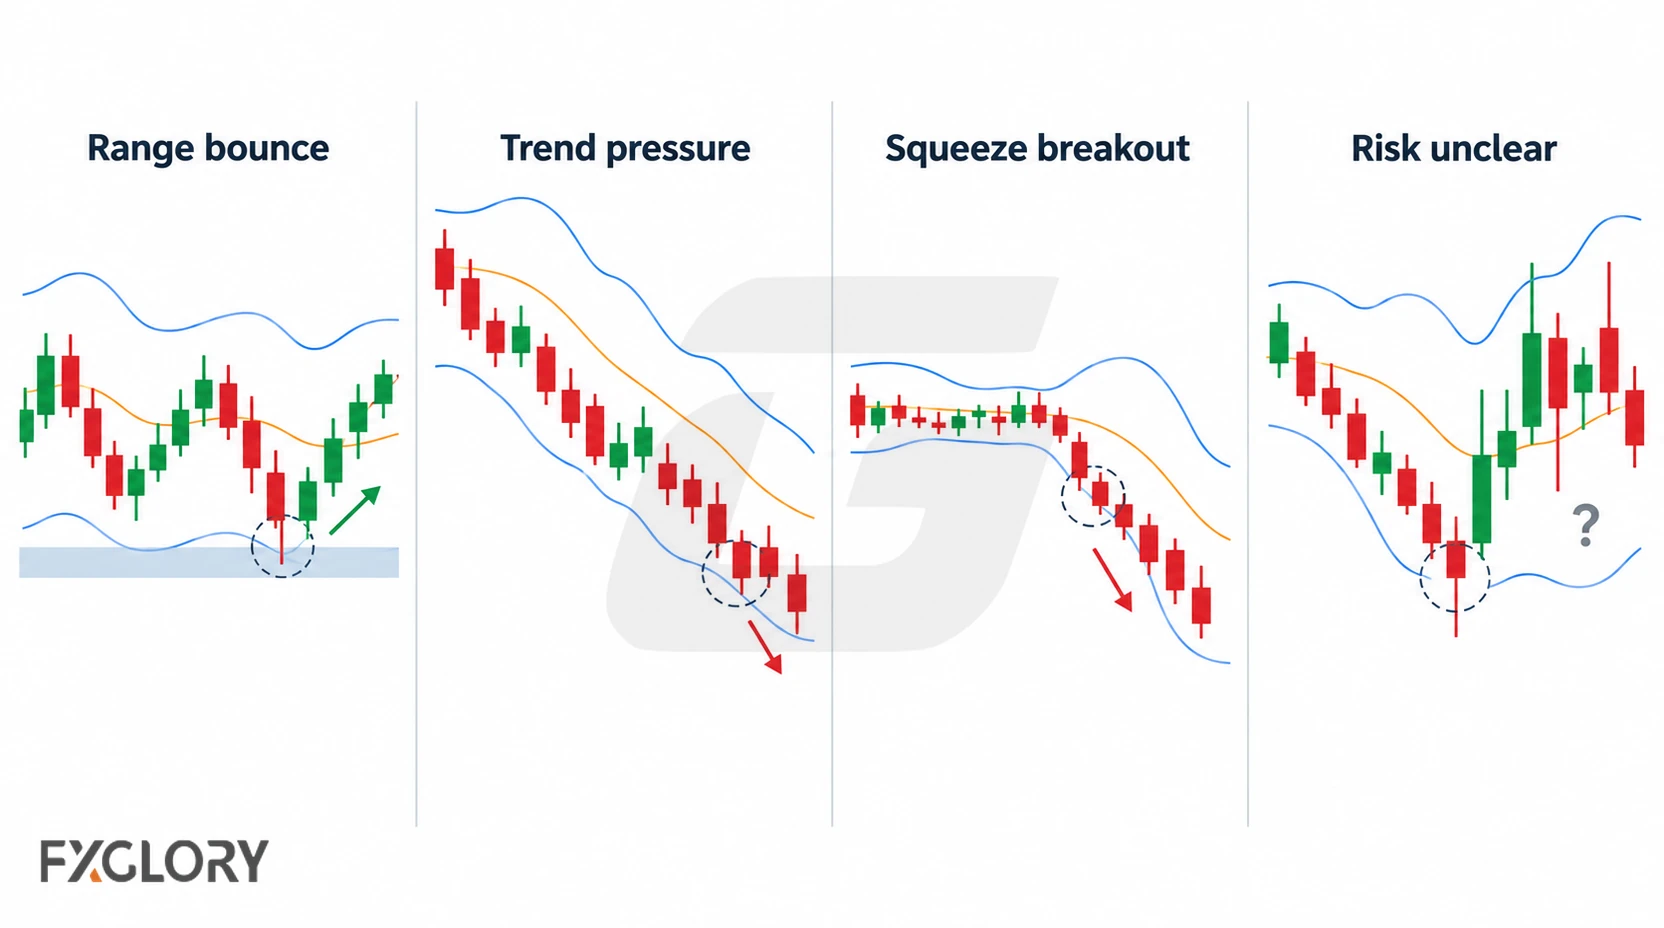
Assume a currency pair touches the lower Bollinger Band near a visible support area. That does not automatically create a buy setup. The trader still needs to check the market condition and the reason price reached the band.
| Observation | Possible Meaning | Next Check | Skip If |
|---|---|---|---|
| Price is in a clear range and near support | The band touch may support a bounce idea | Wait for price confirmation at support | Support breaks and holds lower |
| Price is in a strong downtrend | The lower-band touch may show trend pressure | Check whether price is walking the band | The trade fights the trend without confirmation |
| Bands were narrow before price broke lower | The move may be a squeeze breakout | Check whether structure confirms the breakout | The breakout is only a spike and returns inside the range |
| Spread or volatility expands suddenly | Risk may become harder to define | Check target, stop distance, and execution conditions | The loss scenario is unclear |
When Bollinger Bands Forex Strategies Fail
Bollinger Bands strategies often fail when the bands are used outside the condition they were meant to support. A bounce setup can fail in a trend. A squeeze breakout can fail after a spike. A band walk can continue longer than a reversal trader expects.
- Automatic band-touch entries: Buying the lower band or selling the upper band without confirmation can be risky in strong trends.
- No price context: The band signal is used without support, resistance, trend, or structure.
- Fighting a band walk: Price keeps riding the outer band while the trader expects immediate reversal.
- Squeeze without breakout confirmation: Narrow bands show compression, but they do not predict direction by themselves.
- Late entry: The confirmation appears after price has already moved away from the risk area.
- Settings changed too often: Band settings are adjusted after each loss, making the test unreliable.
- Duplicate confirmation: Bands are combined with tools that do not add a separate role.
- Spread problem: A short-term band signal has too little room after trading cost.
- Event risk: News volatility changes the market before the Bollinger Bands setup can be managed.
When position size, stop distance, and margin need to be checked together, use the FXGlory margin calculator.
Testing A Bollinger Bands Forex Strategy
A Bollinger Bands strategy should be tested as a full rule set, not as one band touch. Testing should include clean examples, false breakouts, failed bounces, band walks, late entries, ranges, strong trends, volatile periods, multi-timeframe conflicts, and skipped setups.
- What market condition does the Bollinger Bands strategy need?
- Are the bands being used for range reaction, squeeze, trend continuation, middle-band pullback, or volatility context?
- What band touch, squeeze, expansion, or price behaviour triggers attention?
- What price action or structure confirms the entry?
- Where is the idea invalid?
- Does the target still make sense after spread?
- Does stop distance fit position size and margin exposure?
- Are Bollinger Bands settings kept consistent during the test?
- Are false band touches, failed squeeze breakouts, and skipped setups recorded?
- Does the result change across selected currency pairs or timeframes?
Review available currency pairs before applying the same Bollinger Bands method across too many markets. Review FXGlory trading platforms when the strategy depends on charting tools, Bollinger Bands settings, alerts, order placement, or trade-management workflow.
Bollinger Bands Forex Strategy Checklist
Before using a Bollinger Bands forex strategy, answer these questions.
- Is the market trending, ranging, compressing, expanding, or unclear?
- What role do Bollinger Bands play in this strategy?
- Is the band signal near a meaningful chart area?
- Does the higher timeframe support or conflict with the band idea?
- Is there confirmation from price structure or another defined tool?
- Where is the trade idea invalid?
- Are the band settings fixed for the test?
- Does the setup still make sense after spread?
- Does position size fit stop distance and margin?
- What closes or reviews the trade?
- What condition makes the band signal a no-trade?
A Bollinger Bands forex strategy is useful only when the bands support a clear trading rule. The indicator can help read volatility and price location, but it should not replace market context, invalidation, risk control, or review.
Bollinger Bands Setup-Type Test Notes
This hypothetical educational Bollinger Bands setup-type test reviewed five Bollinger Bands setup types: outer-band range reaction, squeeze breakout, band-walk continuation, middle-band pullback, and double-band zone continuation. Bollinger Bands are used for volatility and price-location context, not as automatic buy or sell signals. The test does not prove that Bollinger Bands are profitable or that one setup type is universally best.
The model reviewed EURUSD, GBPUSD, USDJPY, AUDUSD, USDCAD, and USDCHF using public yfinance 15-minute OHLC data where available. The 1H candles are resampled from the same 15-minute data so that context and setup timing have defined roles.
| Setup Type | Educational Model Rule |
|---|---|
| Outer-band range reaction | Reviews lower-band or upper-band reactions only when 1H context is range-like |
| Squeeze breakout | Reviews breakouts after compressed BandWidth when price also breaks recent structure |
| Band-walk continuation | Reviews trend-pressure conditions where price keeps pressing near an outer band |
| Middle-band pullback | Reviews pullbacks near the Bollinger middle band when higher-timeframe direction agrees |
| Double-band zone continuation | Reviews directional zones between 1-standard-deviation and 2-standard-deviation bands |
| Rule Area | Educational Model Rule |
|---|---|
| Bollinger Bands | 20-period bands with 2 standard deviations |
| Double-band zone | 20-period bands with 1 and 2 standard deviations |
| BandWidth | Used to identify compression before squeeze-breakout review |
| Context chart | 1H range, trend, middle-band slope, and BandWidth context |
| Setup chart | 15M Bollinger Bands, BandWidth, structure, and candle confirmation |
| Session grouping | London morning, London/New York overlap, early New York afternoon, and a separately reported rollover/off-hours group |
| Entry | Next 15M open after the completed setup candle |
| Stop | Setup candle or structure extreme with a 0.25 ATR(14) buffer |
| Target comparison | Fixed 1.3R target from entry |
| Invalidation exit | Setup-specific invalidation based on band, middle-band, range-boundary, breakout, or setup-candle failure |
| Same-day exit | Forced close at the last available 15M close at or before 20:45 UTC |
| Cost Input | Assumptions Used |
|---|---|
| Spread | 0.5, 1.5, and 3.0 pips |
| Slippage | 0.1, 0.5, and 1.0 pips per side |
| Baseline comparison | 1.5-pip spread and 0.5-pip slippage per side |
| Swap and rollover | Not included because trades are forced flat before the same-day cutoff |
The review records setup candidates, accepted trades, rejected candidates, outer-band no-context warnings, rejection reasons, trade count, win rate, average win in R, average loss in R, expectancy in R, profit factor, maximum drawdown in R, worst losing streak, holding time, same-day cutoff exits, setup-type behavior, session-level behavior, pair-level behavior, direction-level behavior, exit reasons, and spread/slippage sensitivity.
Educational Bollinger Bands Setup-Type Test Results
The baseline run was negative: -0.3419R expectancy and -1,015.8704R total net result across 2,971 trades. The test used a 1.5-pip spread and 0.5-pip slippage per side. These figures are hypothetical historical results from one educational Bollinger Bands setup-type model, not proof of future live-trading performance.
| Metric | Baseline Result |
|---|---|
| Setup candidates | 11,066 |
| Trades before overlap filter | 4,960 |
| Accepted trades | 2,971 |
| Rejected candidates | 8,095 |
| Outer-band no-context warnings | 1,164 |
| Setup acceptance rate | 44.82% |
| Candidate rejection rate | 73.15% |
| Win rate | 33.56% |
| Average win | 0.8926R |
| Average loss | -0.9655R |
| Expectancy | -0.3419R |
| Profit factor | 0.4670 |
| Maximum drawdown | -1,019.8105R |
| Worst losing streak | 26 |
| Average holding period | 69.89 minutes |
| Same-day cutoff exit rate | 1.78% |
| Invalidation exit rate | 36.62% |
| Rejected Condition | Count |
|---|---|
| outside operating window or Friday cutoff | 5,311 |
| same pair setup type overlap | 1,989 |
| invalid trade after setup or risk gate | 795 |
Setup-Type Baseline Results
| Setup Type | Trades | Win Rate | Expectancy | Total Net Result | Max Drawdown | Worst Losing Streak |
|---|---|---|---|---|---|---|
| Squeeze breakout | 201 | 23.88% | -0.1802R | -36.2183R | -38.5680R | 20 |
| Outer-band range reaction | 444 | 40.77% | -0.3243R | -144.0091R | -145.1260R | 15 |
| Double-band zone continuation | 1,030 | 30.39% | -0.3430R | -353.2706R | -353.5754R | 19 |
| Middle-band pullback | 561 | 30.48% | -0.3610R | -202.4985R | -205.2584R | 17 |
| Band-walk continuation | 735 | 38.64% | -0.3808R | -279.8739R | -283.6235R | 21 |
Session-Level Baseline Results
| Session | Trades | Win Rate | Expectancy | Total Net Result | Invalidation Exit Rate |
|---|---|---|---|---|---|
| London morning | 1,252 | 36.58% | -0.2999R | -375.4785R | 33.87% |
| London/New York overlap | 1,189 | 33.39% | -0.3383R | -402.2637R | 37.26% |
| Rollover/off-hours | 34 | 23.53% | -0.3683R | -12.5218R | 52.94% |
| Early New York afternoon | 496 | 27.02% | -0.4549R | -225.6065R | 40.93% |
Pair-Level Baseline Results
| Pair | Trades | Win Rate | Expectancy | Total Net Result | Max Drawdown |
|---|---|---|---|---|---|
| USDCAD | 574 | 35.02% | -0.2111R | -121.1922R | -123.7783R |
| GBPUSD | 507 | 36.29% | -0.2948R | -149.4708R | -150.4015R |
| EURUSD | 442 | 34.39% | -0.3747R | -165.6091R | -167.9944R |
| USDJPY | 581 | 30.98% | -0.3820R | -221.9422R | -225.5593R |
| AUDUSD | 318 | 33.02% | -0.4044R | -128.5941R | -129.3568R |
| USDCHF | 549 | 31.88% | -0.4172R | -229.0619R | -235.3427R |
Selected Cost Sensitivity
| Cost Case | Trades | Weighted Win Rate | Weighted Expectancy | Total Net Result |
|---|---|---|---|---|
| 0.5 pip spread / 0.1 pip slippage per side | 2,971 | 35.38% | -0.1139R | -338.2691R |
| 1.5 pip spread / 0.5 pip slippage per side | 2,971 | 33.56% | -0.3419R | -1,015.8704R |
| 3.0 pip spread / 1.0 pip slippage per side | 2,971 | 32.18% | -0.6587R | -1,956.9833R |
Exit Reason Counts
| Exit Reason | Count |
|---|---|
| target 1.3R | 896 |
| stop loss | 892 |
| double band zone continuation invalidation exit | 544 |
| middle band pullback invalidation exit | 261 |
| squeeze breakout invalidation exit | 138 |
| band walk continuation invalidation exit | 101 |
| same day cutoff exit | 53 |
| outer band range reaction invalidation exit | 44 |
| time exit | 34 |
| stop first same bar | 8 |
What This Bollinger Bands Setup-Type Test Shows
All five setup types were negative under the baseline assumptions in this sample. The overall result was -0.3419R expectancy and -1,015.8704R total net result, with 2,971 accepted trades after the setup, session, risk, and overlap filters.
The least-negative baseline setup type was Squeeze breakout at -0.1802R expectancy and -36.2183R total net result. The weakest baseline setup type was Band-walk continuation at -0.3808R expectancy and -279.8739R total net result. This does not identify a universally best Bollinger Bands method; it shows how these simplified setup types behaved under one rule model.
The educational use of the test is to review cost sensitivity, rejection reasons, session timing, outer-band no-context warnings, squeeze failure, band-walk behavior, middle-band pullbacks, double-band zones, and invalidation exits before treating a band touch, squeeze, or band walk as a trade decision.
Use the result as a review prompt, not as a live-trading conclusion. Test one pair, one session window, one Bollinger Bands setup type, one band setting, one no-context warning rule, and one cost assumption before comparing Bollinger Bands routines.