
What Makes A Forex Indicator Combination Useful?
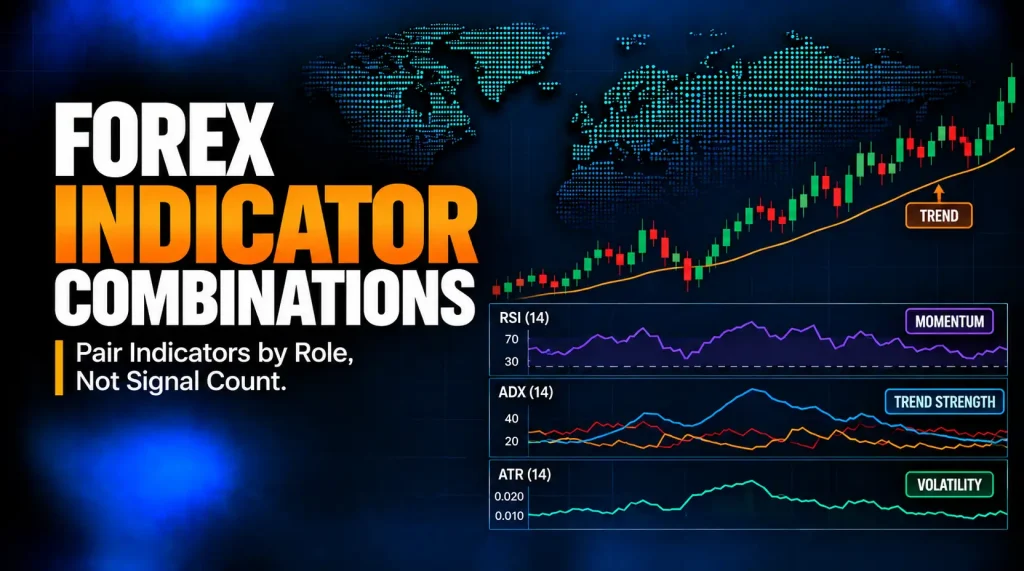
A forex indicator combination is useful only when each tool has a separate job. One indicator may define trend context, another may check momentum, another may review volatility, and another may support stop distance or exit logic. If every tool is answering the same question, the chart can look more certain without becoming more structured.
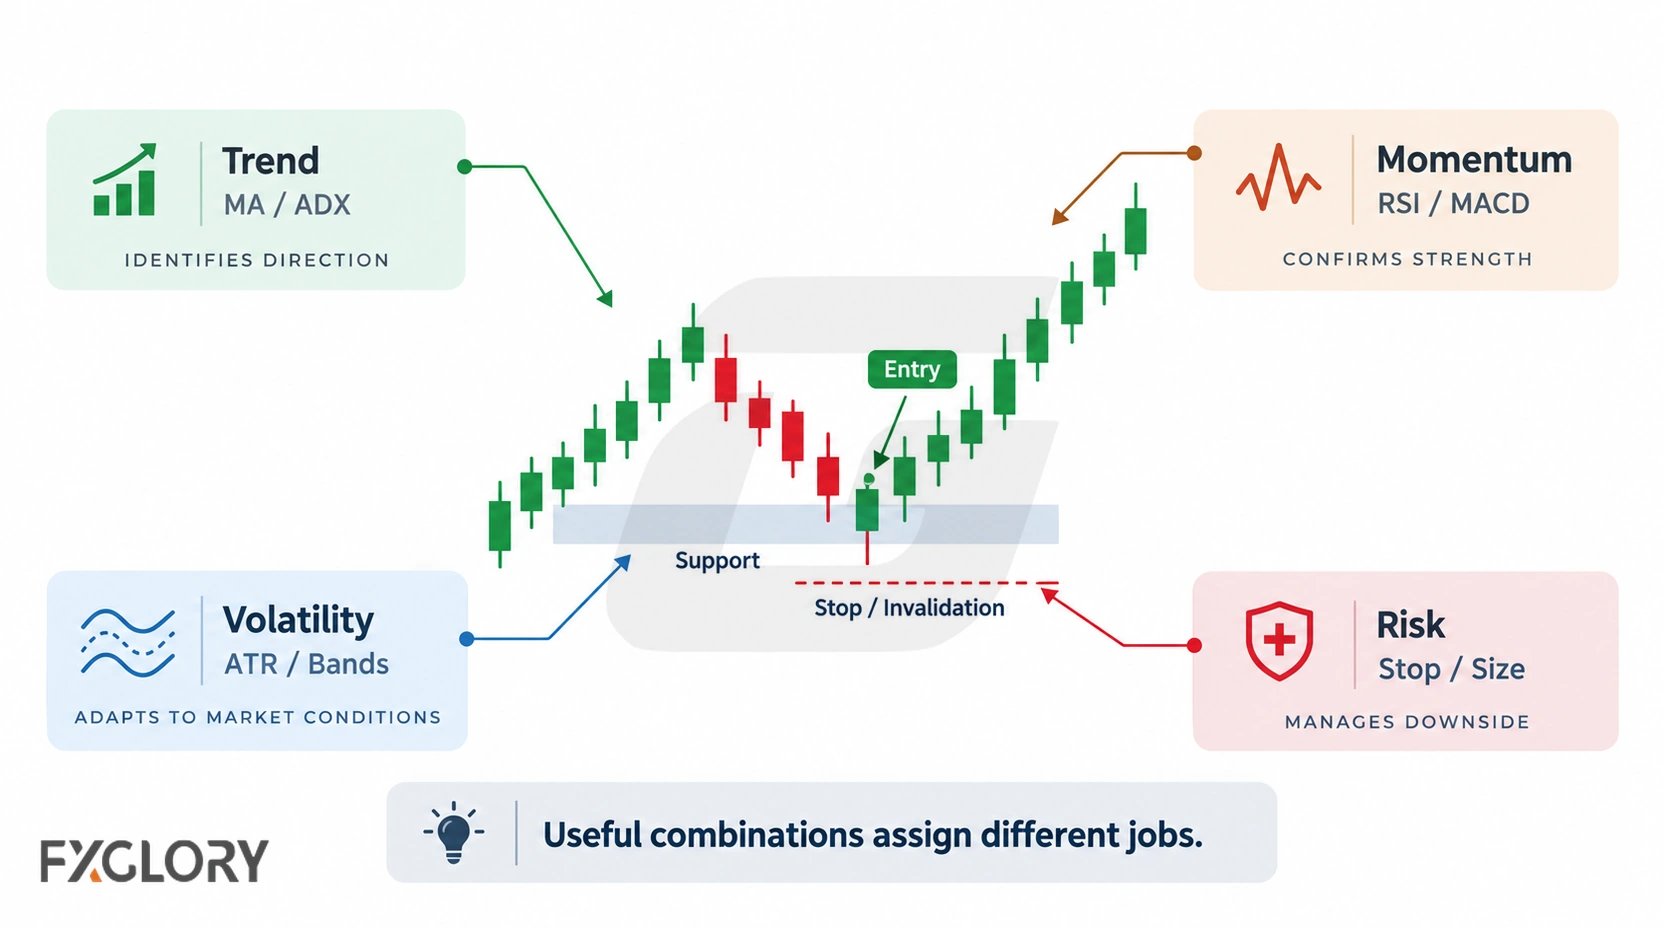
The goal is not to find the largest group of indicators. The goal is to build a smaller set of rules that can be repeated, reviewed, and rejected when market conditions do not fit.
This page starts after the indicator role is chosen; it focuses on whether two or more roles can work together without duplicating each other. For the broader framework, use forex indicator strategies. For indicator definitions and mechanics, use the guide to forex technical indicators.
Clean vs Cluttered Forex Indicator Combinations
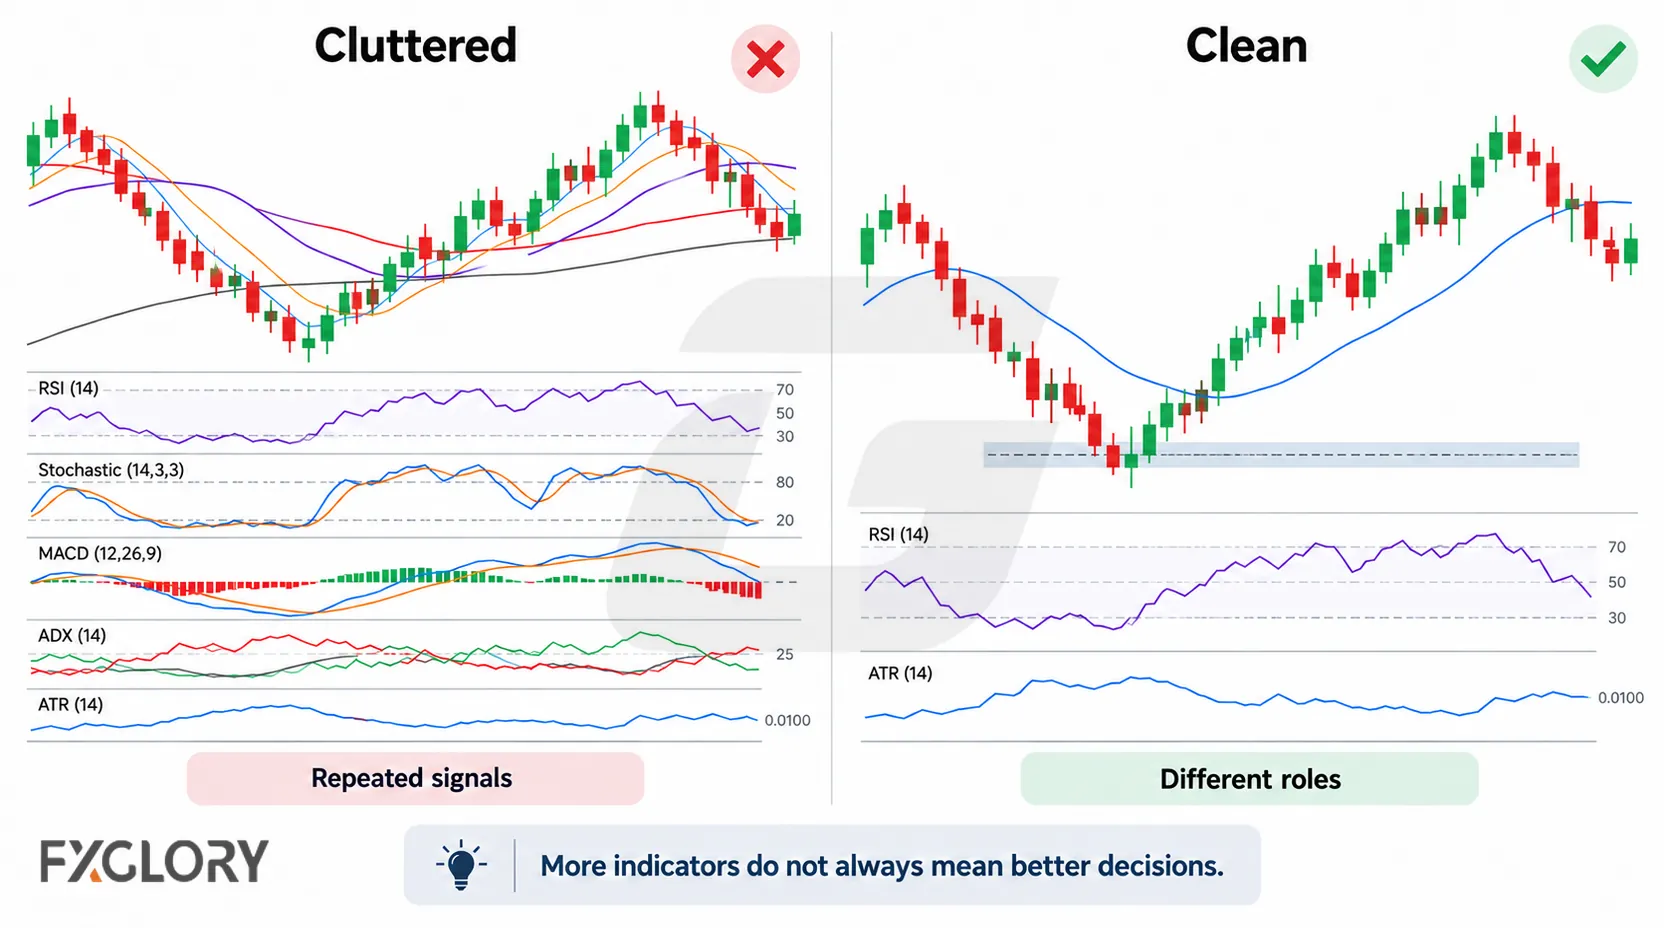
A cluttered combination often uses several indicators that measure similar information. A clean combination separates roles before checking signals.
| Combination Type | What Usually Happens | Better Rule |
|---|---|---|
| RSI + Stochastic + CCI | Several tools may repeat momentum or overbought/oversold information | Use one momentum tool unless each one has a separate rule |
| MACD + RSI + another oscillator | Momentum confirmation can become duplicated | Decide whether the strategy needs momentum, trend, or timing |
| Moving average + ADX + ATR | Each tool can have a separate role | Use moving average for direction, ADX for strength, ATR for risk or stop distance |
| Bollinger Bands + RSI | Volatility/location and momentum can be separated | Use bands for price location and RSI for momentum context |
| Support/resistance + one indicator | The chart level defines the trade area | Use the indicator only as confirmation or filter |
When an indicator signal needs a full trade structure, use the forex trading setups framework instead of adding more tools.
Choose Indicator Roles Before Indicator Names
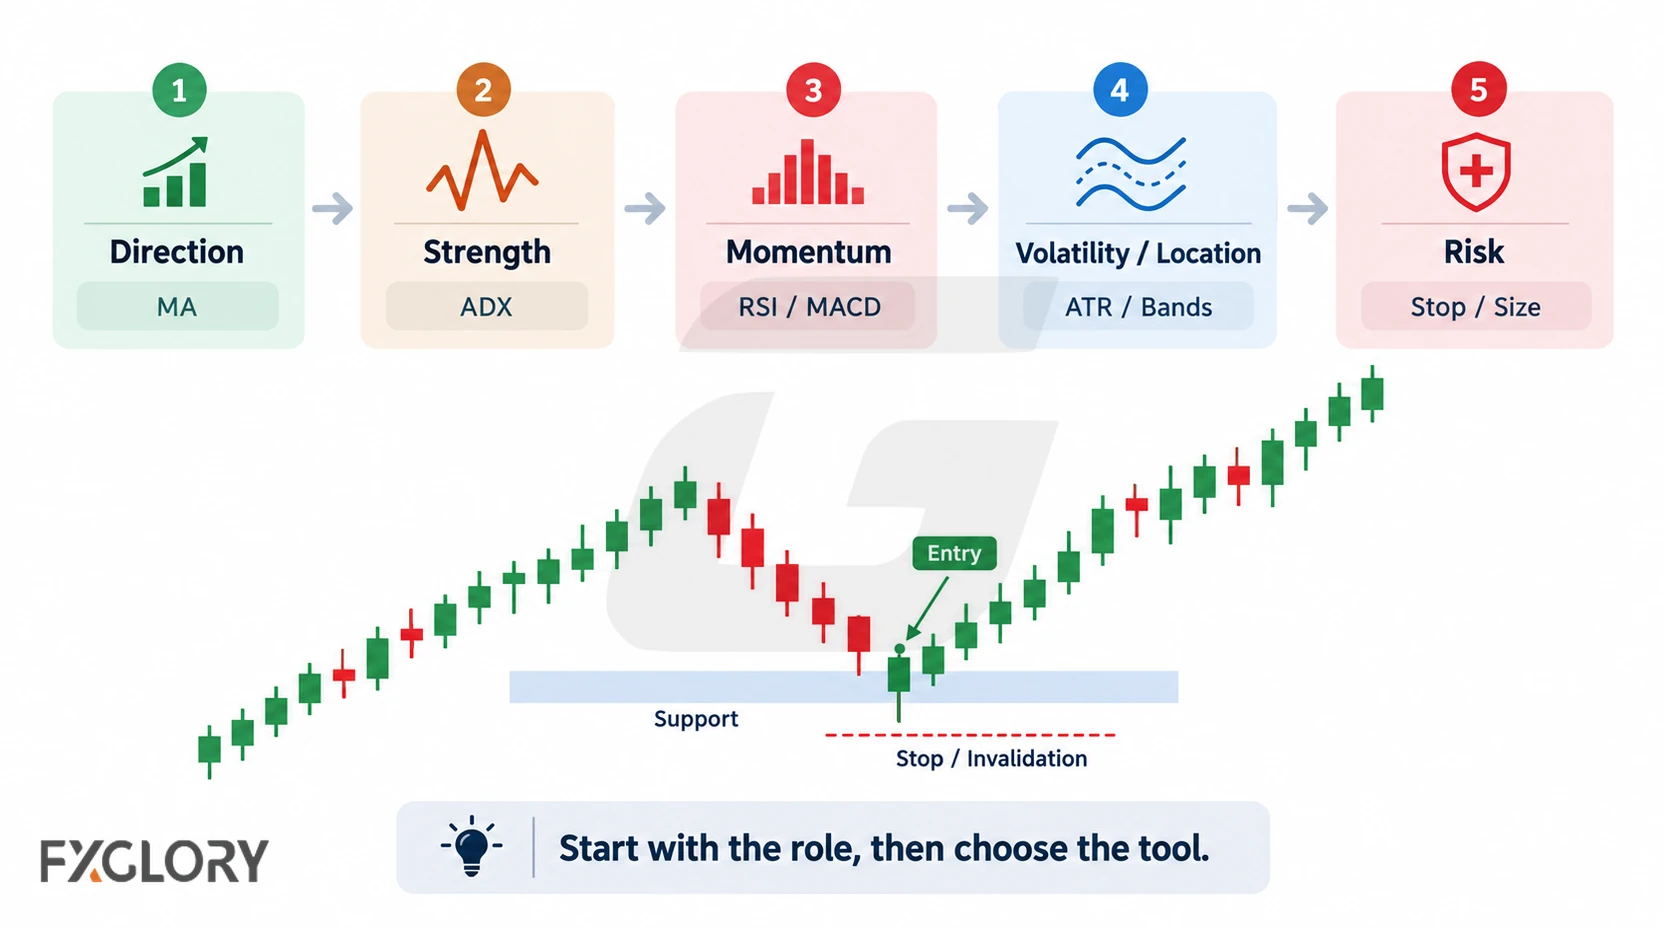
Cleaner forex indicator combinations start with roles. The indicator name comes after the question is clear.
| Role | Question It Answers | Common Tools | Common Mistake |
|---|---|---|---|
| Trend context | Is the market directional or unclear? | Moving averages, price structure, trendlines | Using trend tools in a range without a filter |
| Trend strength | Is the trend strong enough to study? | ADX | Using ADX as direction instead of strength |
| Momentum | Is movement gaining, fading, or recovering? | RSI, MACD, stochastic, CCI | Stacking several momentum tools |
| Volatility and location | Is price stretched, compressed, or moving inside a volatility range? | Bollinger Bands, ATR | Treating volatility as direction |
| Risk and stop distance | Does stop distance fit current movement? | ATR, price structure | Using a stop that ignores position size and margin |
| Exit or review | How will the trade be managed after entry? | ATR, moving averages, Parabolic SAR, structure | Changing exit rules after the trade is under pressure |
When trend context is part of the combination, review forex trend behavior. When the combination depends on a level, review support and resistance in forex.
Forex Indicator Combinations by Role
The examples below are combination frameworks, not complete standalone systems. A full Bollinger Bands and RSI strategy, ADX and RSI strategy, or ATR and ADX strategy would need narrower rules for market condition, trigger, invalidation, position size, exit, and review.
Do not use this page as a full RSI + Bollinger Bands, ADX + RSI, ATR + ADX, or ADX + Moving Average strategy; each of those would need its own entry, exit, stop, and testing rules. For dedicated combination rules, review Bollinger Bands and RSI Strategy, ADX and RSI Strategy, ATR and ADX Strategy, and ADX and Moving Average Strategy.
Trend Plus Momentum
This combination uses one tool to define direction and another tool to check whether momentum supports the idea. A moving average may provide direction context, while RSI or MACD reviews momentum behavior.
- Useful when: Price has a directional structure and the trader needs confirmation.
- Watch for: Late momentum signals after price has already moved.
- Skip if: Trend context and momentum conflict without a clear chart reason.
Trend Strength Plus Pullback
This combination uses ADX to review whether trend strength is worth attention, then uses price structure or a pullback rule to study entry. ADX should not decide direction by itself.
- Useful when: A trend exists but the trader wants to avoid weak conditions.
- Watch for: ADX confirmation that appears only after price is too far from invalidation.
- Skip if: DI lines are tangled and price is moving sideways.
Volatility Plus Momentum
This combination separates price location from momentum. Bollinger Bands may show that price is near an outer band or inside compression, while RSI can check whether momentum supports a reaction, continuation, or no-trade decision.
- Useful when: Price is near a band area, range boundary, or compression zone.
- Watch for: Band touches used as automatic reversals.
- Skip if: The market is walking the band strongly and momentum does not support the reversal idea.
Breakout Plus Volatility Plus Risk
This combination uses price structure for the breakout area, a volatility tool to review expansion, and ATR to check stop distance and target realism. ATR can support the risk side of the plan, but it does not predict breakout direction.
- Useful when: Price is compressing near support, resistance, or a range boundary.
- Watch for: Volatility expansion that appears after price is already far from a manageable stop.
- Skip if: Spread, stop distance, and margin exposure do not fit the trade plan.
Range Plus Momentum Plus Level Context
This combination starts with support and resistance, then uses one momentum tool to study whether price is reacting near the boundary. The level comes first; the oscillator only supports or rejects the idea.
- Useful when: Price is rotating inside a visible range.
- Watch for: Oscillator signals in the middle of the range where the level context is weak.
- Skip if: The range is breaking or the target is too small after spread.
Risk-First ATR Combination
Some combinations start with risk rather than signal confirmation. ATR may be used to check whether the planned stop, target, and position size fit current movement before the trader accepts the setup.
- Useful when: The setup exists, but current volatility changes the stop or target logic.
- Watch for: Wider stops that require smaller position size or margin review.
- Skip if: The combination looks valid but the loss scenario is unclear.
Practical Forex Indicator Pairings
The pairings below show how role separation can work. They should not be treated as automatic trading systems.
| Pairing | Role Split | How To Use It More Cleanly | Main Risk |
|---|---|---|---|
| Moving Average + RSI | Direction plus momentum | Use the moving average for context and RSI for momentum review. | RSI can stay extreme in a strong trend. |
| Bollinger Bands + RSI | Volatility/location plus momentum | Use bands to define price location and RSI to review momentum. | Every band touch is treated as a reversal. |
| ADX + RSI | Trend strength plus momentum | Use ADX to review strength and RSI to check momentum behavior. | ADX is mistaken for direction. |
| ADX + Moving Average | Strength plus direction context | Use the moving average for directional background and ADX for strength. | Moving average signals lag in fast conditions. |
| ATR + ADX | Risk/volatility plus trend strength | Use ADX to review trend strength and ATR to check stop distance. | Trend strength is accepted even when risk is too wide. |
| Bollinger Bands + ATR | Price location plus movement size | Use bands for volatility location and ATR for stop or target realism. | Volatility is mistaken for direction. |
| MACD + RSI | Momentum confirmation plus momentum context | Use only if each tool has a different rule, such as signal timing and momentum exhaustion. | Duplicate momentum signals create false confidence. |
| Fibonacci + Moving Average | Pullback zone plus direction context | Use Fibonacci only when price structure supports the retracement area. | The level is treated as exact instead of a zone. |
| Stochastic + Moving Average | Momentum turn plus trend context | Use the moving average for background and stochastic for pullback or range timing. | Stochastic signals are followed against a strong trend. |
| Support/Resistance + One Indicator | Chart level plus confirmation | Use the level as the trade area and the indicator as a filter. | The indicator is followed when the chart level has already failed. |
Other tools, such as Fibonacci retracements, pivot points, Ichimoku, Parabolic SAR, Aroon, OBV, Accumulation/Distribution, or volume-style indicators, can also be used in combinations when they have a defined role. In forex, volume-style tools should be tested carefully because available volume data may depend on the platform or feed.
For dedicated strategy rules, review RSI as a momentum tool, Bollinger Bands as volatility and price-location context, ADX as a trend-strength filter, and ATR as volatility and risk support.
How Many Forex Indicators Should You Combine?
A combination should stay small enough to review. Two indicators can be enough when the chart structure is clear. Three may be useful when each tool has a separate job. More than that can make the strategy harder to test because the trader may not know which rule made the decision.
| Number Of Indicators | Possible Use | Main Risk |
|---|---|---|
| One indicator plus price structure | Simple filter or confirmation | The indicator is asked to do too much. |
| Two indicators | Separate roles such as trend plus momentum | The tools may still duplicate each other. |
| Three indicators | Trend, momentum, and risk or volatility | Rules can become slow or conflicting. |
| Four or more indicators | Only useful if every tool has a clear job | Chart clutter, late decisions, and overfitting. |
Indicator Settings And Timeframe Alignment
Indicator combinations can fail when settings are changed after each result or when the indicators are reading different market conditions. A faster oscillator, slower moving average, and higher-timeframe volatility tool can all be useful, but only when the role of each timeframe is clear.
| Setting Or Timeframe Issue | What To Check | Skip If |
|---|---|---|
| Fast indicator with slow indicator | Does the fast tool provide timing while the slow tool provides context? | The fast tool keeps fighting the slow context. |
| Multiple oscillators | Does each oscillator answer a different question? | They repeat the same overbought or oversold message. |
| Lower-timeframe signal | Does the higher timeframe support the trade idea? | The lower timeframe only creates noise. |
| Changed settings | Were settings fixed before testing? | The settings are adjusted after each loss. |
| Short-term signals | Does the target still make sense after spread? | The planned target is too small after trading cost. |
When short-term indicator combinations depend on small targets or fast timing, review FXGlory spreads before testing the setup.
Worked Example: One Combination, Four Decisions
Assume a trader is reviewing a currency pair near resistance. Price is testing the level, ADX is rising, RSI is high, and ATR has expanded. That still does not create an automatic trade.
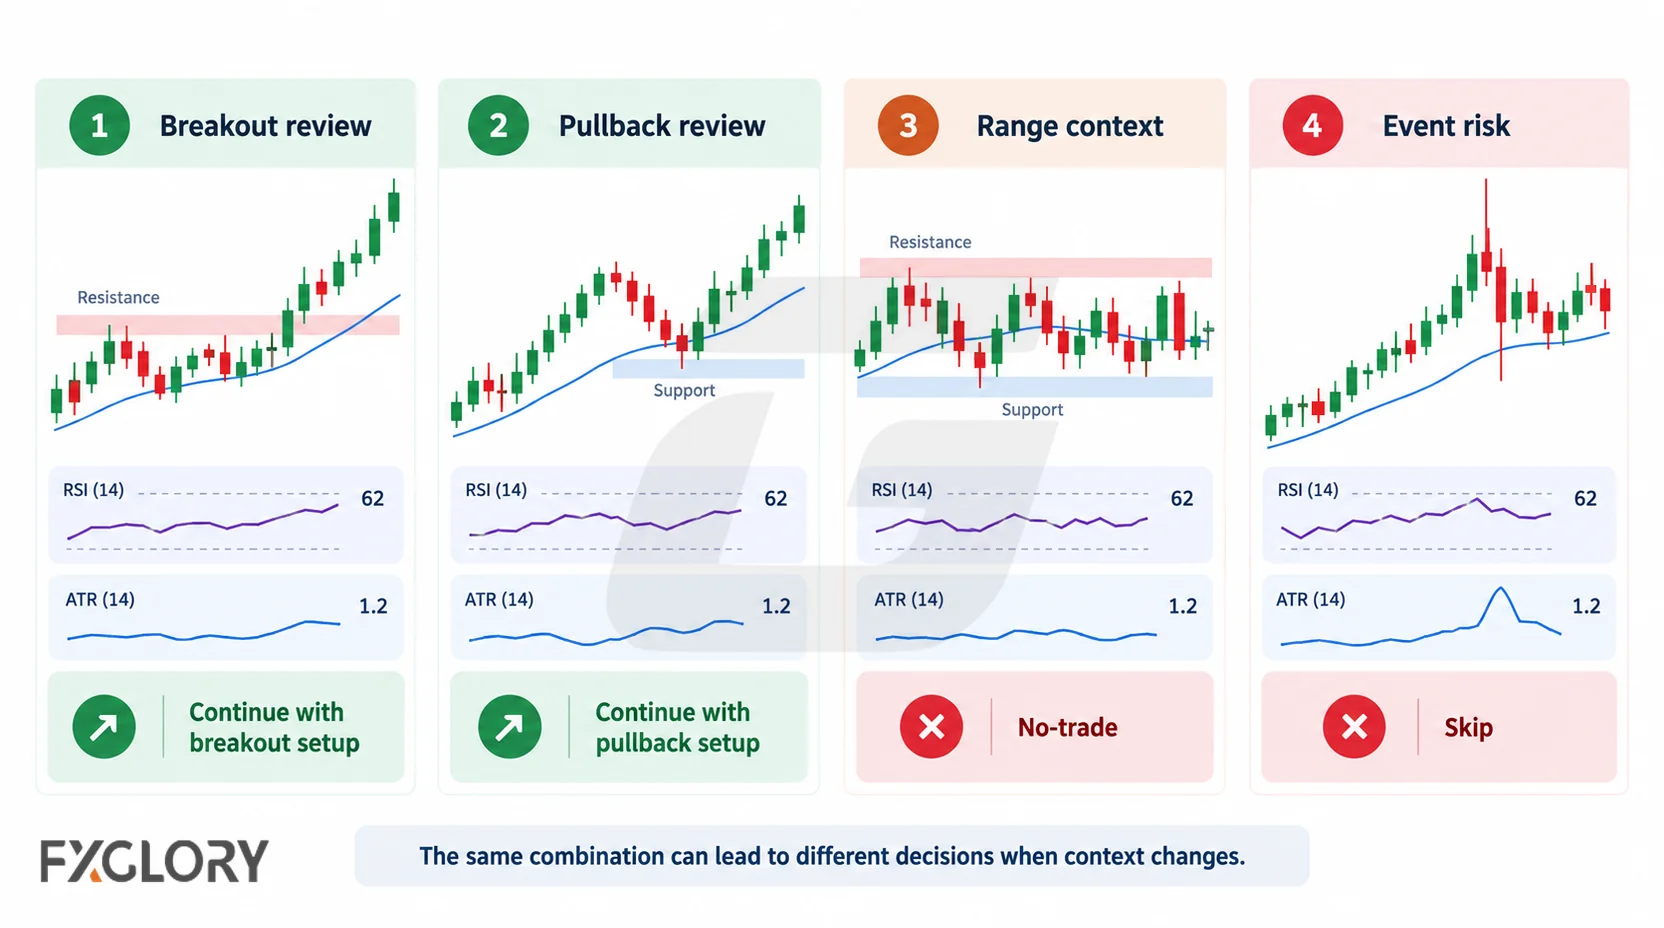
| Observation | Possible Meaning | Next Check | Skip If |
|---|---|---|---|
| Price is below resistance and ADX is rising | Trend strength may be developing near a breakout area | Check whether price breaks and holds above the level | The breakout is only a spike. |
| RSI is high while price reaches resistance | Momentum may be strong or stretched | Check whether the strategy is breakout or reversal-based | RSI is used without price confirmation. |
| ATR expands during the move | Stop distance and target may need review | Check position size and margin exposure | The required stop is too wide for the plan. |
| Signals conflict across timeframes | The combination may be unclear | Return to the higher-timeframe context | The lower timeframe is used to force an entry. |
When Forex Indicator Combinations Fail
Indicator combinations often fail when they make the chart look organized while the trade rules remain unclear. The most common problem is not the indicator list; it is the missing decision process.
- Duplicate signals: Several indicators measure the same momentum or overbought/oversold condition.
- No price structure: Indicators are followed without support, resistance, trend, or range context.
- Late confirmation: The combination agrees only after price has already moved away from invalidation.
- Conflicting timeframes: A lower-timeframe signal fights the broader chart condition.
- No invalidation: The trader knows the signal but not where the idea is wrong.
- Settings changed too often: Indicator settings are adjusted after each result, making the test unreliable.
- Spread problem: Short-term combinations create targets too small for the trading cost.
- Risk ignored: The combination looks clean, but stop distance, position size, or margin exposure does not fit.
- Event risk: News volatility changes the market before the indicator combination can be managed.
When position size, stop distance, and margin need to be checked together, use the FXGlory margin calculator.
Testing Forex Indicator Combinations
A forex indicator combination should be tested as a full rule set, not as a group of agreeing signals. Testing should include clean examples, conflicting examples, skipped trades, false breakouts, late signals, choppy ranges, strong trends, volatile periods, and different currency pairs.
- What market condition does the combination need?
- What role does each indicator play?
- Which indicator defines context, and which one triggers attention?
- What price structure confirms the setup?
- Where is the idea invalid?
- Does the target still make sense after spread?
- Does stop distance fit position size and margin exposure?
- Are indicator settings kept consistent during the test?
- Are duplicate signals, conflicting signals, and skipped setups recorded?
- Does the result change across selected currency pairs or timeframes?
Review available currency pairs before applying one indicator combination everywhere. Review FXGlory trading platforms when the combination depends on charting tools, indicator settings, alerts, order placement, or trade-management workflow.
Forex Indicator Combination Checklist
Before using a forex indicator combination, answer these questions.
- Is the market trending, ranging, compressing, expanding, or unclear?
- What role does each indicator play?
- Are any indicators repeating the same signal?
- Does price structure support the combination?
- Does the higher timeframe support or conflict with the setup?
- Where is the trade idea invalid?
- Are the indicator settings fixed for the test?
- Does the setup still make sense after spread?
- Does stop distance fit position size and margin?
- What closes, trails, or reviews the trade?
- What condition makes the combination a no-trade?
The best forex indicator combination is the one a trader can explain, test, reject, and review. Each indicator should have a job; the chart should define the trade area; and risk should be clear before entry.
Role-Based Combination Test Notes For Forex Indicator Combinations
This hypothetical educational role-based combination test compared six common forex indicator combinations: Moving Average + RSI, Bollinger Bands + RSI, ADX + RSI, ADX + Moving Average, ATR + ADX, and Bollinger Bands + ATR. Each combination is tested with the same 15M price-trigger, stop, target, session, cost, and exit framework. The test does not prove that one combination is universally best.
The model reviewed EURUSD, GBPUSD, USDJPY, AUDUSD, USDCAD, and USDCHF using public yfinance 15-minute OHLC data where available. The 1H candles are resampled from the same 15-minute data so that trend-context rules and trigger rules have fixed roles.
| Combination | Role Split In The Educational Model |
|---|---|
| Moving Average + RSI | Moving averages define 1H trend context; RSI reviews 15M momentum confirmation |
| Bollinger Bands + RSI | Bollinger Bands define 15M price-location context; RSI reviews 15M momentum confirmation |
| ADX + RSI | ADX reviews 15M trend strength; RSI reviews 15M momentum confirmation |
| ADX + Moving Average | ADX reviews 15M trend strength; moving averages define 1H direction context |
| ATR + ADX | ATR reviews 15M volatility expansion; ADX reviews 15M trend strength |
| Bollinger Bands + ATR | Bollinger Bands review volatility location; ATR reviews volatility expansion |
| Rule Area | Educational Model Rule |
|---|---|
| Base trigger | 15M break of the previous 12-candle range by at least 0.05 ATR(14) |
| Range filter | Range width between 0.75 and 4.00 ATR(14) |
| Entry | Next 15M open after the completed signal candle |
| Session grouping | London morning, London/New York overlap, early New York afternoon, and a separately reported rollover/off-hours group |
| Stop | Opposite side of the 12-candle range with a 0.25 ATR(14) buffer |
| Target comparison | Fixed 1.3R target from entry |
| Invalidation exit | Close back inside the broken 12-candle trigger range |
| Same-day exit | Forced close at the last available 15M close at or before 20:45 UTC |
| Cost Input | Assumptions Used |
|---|---|
| Spread | 0.5, 1.5, and 3.0 pips |
| Slippage | 0.1, 0.5, and 1.0 pips per side |
| Baseline comparison | 1.5-pip spread and 0.5-pip slippage per side |
| Swap and rollover | Not included because trades are forced flat before the same-day cutoff |
The review records price-trigger candidates, combination-pass counts, accepted trades, rejected candidates, rejection reasons, trade count, win rate, average win in R, average loss in R, expectancy in R, profit factor, maximum drawdown in R, worst losing streak, holding time, same-day cutoff exits, combination-level behavior, role-level behavior, session-level behavior, pair-level behavior, direction-level behavior, exit reasons, and spread/slippage sensitivity.
Educational Role-Based Combination Test Results
The baseline run was negative: -0.1485R expectancy and -330.9485R total net result across 2,228 trades. The test used a 1.5-pip spread and 0.5-pip slippage per side. These figures are hypothetical historical results from one educational role-based indicator-combination model, not proof of future live-trading performance.
| Metric | Baseline Result |
|---|---|
| Price-trigger candidates | 15,930 |
| Combination passes before overlap filter | 3,050 |
| Accepted trades | 2,228 |
| Rejected candidates | 13,702 |
| Combination pass rate | 19.15% |
| Candidate rejection rate | 86.01% |
| Win rate | 22.53% |
| Average win | 0.7259R |
| Average loss | -0.4029R |
| Expectancy | -0.1485R |
| Profit factor | 0.5240 |
| Maximum drawdown | -331.9799R |
| Worst losing streak | 95 |
| Average holding period | 118.40 minutes |
| Same-day cutoff exit rate | 9.47% |
| Invalidation exit rate | 70.47% |
| Rejected Condition | Count |
|---|---|
| outside operating window or Friday cutoff | 8,106 |
| combination rules not met | 4,774 |
| same pair combination overlap | 822 |
Combination-Level Baseline Results
| Combination | Trades | Win Rate | Expectancy | Total Net Result | Max Drawdown | Worst Losing Streak |
|---|---|---|---|---|---|---|
| ATR + ADX | 263 | 26.62% | -0.0904R | -23.7628R | -23.7745R | 22 |
| ADX + RSI | 297 | 26.26% | -0.1023R | -30.3908R | -30.5679R | 25 |
| Bollinger Bands + ATR | 360 | 25.56% | -0.1254R | -45.1553R | -44.8161R | 31 |
| ADX + Moving Average | 173 | 21.39% | -0.1477R | -25.5483R | -26.0530R | 29 |
| Bollinger Bands + RSI | 682 | 20.38% | -0.1712R | -116.7451R | -118.8615R | 32 |
| Moving Average + RSI | 453 | 18.98% | -0.1972R | -89.3462R | -92.1513R | 49 |
Role-Group Baseline Results
| Role Group | Trades | Win Rate | Expectancy | Total Net Result | Max Drawdown |
|---|---|---|---|---|---|
| Volatility plus trend strength | 263 | 26.62% | -0.0904R | -23.7628R | -23.7745R |
| Trend strength plus momentum | 297 | 26.26% | -0.1023R | -30.3908R | -30.5679R |
| Volatility location plus volatility expansion | 360 | 25.56% | -0.1254R | -45.1553R | -44.8161R |
| Trend strength plus direction | 173 | 21.39% | -0.1477R | -25.5483R | -26.0530R |
| Volatility location plus momentum | 682 | 20.38% | -0.1712R | -116.7451R | -118.8615R |
| Trend plus momentum | 453 | 18.98% | -0.1972R | -89.3462R | -92.1513R |
Entry-Session Baseline Results
| Entry Session | Trades | Win Rate | Expectancy | Total Net Result | Same-Day Cutoff Exit Rate |
|---|---|---|---|---|---|
| Early New York afternoon | 352 | 32.95% | -0.0175R | -6.1639R | 36.36% |
| London/New York overlap | 911 | 21.08% | -0.1860R | -169.4065R | 8.34% |
| London morning | 932 | 20.71% | -0.1505R | -140.2559R | 0.21% |
| Rollover/off-hours | 33 | 3.03% | -0.4582R | -15.1222R | 15.15% |
Pair-Level Baseline Results
| Pair | Trades | Win Rate | Expectancy | Total Net Result |
|---|---|---|---|---|
| EURUSD | 352 | 34.66% | -0.0276R | -9.7024R |
| USDCAD | 403 | 24.81% | -0.0811R | -32.6699R |
| GBPUSD | 373 | 23.86% | -0.1068R | -39.8472R |
| USDCHF | 449 | 16.93% | -0.2031R | -91.1877R |
| AUDUSD | 324 | 22.22% | -0.2143R | -69.4488R |
| USDJPY | 327 | 13.15% | -0.2694R | -88.0924R |
Selected Spread And Slippage Sensitivity
| Spread | Slippage | Trades | Weighted Win Rate | Weighted Expectancy | Total Net Result |
|---|---|---|---|---|---|
| 0.5 pips | 0.1 pips per side | 2,228 | 23.52% | -0.0622R | -138.5543R |
| 1.5 pips | 0.5 pips per side | 2,228 | 22.53% | -0.1485R | -330.9485R |
| 3.0 pips | 1.0 pips per side | 2,228 | 19.75% | -0.2685R | -598.1626R |
| Exit Reason | Count |
|---|---|
| invalidation close back inside trigger range | 1,570 |
| same day cutoff exit | 211 |
| stop loss | 42 |
| target 1.3R | 213 |
| time exit | 192 |
What This Role-Based Combination Test Shows
All six indicator combinations were negative under the baseline assumptions in this sample. The overall result was -0.1485R expectancy and -330.9485R total net result, with 2,228 accepted trades after the price-trigger, indicator-combination, session, risk, and overlap filters.
The least-negative baseline combination was ATR + ADX at -0.0904R expectancy. The weakest baseline combination was Moving Average + RSI at -0.1972R expectancy. This does not identify a universally best indicator combination; it shows how different role pairings behaved under the same simplified rule model.
The educational use of the test is to review role separation, rejection reasons, cost sensitivity, session timing, and exit behavior before treating any group of agreeing indicators as a trade decision.
Use the result as a review prompt, not as a live-trading conclusion. Test one pair, one session window, one indicator combination, one trigger rule, and one cost assumption before comparing role-based indicator routines.