
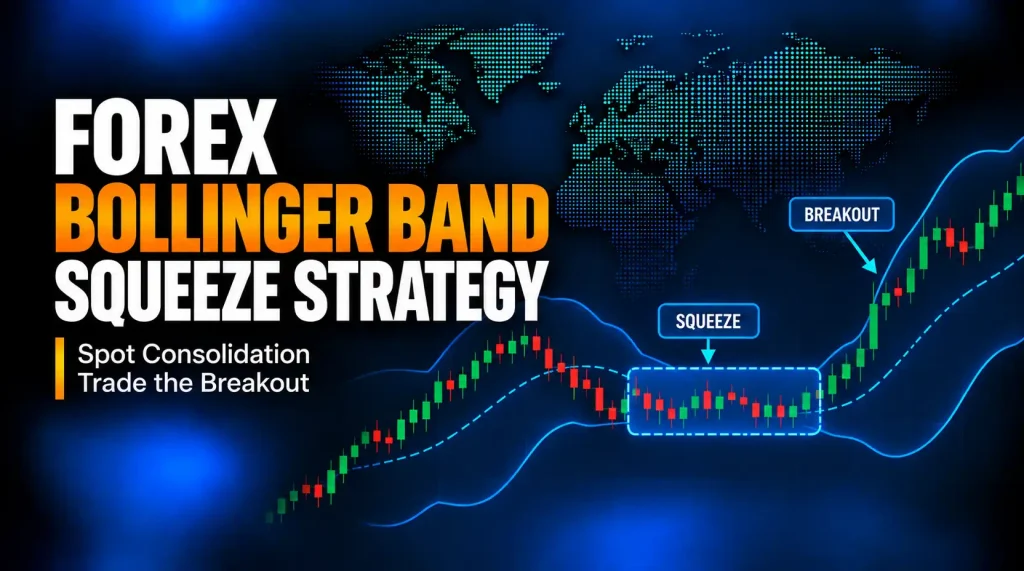
What Is A Bollinger Band Squeeze Strategy?
A Bollinger Band squeeze strategy reviews periods where the upper and lower Bollinger Bands narrow around price. With the common Bollinger calculation, narrower bands reflect less dispersion in the selected price series over the indicator lookback. That historical observation does not identify the direction of a later move.
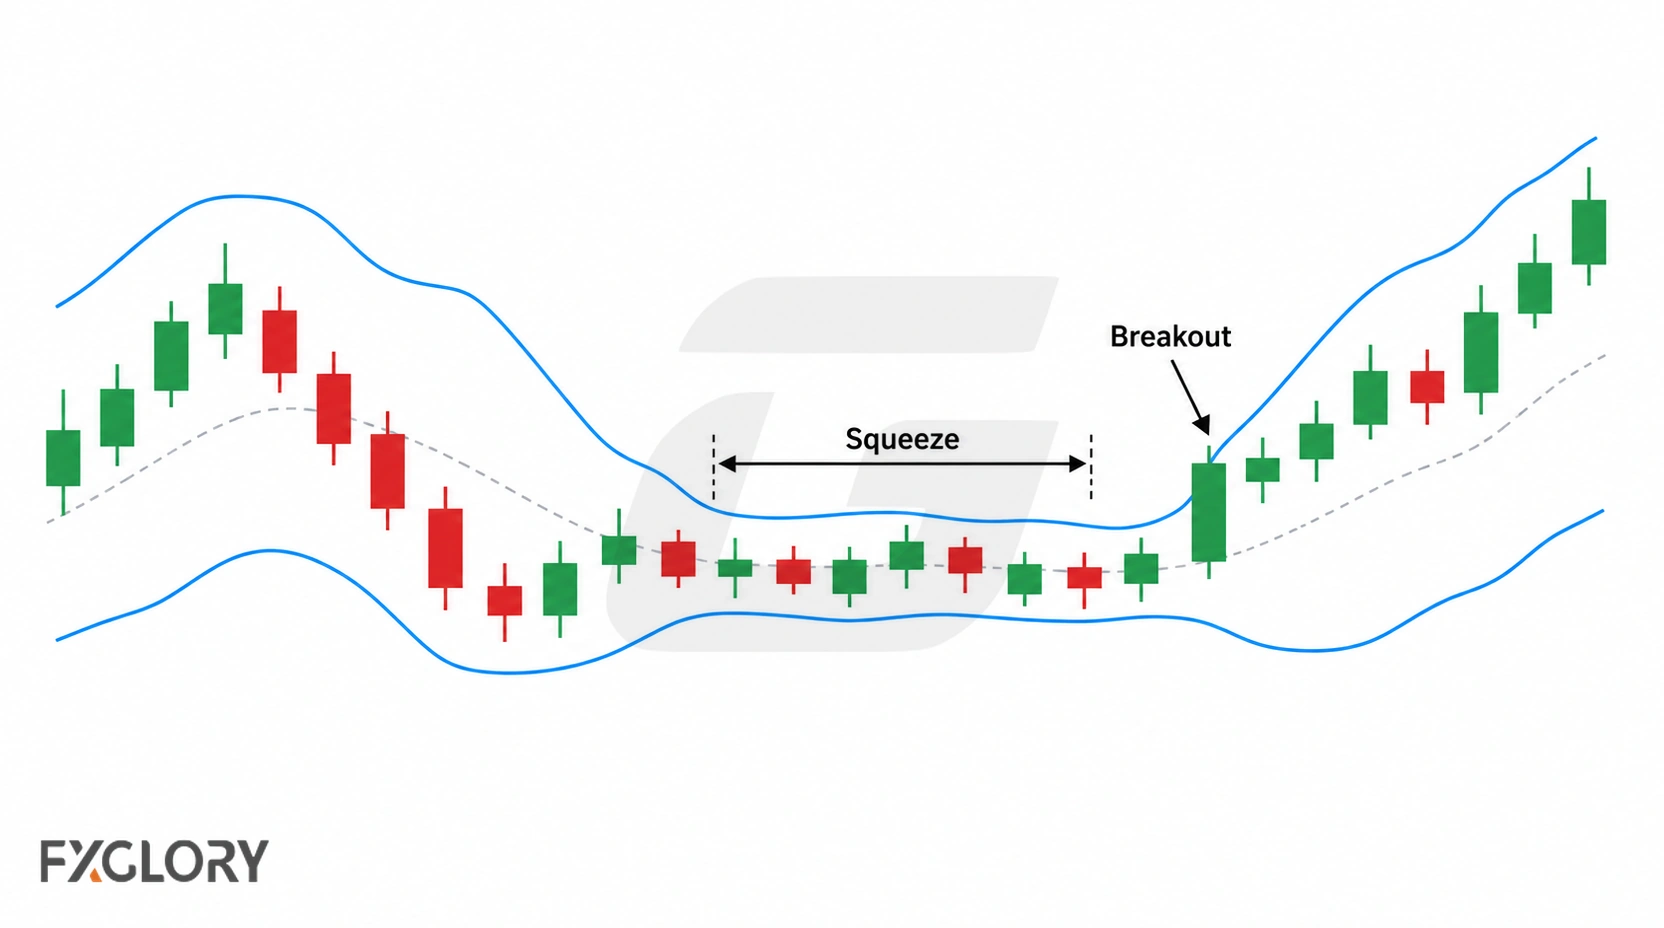
To turn this observation into a testable setup, mark an identifiable price boundary and state exactly what would qualify as a break. Assess the proposed trade separately from identifying the squeeze.
This page is not a general Bollinger Bands guide. It focuses only on squeeze conditions, breakout confirmation, failed-breakout rules, and risk checks after volatility compression. For the broader indicator framework, review forex indicator strategies. For the broader Bollinger framework, review Bollinger Bands as volatility and price-location context. For indicator mechanics, use the dedicated Bollinger Bands Forex guide.
Bollinger Band Squeeze Signal vs Full Strategy
A narrow-band reading is a condition to monitor, not a completed entry signal. The table separates what the bands show from the additional observations a strategy would require.
| Reading | What It May Suggest | What Still Needs To Be Checked | Main Risk |
|---|---|---|---|
| Bands narrow around price | Volatility has contracted | Range, support, resistance, and breakout level | Direction is guessed too early |
| Price breaks the upper band | Upside expansion may be starting | Close, retest, momentum, spread, and invalidation | The breakout may be a spike |
| Price breaks the lower band | Downside expansion may be starting | Close, retest, momentum, spread, and invalidation | The breakout may return inside the range |
| BandWidth reaches a low area | Compression may be stronger than recent conditions | Price structure and breakout confirmation | Compression can last longer than expected |
| Price returns after a break attempt | Either an unconfirmed attempt or failure of a previously confirmed break | Whether the defined trigger occurred, and whether a later failure condition was met | A wick-only attempt is mislabeled a failed confirmed breakout |
An intrabar wick beyond a band or level is not equivalent to a completed-candle close beyond a predefined range boundary. Choose a close-based condition, a subsequent retest condition, or another observable trigger before evaluating past examples. For additional context, review forex breakout confirmation and retest rules.
When a squeeze condition needs to become a complete trade plan, use the forex trading setups framework instead of adding more signals.
How To Identify A Bollinger Band Squeeze
Look for a narrowing distance between the upper and lower bands. Candles may also become smaller or remain inside a tight range, but candle-range contraction is not a required condition in every BandWidth-based squeeze definition. A marked support, resistance, or rectangle boundary makes subsequent price action easier to evaluate.
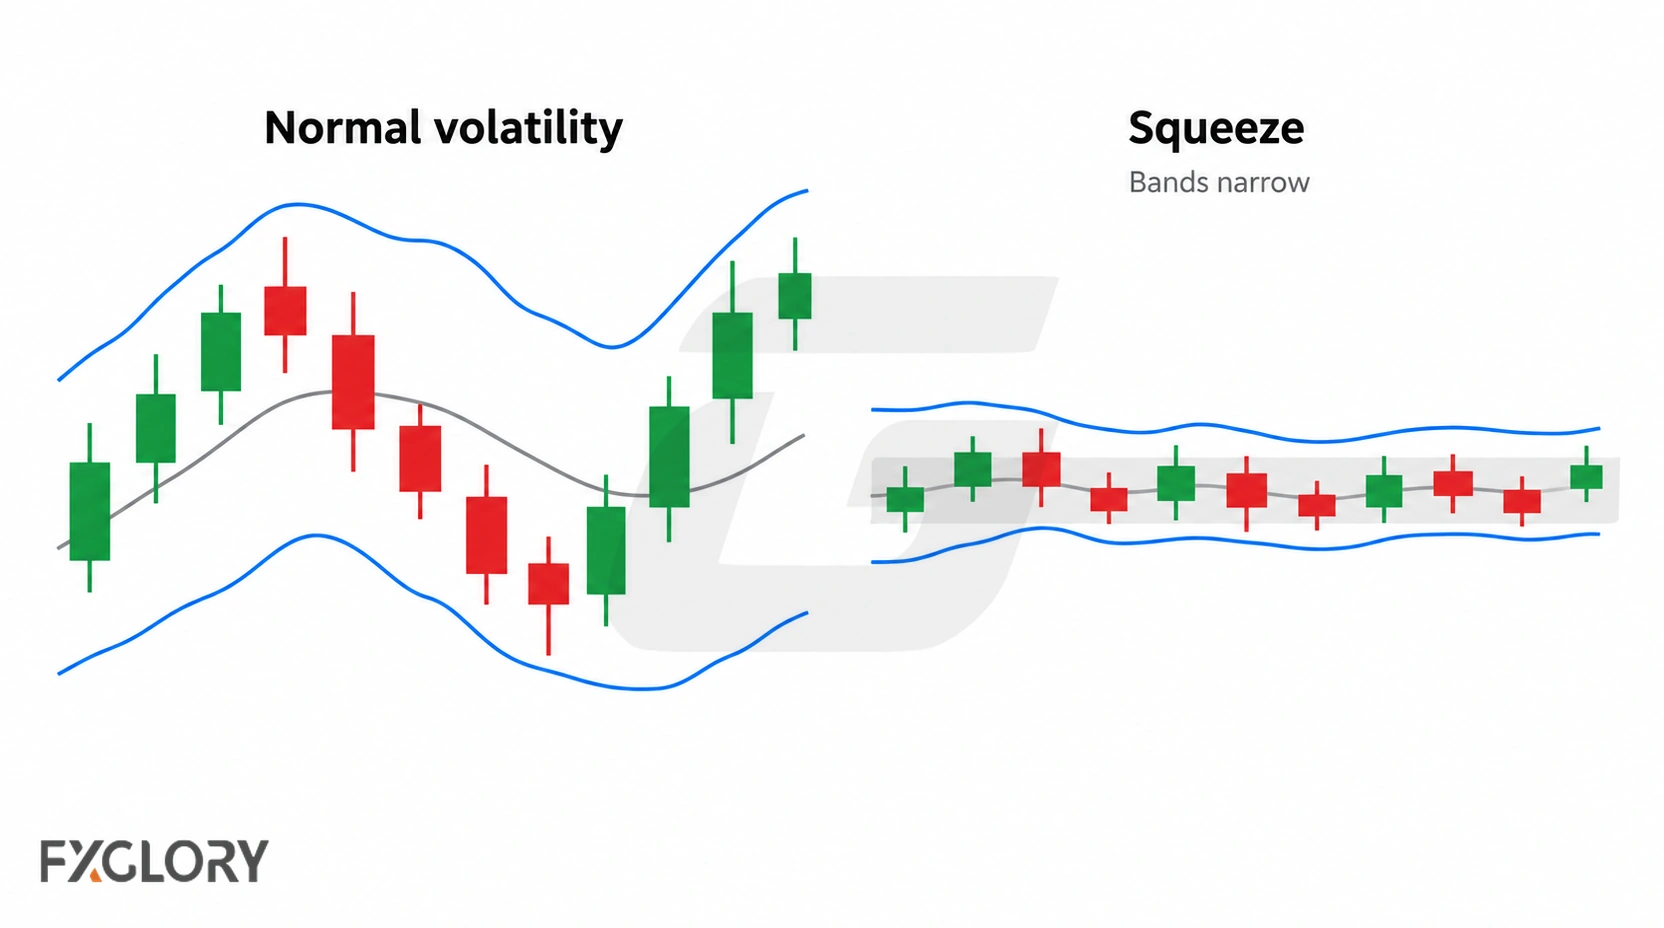
BandWidth is commonly calculated as (upper band − lower band) ÷ middle band, sometimes multiplied by 100 for display. Comparing it with its own earlier readings over a fixed lookback can identify unusual compression; a multi-month low is one possible rule rather than a universal requirement. %B instead describes where price sits relative to those bands.
| Compression Clue | How It Helps | What To Avoid |
|---|---|---|
| Narrowing bands | Shows volatility contraction | Treating narrow bands as direction |
| Low BandWidth | Measures normalized band width; a fixed historical comparison identifies unusually low readings | Treating one absolute value as a universal threshold |
| Price boxed inside a range | Gives a clearer breakout area | Entering before price leaves the structure |
| Quiet candles near a level | Shows reduced movement before a possible expansion | Assuming quiet price must break immediately |
| %B near band extremes after compression | Can show price pushing toward one side of the bands | Using %B alone as a trade trigger |
When a squeeze depends on a range or breakout level, review support and resistance in forex.
Bollinger Band Squeeze Decision Chain
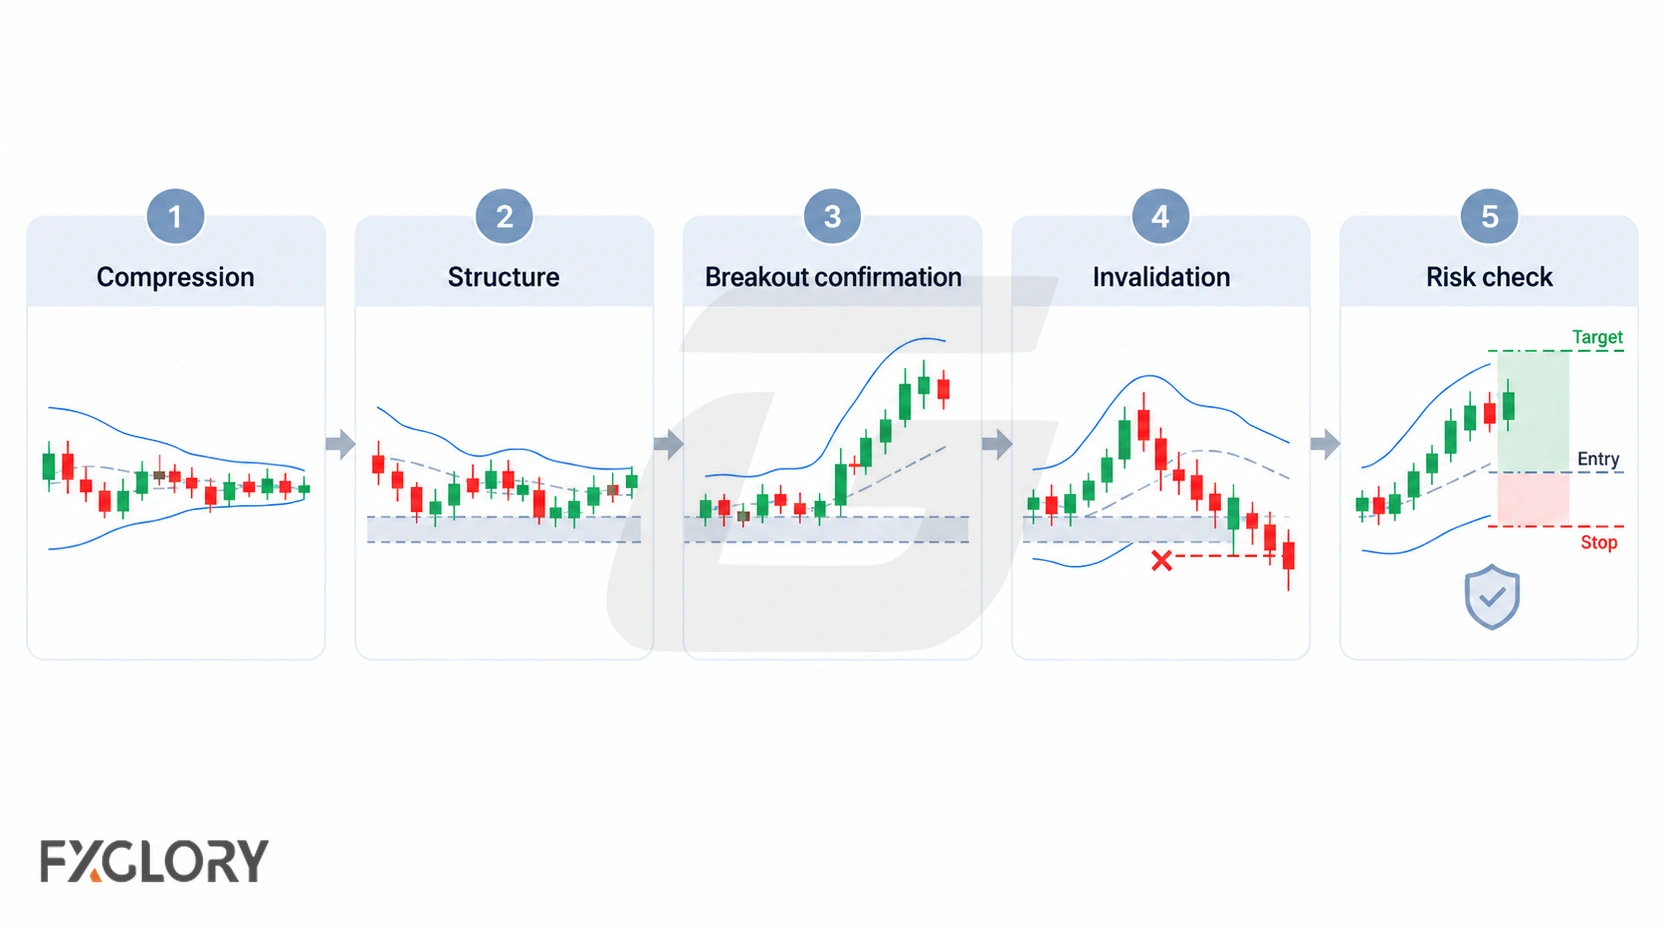
A squeeze strategy should move in order. Compression comes first. Structure comes second. Breakout confirmation comes after that. Risk checks come before the trade is accepted.
| Step | Question | Tool Or Context | Decision |
|---|---|---|---|
| 1 | Has volatility contracted? | Bollinger Bands, BandWidth, candle size | Mark the squeeze condition |
| 2 | Where is price compressed? | Range, support, resistance, rectangle, trend context | Define breakout area |
| 3 | Did price break with confirmation? | Close, retest, structure shift, %B, momentum tool | Review direction after price acts |
| 4 | Where is the breakout wrong? | Failed-breakout rule and price structure | Define invalidation |
| 5 | Can the trade be managed? | Spread, stop distance, ATR, position size, margin | Accept, reduce, delay, or skip |
Bollinger Squeeze Scenarios and Variations
These examples cover three price-breakout scenarios, a possible failed-breakout outcome, measurement tools, and a separate BB/KC methodology. They are not six interchangeable trading systems or evidence that any one approach is profitable.
A TTM-style squeeze and lower-timeframe squeeze scalping require their own indicator and execution rules; they should not inherit performance assumptions from a standard Bollinger-only setup.
Upper-Band Breakout From A Squeeze
An upper-band breakout starts when price leaves a compressed area toward the upper band or above it. The band break should be reviewed with price structure, not treated as an automatic buy.
- Context: Bands narrow near a range, resistance, or compression area.
- Bollinger role: Shows compression and upside expansion attempt.
- Trigger: For a close-based rule, a completed candle closes above the premarked resistance boundary. For a retest-based rule, first require the break, then specify the price action on a return to that boundary that qualifies as entry.
- Structural failure: A later completed candle closes back inside the original range, if that was the preselected failure rule. A live trade's stop-execution rule is a separate decision.
- Skip rule: Skip if price is already far from invalidation or the breakout is only a spike.
Lower-Band Breakout From A Squeeze
A lower-band breakout starts when price leaves compression toward the lower band or below it. The setup still needs structure, confirmation, and a clear failed-breakout rule.
- Context: Bands narrow near support, a range floor, or a compressed structure.
- Bollinger role: Shows compression and downside expansion attempt.
- Trigger: For a close-based rule, a completed candle closes below the premarked support boundary. For a retest-based rule, first require the break, then specify the price action on a return to that boundary that qualifies as entry.
- Structural failure: A later completed candle closes back above the broken support boundary, if that was the preselected failure rule. Stop placement is considered separately.
- Skip rule: Skip if the target is too small after spread or the stop distance is unclear.
Range Or Rectangle Squeeze Breakout
A squeeze inside a range or rectangle can give the setup a cleaner structure because the breakout area is visible. The range boundary matters more than the band touch alone.
- Context: Price compresses between visible support and resistance.
- Bollinger role: Shows reduced volatility inside the range.
- Trigger: A completed candle closes outside the premarked range boundary under a close-based rule; a retest, if required, is an additional condition.
- Structural failure: Following a confirmed break, a later completed candle closes back inside the rectangle or range under the defined rule.
- Skip rule: Skip if the breakout happens during unclear event volatility or without manageable risk.
Failed Breakout Or Head Fake
A head fake is an apparent breakout that quickly reverses into the preceding range or moves the other way. If the initial excursion never satisfies the chosen confirmation rule, it remains an unconfirmed attempt—not a failed confirmed breakout.
- Context: Price breaks from compression but cannot hold outside the structure.
- Bollinger role: Shows the breakout attempt and return inside the band area.
- Trigger: No new trade is accepted unless the failed-breakout plan is written separately.
- Structural failure: If a previously confirmed break meets the predefined return-inside condition, classify it as a failed confirmed breakout; separately apply the trade's stop or exit rule if an order was filled.
- Skip rule: Skip if the trader is only hoping the first breakout will resume.
BandWidth And %B Confirmation
BandWidth can help identify compression, while %B can help review where price sits relative to the bands. These tools should support the squeeze workflow, not replace support, resistance, or breakout confirmation.
- Context: The trader wants a more measurable compression review.
- BandWidth role: Measures the normalized distance between bands; compare earlier readings using a fixed lookback to rank compression.
- %B role: Reviews price position inside or outside the bands.
- Comparison: Record the historical BandWidth comparison and %B reading separately from the completed-candle breakout result.
- Skip rule: Skip if BandWidth or %B is used without a breakout level.
BB/KC Or TTM Squeeze Variation
Some traders compare Bollinger Bands with Keltner Channels or use TTM-style squeeze tools. These variations can help review compression and momentum, but they should be tested separately from a standard Bollinger Band squeeze rule.
- Context: The trader uses a platform tool that combines Bollinger Bands, Keltner Channels, or momentum display.
- Bollinger role: Part of the compression comparison.
- Momentum role: May help review direction after compression, depending on the tool.
- Skip rule: Skip if the added indicator makes the rule harder to explain, test, or invalidate.
Confirmation Tools For A Bollinger Band Squeeze
During compression, momentum measures may offer little information about a subsequent break. After price moves, RSI, ADX, MACD, and ATR can answer different momentum, strength, or volatility questions. Spot-forex volume-style measures typically depend on the data feed and are not consolidated market-wide transaction records.
Confirmation should answer a specific question. Adding more indicators does not automatically make the breakout cleaner. Each tool should have one job.
| Tool Or Context | Question It Helps Answer | Use Carefully Because |
|---|---|---|
| Support and resistance | Where is the breakout level? | The level is usually an area, not an exact price. |
| RSI | Is momentum supporting the breakout after price moves? | RSI should not guess direction before breakout structure appears. |
| ADX | Is trend strength developing after the breakout? | ADX may confirm late after price has already moved. |
| ATR | How large are recent true ranges, and what do they imply for a proposed stop? | ATR measures past ranges; stop placement and position sizing remain separate decisions. |
| MACD | Is momentum shifting with the breakout? | Momentum signals can lag or duplicate other confirmation. |
| Volume-style tools | Does the available feed report more or less activity during the move? | Broker tick counts or platform volume do not prove market-wide participation or identify which side initiated trades. |
For momentum confirmation, review Bollinger Bands and RSI strategy rules. For trend-strength confirmation, review ADX as a trend-strength filter. For volatility and stop-distance review, use ATR as volatility and risk support.
Bollinger Band Squeeze Settings And Timeframes
A common starting reference is 20-period Bollinger Bands with 2 standard deviations. BandWidth and a selected historical comparison window can quantify compression; %B separately records price position within or outside the bands. These are candidate testing specifications, not universal settings.
| Reference | Strategy Use | Main Risk |
|---|---|---|
| 20-period / 2 standard deviations | Common baseline for Bollinger Band squeeze review | Not automatically suitable for every pair or timeframe |
| BandWidth | Measures how narrow or wide the bands are | A low reading does not give direction |
| %B | Reviews where price sits relative to the bands | Can be misread as a trigger without structure |
| Shorter settings | Faster squeeze and breakout signals | More noise, false breaks, and spread sensitivity |
| Longer settings | Smoother compression review | Later signals and fewer examples to test |
| Lower timeframes | More frequent squeeze conditions | More timing pressure and trading-cost sensitivity |
| Higher timeframes | Cleaner structure in some conditions | Wider stops and larger exposure may need review |
Settings should be chosen before testing and kept consistent long enough to review successful breakouts, failed breakouts, skipped setups, late entries, and different currency-pair behavior.
Day Trading And Scalping Considerations
Short-term squeeze setups can look attractive because compression and breakout attempts appear more often on lower timeframes. More setups do not automatically make the method easier to trade.
| Short-Term Issue | Why It Matters | What To Check |
|---|---|---|
| Spread sensitivity | Small breakout targets can be reduced by trading cost | Check whether the target still makes sense after spread |
| False breakouts | A wick-only excursion and a confirmed break that later fails have different outcomes | Record them separately using the chosen closing rule |
| Timing pressure | Breakouts can move quickly after compression | Define trigger and invalidation before the breakout |
| Stop distance | Volatility can expand after the squeeze | Check whether position size and margin still fit |
| Event volatility | Large price moves around a release may raise rolling price dispersion and widen the bands | Review event timing, spread, slippage, and the loss scenario separately |
Before testing short-term squeeze rules, review FXGlory spreads. When stop distance and position size need to be checked together, use the FXGlory margin calculator. Review FXGlory trading platforms when the strategy depends on charting tools, Bollinger Band settings, alerts, order placement, or trade-management workflow.
Worked Example: One Bollinger Band Squeeze, Four Outcomes
Consider a hypothetical EUR/USD range from 1.0800 to 1.0810 during a squeeze. A chosen long-candidate rule requires a completed candle to close above 1.0810; a wick above that price followed by a close below it does not qualify. If a qualifying close is followed by another completed candle closing back inside 1.0800–1.0810, the example classifies that as a failed confirmed breakout. These prices illustrate rules, not an observed market event or a backtest result.
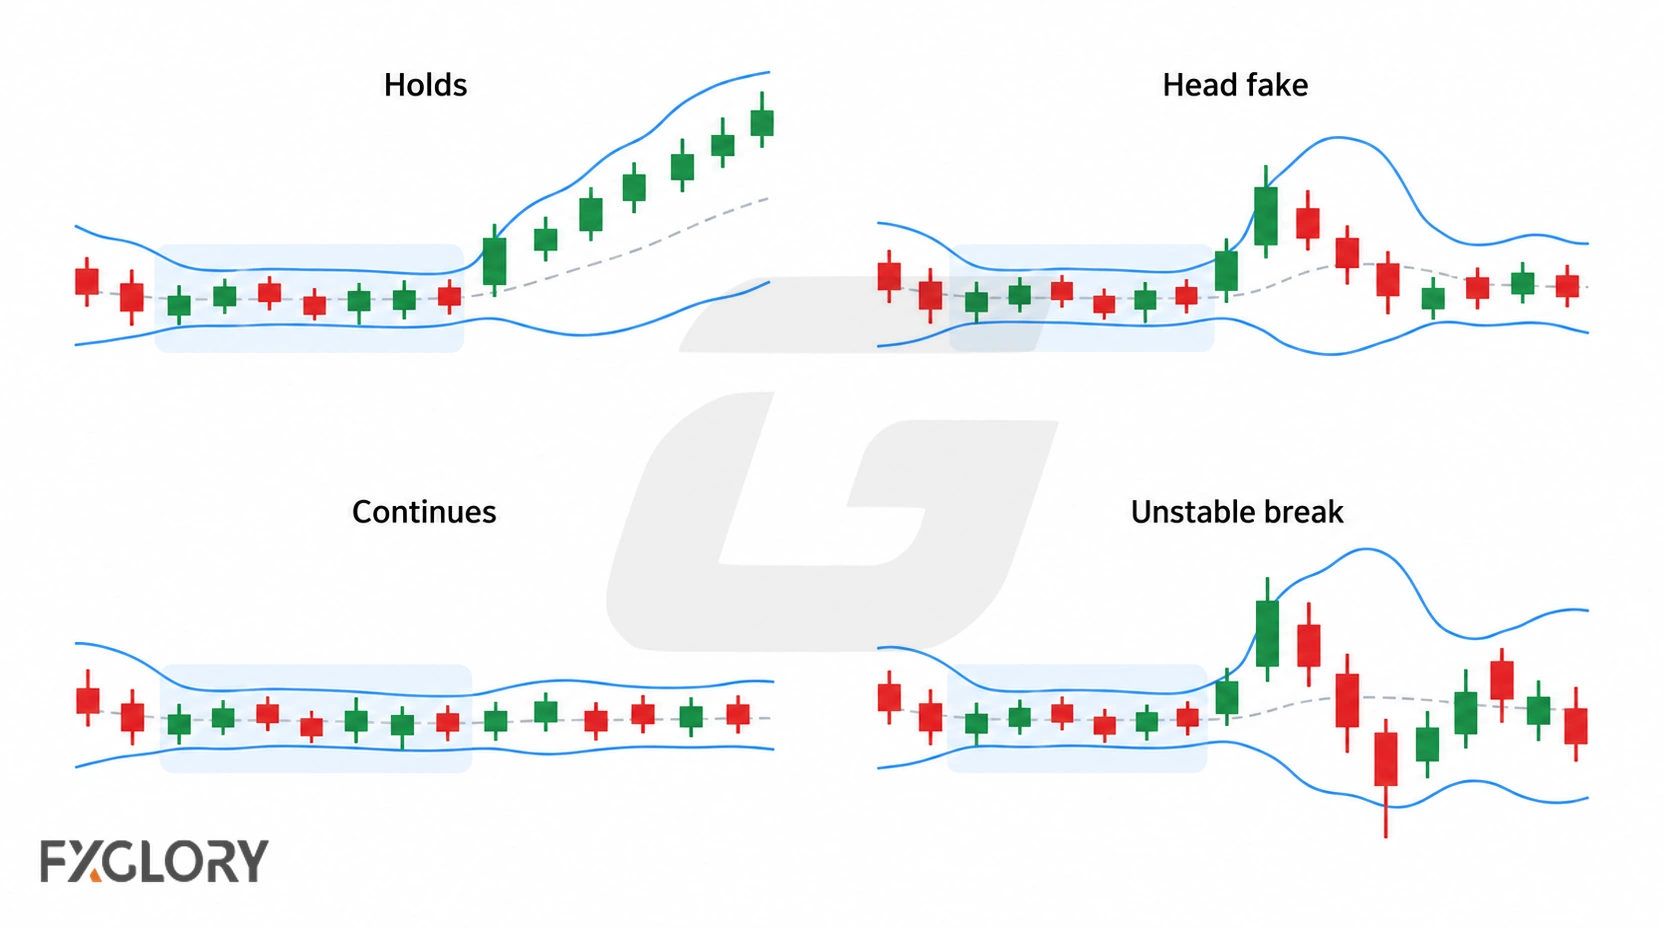
| Observation | Possible Meaning | Next Check | Skip If |
|---|---|---|---|
| Price breaks above resistance and holds | Upside expansion may be starting | Check retest, momentum, stop distance, and spread | The entry is already far from invalidation |
| Price breaks above resistance and returns inside | A head fake may be developing | Apply the failed-breakout rule | The trader holds only because the first breakout looked strong |
| Price stays inside the squeeze | Compression is continuing | Wait for structure to change | The trade requires guessing direction |
| Price breaks during event volatility | Movement may be unstable or disorderly | Check spread, slippage, and loss scenario | The trade cannot be managed with clear rules |
When Bollinger Band Squeeze Strategies Fail
A losing trade does not necessarily mean the squeeze was misidentified. Separate failures of the price scenario from failures in entry timing, execution, position sizing, and the trading plan.
- Direction guessed too early: The trader enters before price breaks a level.
- Confirmed break subsequently fails: A later close meets the predefined return-inside condition, but the trader ignores the applicable exit rule.
- No support or resistance: The squeeze is used without a clear breakout area.
- Late entry: The trade is accepted after price is already far from invalidation.
- BandWidth used alone: Compression is measured but not connected to a setup.
- News-event execution: A sharp move around an event leads to unexpectedly different fills, stops, or spreads.
- Spread problem: A short-term breakout target has too little room after trading cost.
- Stop distance ignored: Volatility expansion changes the loss scenario after entry.
- Settings changed too often: Bollinger Band settings or lookback rules are adjusted after each result.
Testing A Bollinger Band Squeeze Strategy
Evaluate a written strategy rule against both qualifying and rejected candidates. Record unconfirmed excursions separately from confirmed breakouts that later fail, and include sustained compression, late entries, event periods, and skipped setups in the sample.
- What market condition does the squeeze setup need?
- What fixed compression rule will be used (for example, BandWidth compared with its earlier readings over a selected lookback)? Will %B be logged separately as price-location context?
- Where is the support, resistance, range, or rectangle boundary?
- Which observable price event confirms a breakout, and must the candle be completed?
- How will an unconfirmed break attempt be distinguished from a subsequently failed confirmed breakout?
- Where is the idea invalid?
- Does the target still make sense after spread?
- Does stop distance fit position size and margin exposure?
- Are Bollinger Band settings kept consistent during the test?
- Are unconfirmed attempts, failed confirmed breaks, late entries, news events, and skipped setups logged separately?
- Does the result change across selected currency pairs or timeframes?
Record each candidate with its timestamp, selected settings, boundary, trigger and failure outcome, assumed bid/ask execution, costs, and planned exit. Keep a separate evaluation period rather than repeatedly tuning thresholds on the same sample; a historical result does not establish live performance.
Review available currency pairs before applying the same squeeze method everywhere. Review forex trend behavior when a breakout needs directional context.
Bollinger Band Squeeze Strategy Checklist
Use this short check before considering an individual setup; use the testing section above to evaluate the method over many examples.
- Does the observed band contraction satisfy the squeeze definition chosen in advance?
- Are the relevant support, resistance, or range boundaries marked?
- Has the required completed-candle break or retest condition actually occurred?
- Is the structural failure condition defined separately from the order’s stop or exit rule?
- Can the planned entry and target absorb realistic spread and slippage assumptions?
- Do stop distance, position size, and margin exposure fit the chosen risk limit?
- Could a scheduled event or rapidly changing execution condition invalidate the planned assumptions?
- If any required condition is missing, is the decision to skip the trade explicit?
An unclear trigger is not a reason to improvise after entry. Record the setup as unqualified until the written conditions are met.