

What Is Forex Multiple Time Frame Analysis?
Forex multiple time frame analysis means reviewing the same currency pair across more than one chart interval before planning a trade. The purpose is to compare broad structure with the conditions of a specific trade, not to demand identical signals on every chart.
For example, a 4H chart can show an uptrend approaching resistance, while the 1H chart shows whether a pullback setup has enough room to develop. A 15M chart is optional: it can refine entry timing, but it cannot remove the nearby 4H obstacle.
For broader chart selection by trading style, use the main forex timeframe guide. This page stays focused on how to combine time frames.
Why Multiple Time Frame Analysis Starts From The Higher Chart
Top-down analysis starts with the higher time frame because the higher chart shows the larger structure first. It can reveal whether price is trending, ranging, approaching a major zone, or sitting in unclear conditions.
Starting from the lower chart creates a different problem. A trader may see a fast signal on 5M or 1M, then move upward only to search for a reason to keep the idea. That reverses the purpose of multiple time frame analysis.
For example, mark a daily resistance zone before considering a 1H long setup. If the 1H target lies inside that zone, the trader can assess the reduced target room before selecting a 15M entry trigger. Checking resistance only after seeing the 15M trigger risks rationalizing an entry already chosen.
Which Chart Owns Each Decision?
Chart ownership resolves situations in which the daily chart identifies resistance, the 4H chart shows a breakout candidate, and the 1H chart produces a contrary candle. The table assigns the decision that should be reviewed on each chart, including which original chart to use after the trade closes.
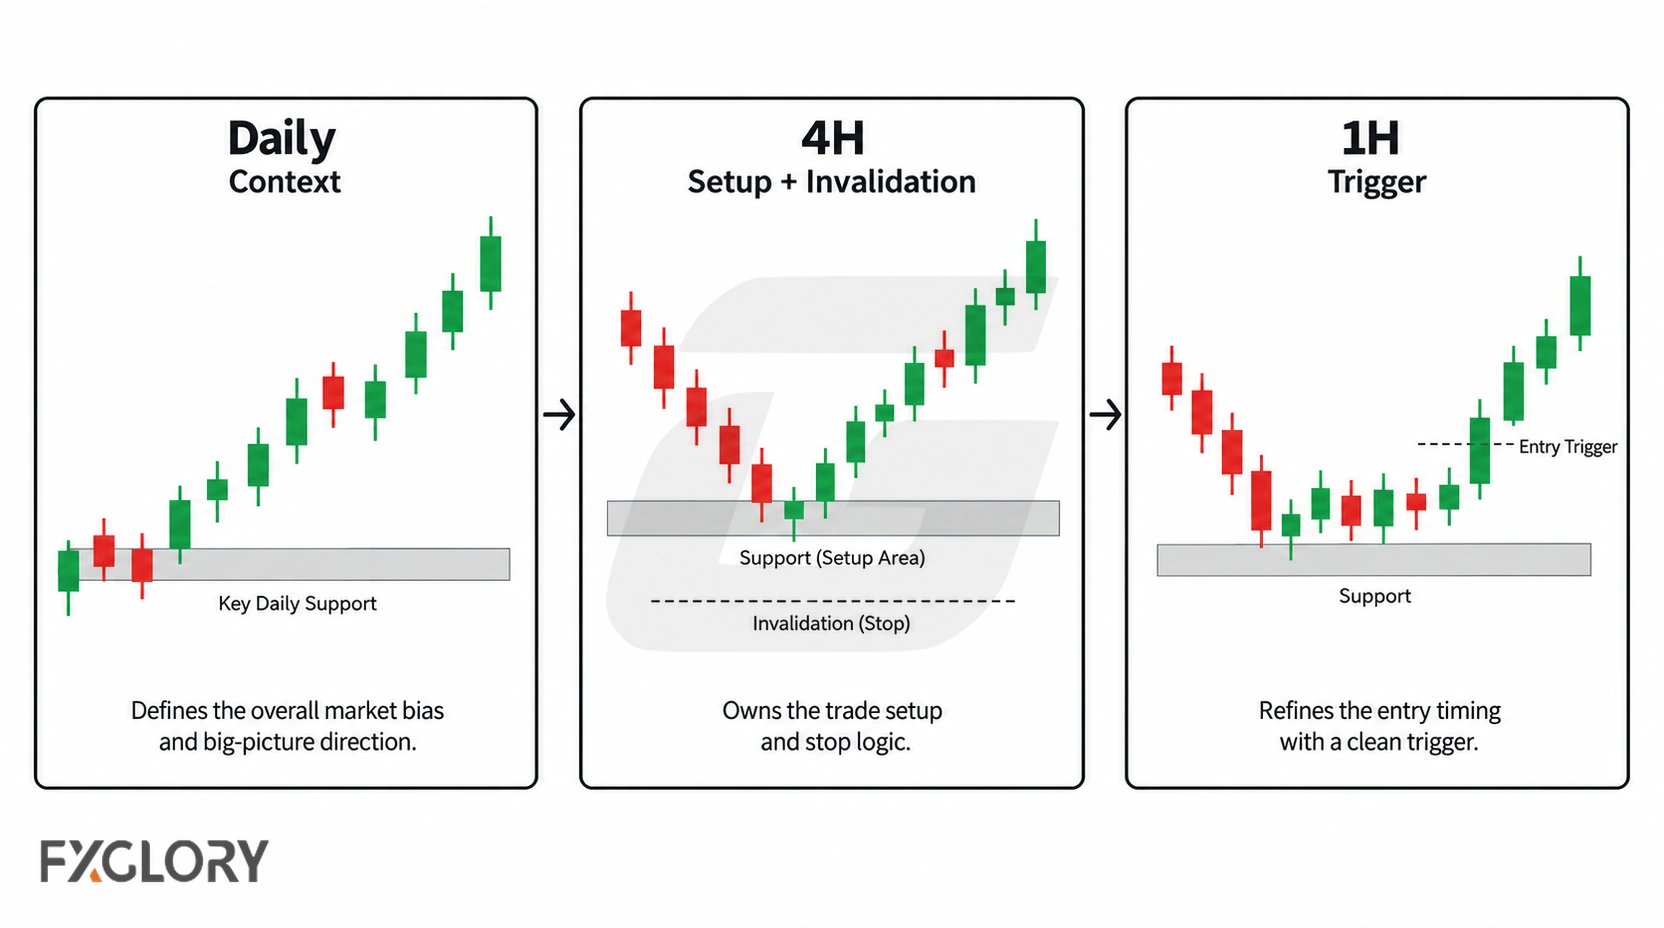
| Chart role | Decision it owns | Common examples | Main mistake |
|---|---|---|---|
| Context chart | Market condition, larger direction, major zones, and obstacles | Daily, 4H, 1H | Using it as a direct entry signal |
| Setup chart | The trade idea, setup quality, and invalidation area | 4H, 1H, 15M, 5M | Entering before the setup is defined |
| Trigger chart | Entry refinement only after the setup exists | 1H, 15M, 5M, 1M | Letting the smallest chart control the trade |
| Review chart | Whether the trade followed the planned chart order | The original setup chart | Reviewing from a different chart after the result is known |
A structured setup framework is useful when the trade setup itself needs more detail. On this page, the key question is narrower: which timeframe owns each part of the decision?
MTF Chart Combinations By Trading Style
Choose a combination by the intended holding period, the timeframe on which a setup and its failure level can be identified, and how frequently entries can be monitored. Compare what each additional chart actually contributes: if two charts show essentially the same swing boundary, the extra chart may add little; if a trigger chart is too fast to manage consistently, omit it.
| Combination | Typical use | Context owner | Setup or trigger owner |
|---|---|---|---|
| Daily → 4H → 1H | Swing or slower intraday planning | Daily shows broad structure | 4H defines setup; 1H may refine timing |
| 4H → 1H → 15M | Intraday or short swing planning | 4H shows direction and key zones | 1H defines setup; 15M refines timing |
| 1H → 15M → 5M | Day trading | 1H shows intraday context | 15M defines setup; 5M refines entry |
| 15M → 5M → 1M | Scalping | 15M shows short-term structure | 5M defines setup; 1M refines timing |
Assess each pair using observed ATR or recent candle ranges, the spread relative to the planned stop and target, and the number of qualifying setups in the intended trading window. High volatility does not automatically require more charts or an undefined “stricter” filter; changing the chart combination or trigger conditions requires a documented new test.
The 1:4 And 1:6 Time Frame Relationship
Some traders use different chart durations to separate broad structure from entry detail, but a 1:4 or 1:6 ratio is an illustrative convention, not a tested requirement or proof of better performance. By chart duration, Daily to 4H is 6:1, 4H to 1H is 4:1, and 1H to 15M is 4:1; 15M to 5M is 3:1, not 4:1 or 6:1.
- Similar information: If 5M and 3M identify the same swing boundary and timing decision, the second chart may be unnecessary.
- Unrelated horizon: A monthly chart may show a major zone but offer little help timing a one-minute scalp; state its role before adding it.
- Selection test: Compare combinations by whether they identify a distinct setup, a stable invalidation level, and entries whose expected movement can reasonably cover costs.
What To Do When Time Frames Disagree
Time frame conflict is normal. A higher chart may show an uptrend while the lower chart shows a short-term pullback. A daily chart may show price near resistance while the 15M chart shows a bullish break. Multiple time frame analysis does not remove conflict; it gives the trader a way to classify it.
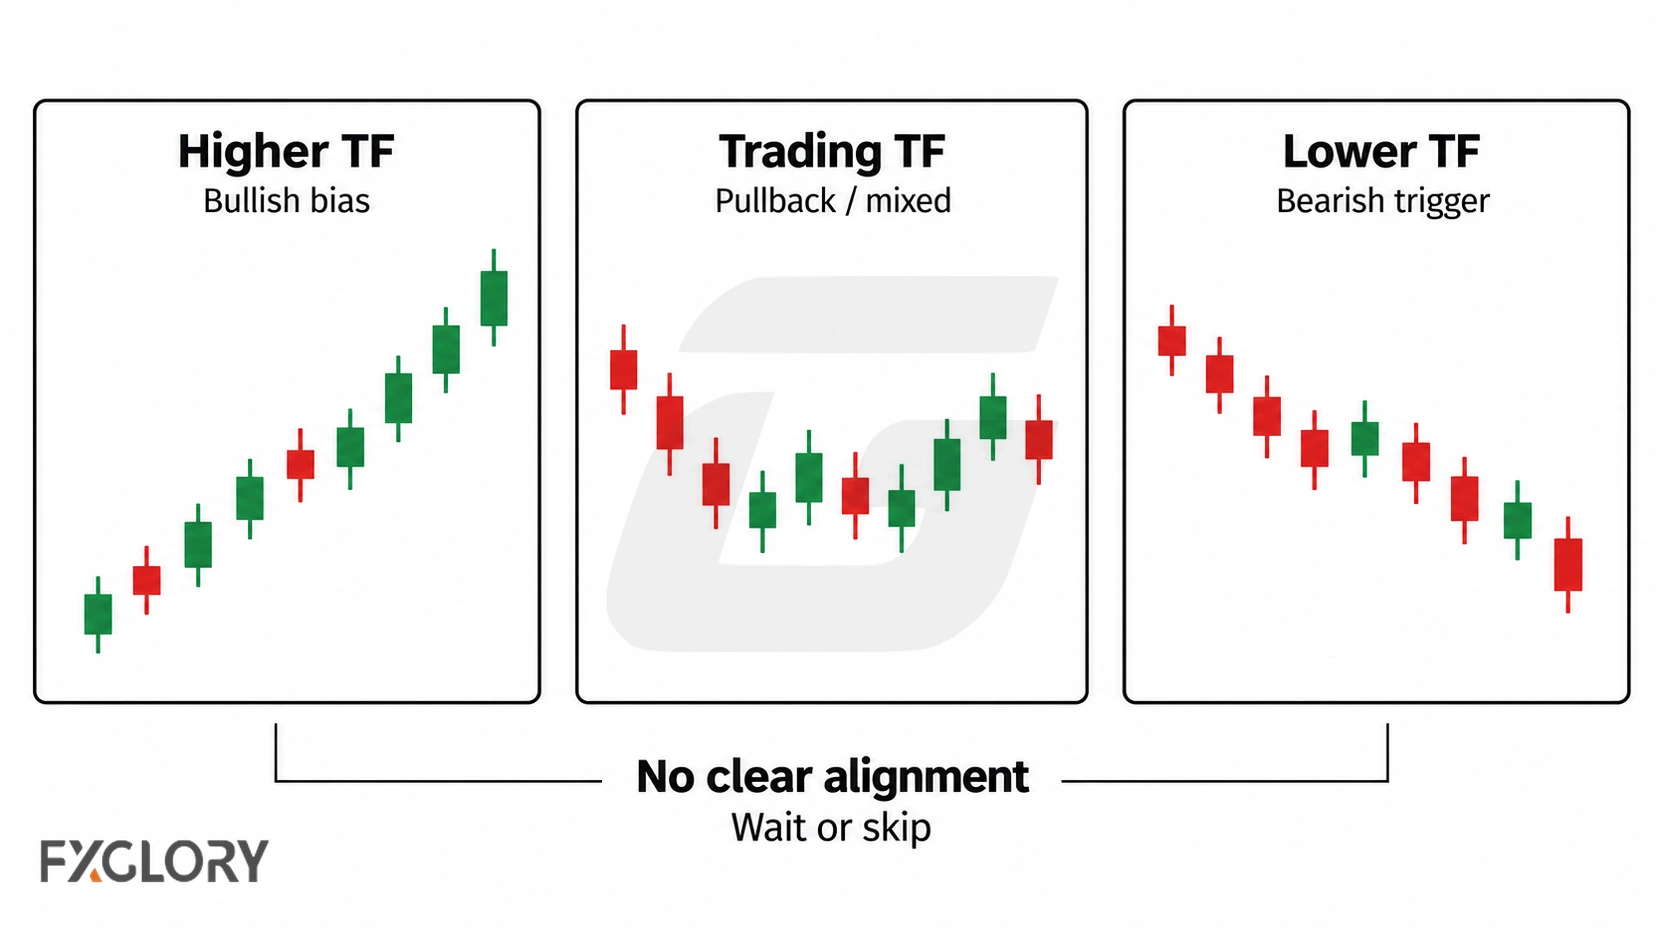
| Conflict | What it may mean | Practical response |
|---|---|---|
| Higher chart trends up, lower chart pulls back | The lower chart may be showing a retracement inside the larger move | Wait for the setup chart to show whether the pullback is stabilizing or breaking structure |
| Lower chart moves against the higher-timeframe trend | The setup may be counter-trend rather than aligned with context | Require clearer invalidation, reduce expectations, or skip if the trade is moving into a higher-chart obstacle |
| Higher chart is near resistance, lower chart shows a buy trigger | The lower signal may be running into an obstacle | Skip, reduce expectations, or wait for a cleaner break and retest depending on the written plan |
| Higher chart ranges, lower chart trends | The lower move may be inside a larger range | Check whether there is enough room before the next range boundary |
| Higher chart is unclear, lower chart gives frequent signals | The trader may be reacting to noise | Stand aside until context becomes readable |
How MTF Improves Entries Without Rewriting The Trade
Entry refinement should be evaluated by the difference it makes to the planned fill and stop distance. For example, suppose 4H context is upward and the 1H chart shows a pullback holding a premarked swing low. A trader may require a completed 15M close above a local reaction high before entering. If that trigger never occurs, the entry is skipped; if the 1H swing low fails under the predefined rule, the original setup is canceled. A favorable 15M candle cannot revive that canceled setup.
The smaller chart should be judged against the entry it replaces: does it reduce late fills or unnecessary trades without introducing excessive spread sensitivity or missing otherwise valid entries? That is a question for testing, not an assumption about lower charts.
This is why the same chart ownership model changes by style. A day trader may use 1H, 15M, and 5M as an intraday routine, while a scalper may use 15M, 5M, and 1M as a fast-chart routine.
Where Invalidation Comes From
The invalidation condition should follow the price structure that defines the trade. For a hypothetical long setup around a prior 1H swing low, the trader might define failure as a completed 1H close below that low. A brief 5M dip need not meet that rule, while a completed 1H failure cannot be dismissed because a later 5M candle looks bullish. Other setups may use an intrabar breach; specify the rule before entry.
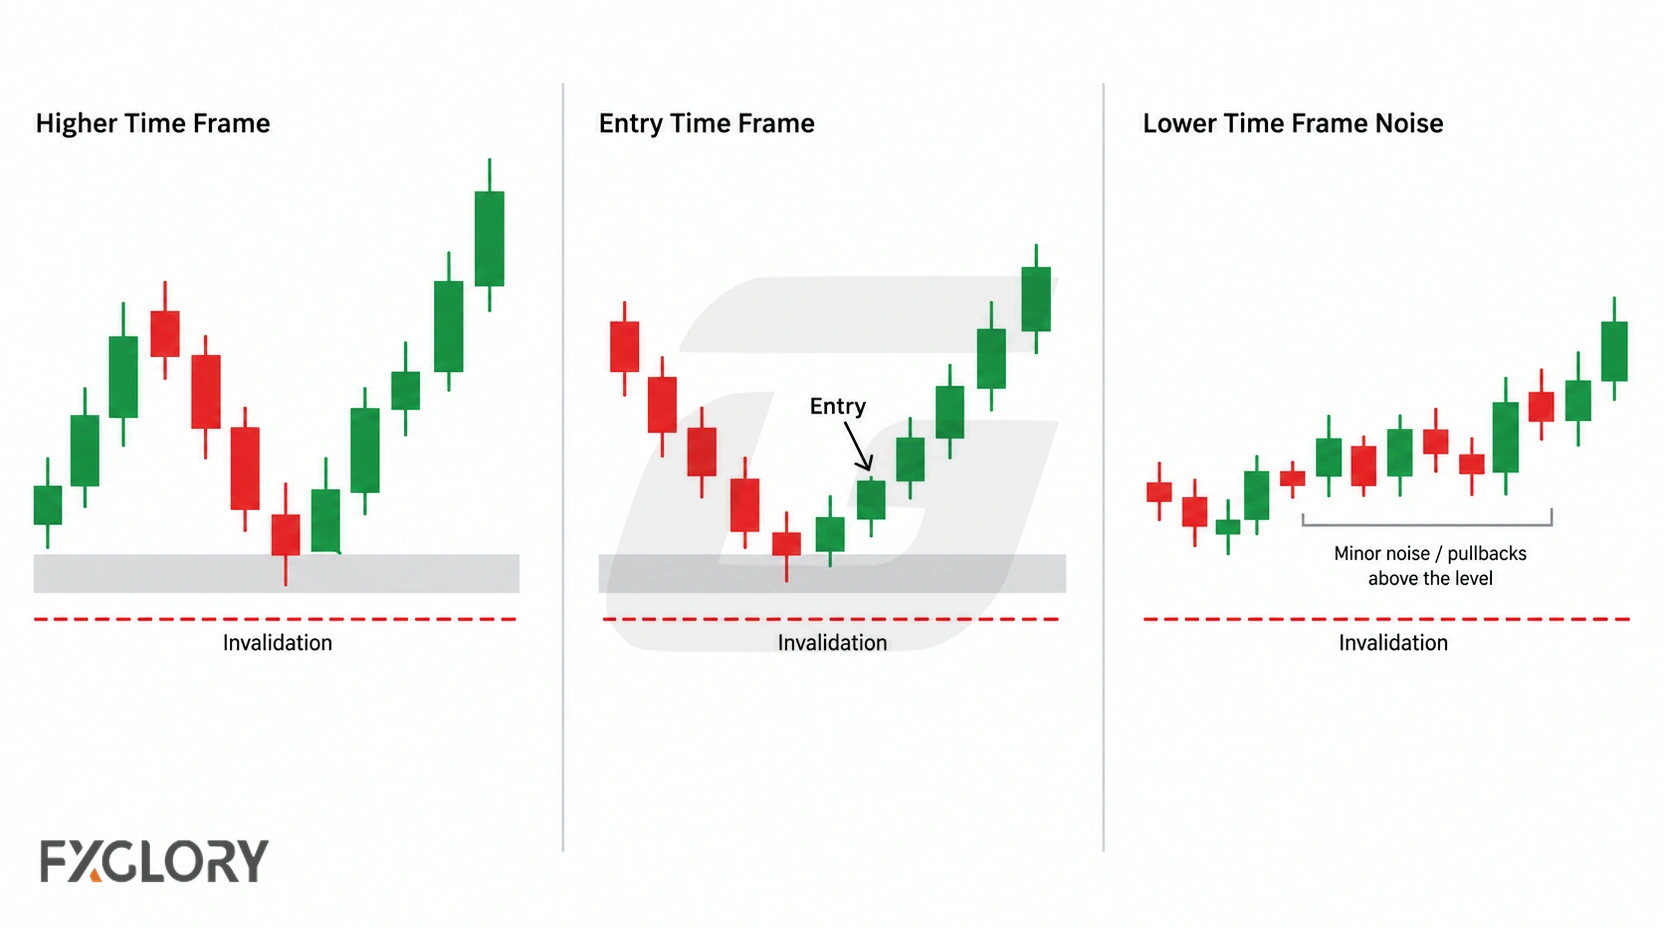
MTF can make entries more precise, but a tighter entry does not automatically make the trade better. The stop, position size, spread, and margin requirement still need to fit the plan.
- Structural failure: Specify whether an intrabar breach or a completed setup-chart close invalidates the idea.
- Protective order: Place and size the planned stop separately; an order may execute away from its trigger during gaps or fast markets.
- Exposure: Calculate size from the entry-to-stop distance, instrument pip value, and permitted account risk, then check margin and total open exposure.
Use FXGlory spread information when lower charts are used for entries, and use the margin calculator before comparing stop distances across different setup charts.
MTF For Day Trading And Scalping
Trading style changes how quickly a setup can be monitored, how far the protective stop may be from entry, and how much of the expected move trading costs consume. The combinations below are examples to test, not universal defaults.
| Trading style | Example MTF routine | What to control |
|---|---|---|
| Day trading | 1H for context, 15M for setup, 5M for trigger | Session conditions, spread, lower-chart noise, and stop distance |
| Scalping | 15M for context, 5M for setup, 1M for trigger | Spread impact, execution speed, overtrading, and fast invalidation |
| Swing planning | Daily for context, 4H for setup, 1H for timing | Wider stops, holding time, event risk, and position size |
MTF Workspace And Review Routine
Set up the workspace so that each candidate can be reconstructed after the result is known. Save the market and candle timestamps, the levels marked before entry, the setup-chart invalidation condition, the lower-chart trigger, the planned and actual entry, spread, and exit reason.
- Set the chart order: Context first, setup second, trigger third.
- Use the same pair: Test the same market across the same chart combination before switching pairs.
- Write the role beside each chart: For example, 1H context, 15M setup, 5M trigger.
- Predefine evaluation: Choose an evaluation window and record how many qualifying and skipped candidates occur across different conditions; do not treat one or two outcomes as sufficient evidence.
- Record the failure type: Context problem, setup problem, trigger problem, spread problem, or rule-breaking.
Review FXGlory trading platforms before building a multi-chart workspace, and use the currency-pair pages when selecting which forex markets to test across time frames.
Common Multiple Time Frame Analysis Mistakes
- Unrecorded starting chart: The journal shows an entry signal but no higher-chart levels marked before it appeared, making hindsight bias difficult to detect.
- Using too many time frames: More charts can create more conflict instead of better analysis.
- Changing the chart order after entry: The trader uses a different chart to justify staying in a weak trade.
- Letting the trigger chart define invalidation: The lowest chart should not replace the setup chart.
- Obstacle discovered after entry: A major pre-existing level appears in the post-trade review but was missing from the entry notes.
- Treating counter-trend movement as normal alignment: A lower-chart move against higher context needs stricter rules or no trade.
- Using similar charts for no reason: Charts that are too close together may repeat the same noise.
- Unmeasured execution cost: The journal records the theoretical trigger but not the spread and actual fill, so apparent entry improvement cannot be evaluated.
- Reviewing from hindsight: The chart roles should be judged from the plan that existed before entry.
Practice One MTF Routine Before Trading Live
Use historical replay or a demo environment to check whether the planned chart sequence can be followed in real time, including when a higher-chart candle remains unfinished or a trigger arrives near a spread change.
- Before analysis: Record the pair, chart durations, timezone/session convention, and the levels visible on completed higher-chart candles.
- Before entry: Note the setup-chart condition, a specific trigger-candle close, and the distance to the next mapped obstacle.
- Before position sizing: Check stop distance, spread, and margin requirement.
- After exit: Record whether the trade followed the planned chart order.
- At the planned review: Compare qualifying, rejected, and executed cases by context, setup, trigger, cost, and rule adherence.
Use the demo account information to check chart availability, candle-close timing, order placement, stop workflow, and recorded spreads before considering live execution. Demo fills do not establish live execution quality.
MTF Workflow Test Notes For Forex Multiple Time Frame Analysis
This hypothetical educational MTF workflow model uses one Daily-4H-1H multiple-timeframe routine: daily context, 4H setup ownership, 1H trigger timing, 4H stop placement, 4H invalidation, a 1.5R target comparison, time exit, and spread/slippage sensitivity. It does not test every chart combination, discretionary chart reading, scalping routine, day-trading routine, swing-trading routine, or every possible multiple-timeframe method.
The model reviewed EURUSD, GBPUSD, USDJPY, AUDUSD, USDCAD, and USDCHF on public yfinance 1-hour OHLC data where available. The script resamples 1-hour candles into 4-hour and daily candles. The structured data-status records list downloaded 1H timestamps from 2023-09-12 23:00 UTC through 2026-06-30 06:00 UTC, while the recorded data request is “730d”; these fields alone do not establish the exact eligible testing window. The archived script and trade log are needed to verify the active dates, 4H and daily candle boundaries, timezone alignment, and handling of incomplete resampled candles.
| Rule Area | Educational Model Rule |
|---|---|
| Strategy type | Daily context, 4H setup, and 1H entry-trigger model |
| Context chart | Daily EMA(50), EMA(200), and EMA(50) slope define long or short context |
| Setup chart | 4H completed-candle range breakout defines the trade idea, broken level, stop, and invalidation |
| Trigger chart | 1H pullback-and-confirmation candle refines timing only |
| Daily long context | Daily close above EMA(200), EMA(50) above EMA(200), and EMA(50) slope over 5 completed daily candles positive |
| Daily short context | Daily close below EMA(200), EMA(50) below EMA(200), and EMA(50) slope over 5 completed daily candles negative |
| 4H setup | 20-candle 4H range breakout with range width between 1.00 and 4.50 ATR(14) |
| 1H trigger window | Next 6 completed 1H candles after the 4H setup candle |
| 1H long trigger | Pullback into EMA(20), close back above EMA(20), bullish close, upper 40% close location, and no more than 0.75 ATR(14) above EMA(20) |
| 1H short trigger | Pullback into EMA(20), close back below EMA(20), bearish close, lower 40% close location, and no more than 0.75 ATR(14) below EMA(20) |
| Entry | Next 1H open after the completed trigger candle |
| Stop | 4H setup-chart stop using the previous 5 completed 4H candle extreme with a 0.25 ATR(14) buffer |
| Target comparison | Fixed 1.5R target from entry |
| Failure exit | Long exits on 4H close back below the old 4H range high; short exits on 4H close back above the old 4H range low |
| Maximum holding review | 48 one-hour candles after entry |
The review records setup candidate count, accepted trades, rejected candidates, rejection reasons, trade count, win rate, average win in R, average loss in R, expectancy in R, profit factor, maximum drawdown in R, worst losing streak, average holding period, pair-level behavior, direction-level behavior, exit reasons, and spread/slippage sensitivity.
| Cost Input | Assumptions Used |
|---|---|
| Spread | 0.5, 1.5, and 3.0 pips |
| Slippage | 0.1, 0.5, and 1.0 pips per side |
| Baseline comparison | 1.5-pip spread and 0.5-pip slippage per side |
| Swap and rollover | Not included |
Educational MTF Workflow Test Results
The baseline run used a 1.5-pip spread and 0.5-pip slippage per side. Results are measured in R; they are hypothetical outputs from a small sample of one Daily-4H-1H workflow. Use the tables to compare acceptance, exits, instruments, directions, and cost scenarios rather than to infer a reliable trading edge.
| Metric | Baseline Result |
|---|---|
| Setup candidates | 282 |
| Accepted trades | 16 |
| Rejected candidates | 266 |
| Main rejection reason | 266 rejected because no valid 1H trigger formed or stop-distance filtering failed |
| Trade count | 16 |
| Win rate | 25.0% |
| Average win | 0.9599R |
| Average loss | -0.3051R |
| Expectancy | 0.0111R |
| Profit factor | 1.0487 |
| Maximum drawdown | -1.5082R |
| Worst losing streak | 5 |
| Average holding period | 13.44 one-hour candles |
| Total net result | 0.1783R |
Pair-Level Baseline Results
| Pair | Trades | Win Rate | Expectancy | Profit Factor | Total Net Result |
|---|---|---|---|---|---|
| EURUSD | 1 | 0.0% | -0.0773R | 0.0 | -0.0773R |
| GBPUSD | 0 | n/a | n/a | n/a | n/a |
| USDJPY | 2 | 50.0% | 0.1065R | 1.5945 | 0.213R |
| AUDUSD | 2 | 0.0% | -0.1405R | 0.0 | -0.2809R |
| USDCAD | 7 | 28.57% | -0.0583R | 0.8226 | -0.4083R |
| USDCHF | 4 | 25.0% | 0.183R | 2.1372 | 0.7318R |
Direction-Level Baseline Results
| Direction | Trades | Win Rate | Expectancy | Profit Factor | Total Net Result |
|---|---|---|---|---|---|
| long | 11 | 27.27% | 0.0413R | 1.1616 | 0.4546R |
| short | 5 | 20.0% | -0.0553R | 0.6741 | -0.2763R |
Exit Reasons
| Exit Reason | Trades |
|---|---|
| h4 range failure close | 11 |
| stop loss | 1 |
| target 1.5R | 1 |
| time exit | 3 |
Spread And Slippage Sensitivity
| Spread | Slippage Per Side | Trades | Win Rate | Expectancy | Profit Factor | Total Net Result |
|---|---|---|---|---|---|---|
| 0.5 pips | 0.1 pips | 16 | 25.0% | 0.0567R | 1.2932 | 0.9072R |
| 0.5 pips | 0.5 pips | 16 | 25.0% | 0.0365R | 1.1743 | 0.5832R |
| 0.5 pips | 1.0 pips | 16 | 25.0% | 0.0111R | 1.0487 | 0.1783R |
| 1.5 pips | 0.1 pips | 16 | 25.0% | 0.0314R | 1.1473 | 0.5022R |
| 1.5 pips | 0.5 pips | 16 | 25.0% | 0.0111R | 1.0487 | 0.1783R |
| 1.5 pips | 1.0 pips | 16 | 25.0% | -0.0142R | 0.943 | -0.2266R |
| 3.0 pips | 0.1 pips | 16 | 25.0% | -0.0066R | 0.9729 | -0.1052R |
| 3.0 pips | 0.5 pips | 16 | 25.0% | -0.0268R | 0.8962 | -0.4291R |
| 3.0 pips | 1.0 pips | 16 | 25.0% | -0.0521R | 0.8125 | -0.834R |
What This MTF Workflow Test Shows
The test accepted 16 of 282 setup candidates. The other 266 were rejected under a combined condition: no qualifying 1H trigger or failure of the stop-distance filter. Because those reasons are not counted separately, the results cannot show how many candidates the 1H trigger alone rejected.
The central observation is cost sensitivity: the slightly positive baseline changes to a loss in several higher-cost scenarios despite an unchanged trade count. The sample is too small to establish a dependable advantage for the workflow or for multiple-timeframe analysis more broadly.