

What Is The Best Time Frame For Forex Scalping?
The best time frame for forex scalping is usually not one chart. A practical scalping routine uses a higher chart for context, a working chart for the setup, and a lower chart only when it improves entry timing.
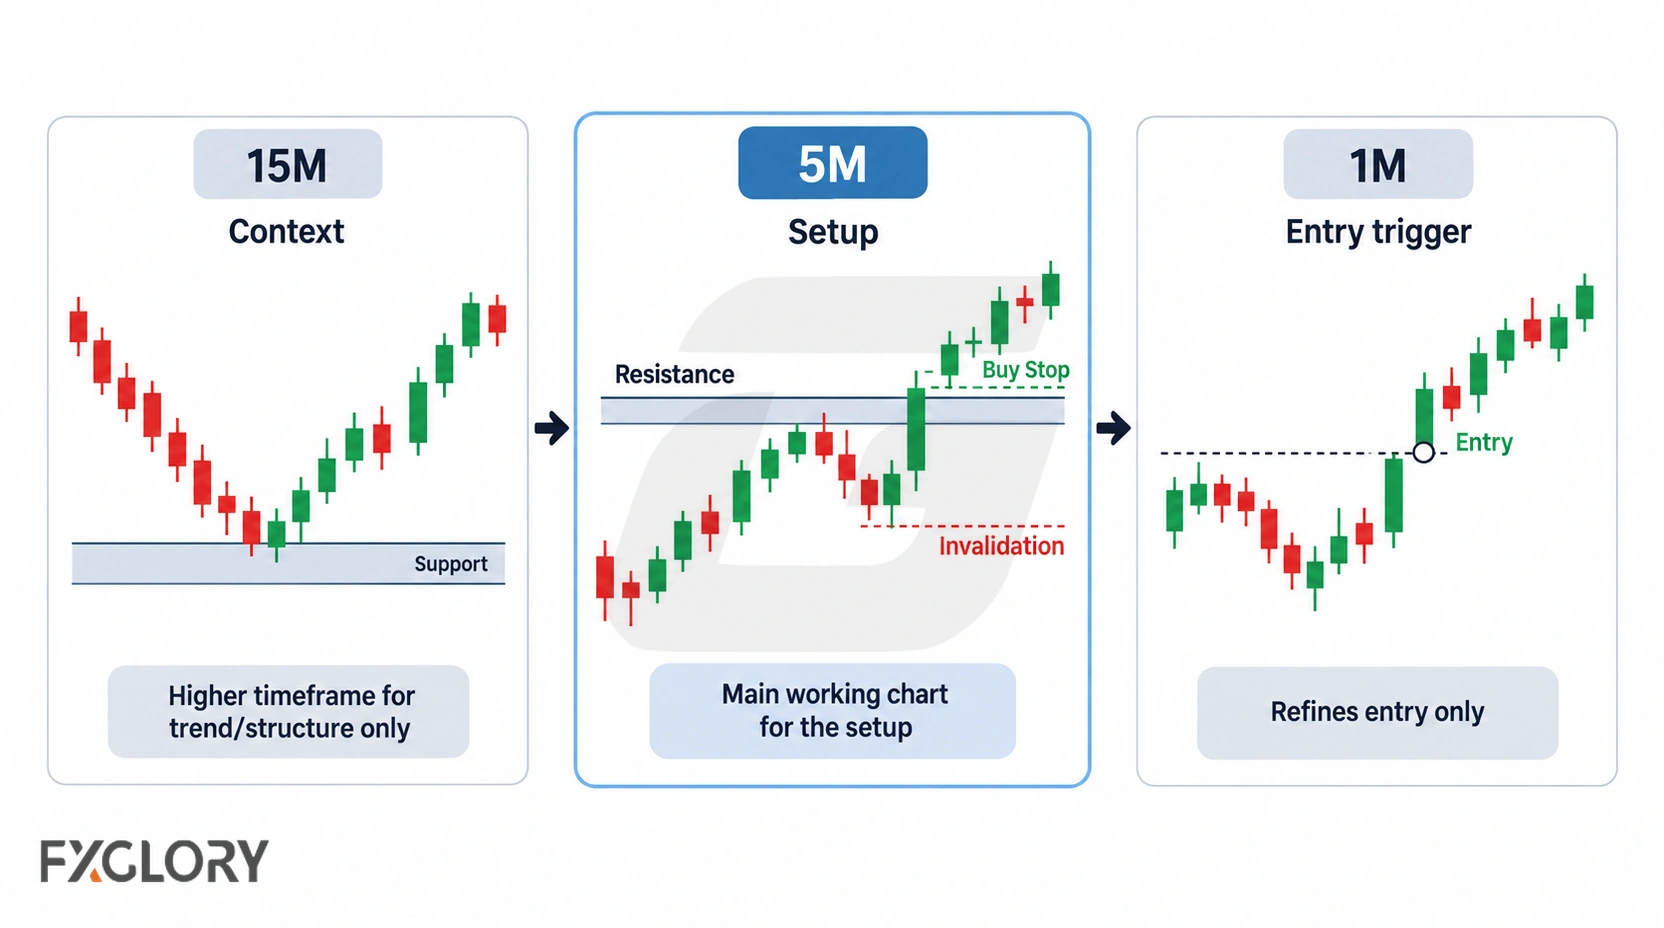
In a role-based routine, 5M often functions as the main setup chart because it sits between 15M structure and 1M execution detail. A controlled routine can use 15M or 30M for direction and structure, 5M for the setup, and 1M only for precise entry refinement after the setup is already valid.
For broader chart selection across trading styles, use the main forex timeframe guide. This page stays focused on scalping chart selection.
Why Scalping Timeframes Need Chart Roles
Scalping decisions happen quickly, so every chart needs a specific job before the trader watches the next candle. Without chart roles, the 1M chart can become a stream of reactions instead of an execution tool.
| Chart role | Question it answers | Common scalping choices |
|---|---|---|
| Context chart | Where is price trading from, and what direction or zone matters? | 30M, 15M, sometimes 4H for major structure |
| Setup chart | Is there a short-term setup with clear invalidation? | 15M, 5M |
| Trigger chart | Is the entry timing cleaner without changing the setup? | 5M, 1M |
| Risk review chart | Where is the idea wrong, and is the expected move enough after costs? | The setup chart, not a random lower candle |
A structured trading setup keeps context, trigger, invalidation, risk, and review separated, which is especially important when the lower chart produces frequent signals.
Forex Scalping Timeframe Map
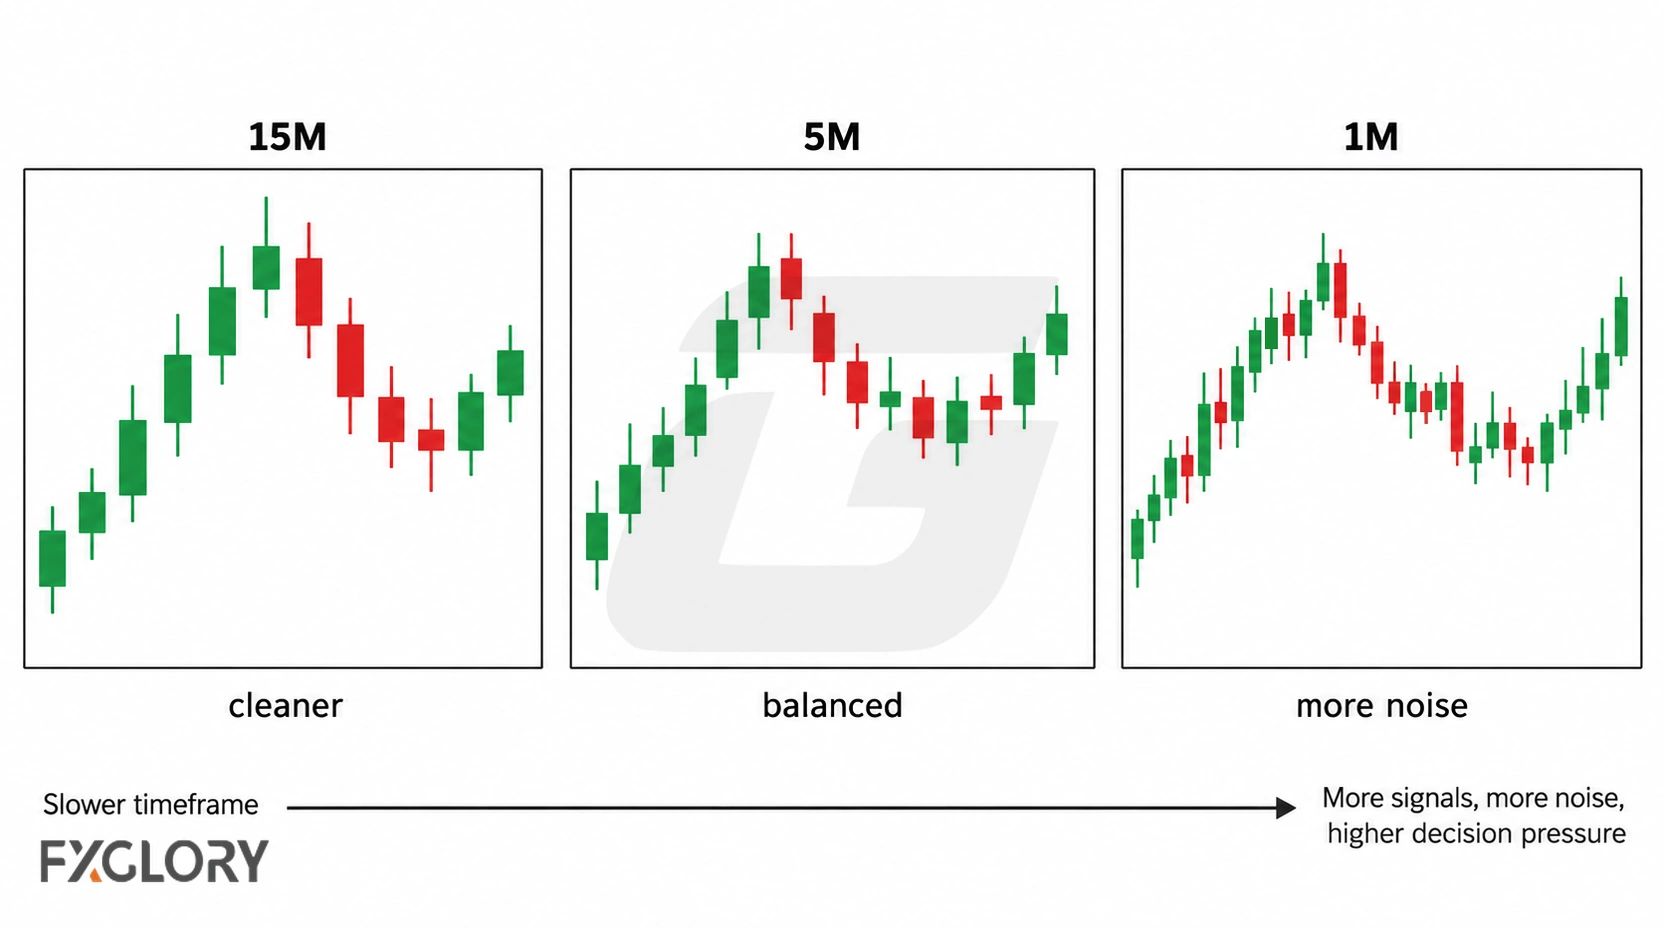
Scalping charts should be judged by role, not by how fast they move. A faster chart gives more candles, but it also gives more noise, more decisions, and more opportunities to break the plan.
| Time frame | Best scalping role | Useful when | Main caution |
|---|---|---|---|
| 4H | Major structure only | The trader wants to know larger trend direction or key zones before scalping lower charts | It is too broad for scalping entries |
| 30M | Context chart | The trader wants cleaner intraday direction before checking 5M or 1M | It may give fewer setup changes during one session |
| 15M | Context or setup chart | The trader wants short-term structure without reacting to every small move | It may feel slow for very short scalp entries |
| 5M | Main working chart | The trader wants a balance between setup detail and noise control | It can still encourage overtrading without a higher-chart filter |
| 3M | Optional fast chart | The trader wants more detail than 5M but less noise than 1M | It may not be available or preferred on every platform setup |
| 1M | Entry refinement only | The setup already exists and the trader needs a precise trigger | It is highly sensitive to spread, slippage, and emotional reactions |
The 15M-5M-1M Scalping Routine
The 15M-5M-1M routine is a practical way to stop the lowest chart from controlling the whole decision. The 15M chart gives structure. The 5M chart defines the working setup. The 1M chart is optional and should only refine timing.
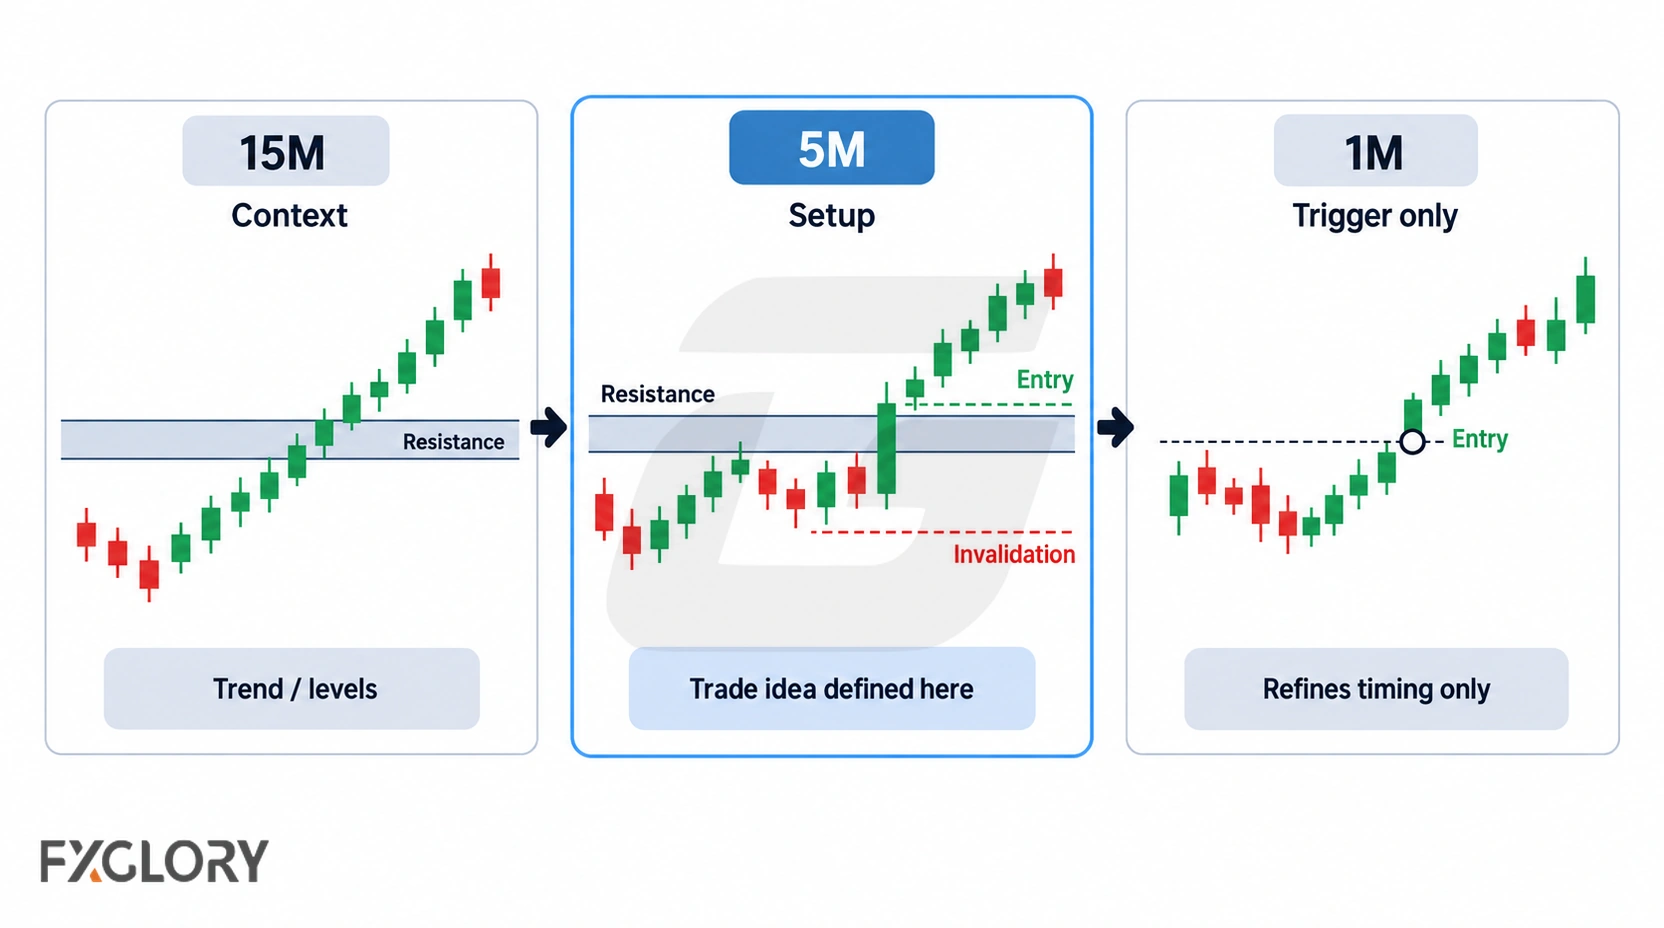
- Use 15M for context: Mark the short-term trend, range, nearby support or resistance, and whether price is approaching a difficult area.
- Use 5M for the setup: Look for the actual scalping structure, such as a pullback, range reaction, breakout attempt, or failed move.
- Use 1M only for the trigger: The 1M chart should help with timing after the 5M setup is already valid.
- Keep invalidation on the setup chart: The stop logic should come from the 5M or 15M structure, not from a random 1M candle.
- Check cost before entry: If the expected move is too small after spread, the lower timeframe does not fix the trade.
- Review the session: Record whether the entry followed the chart order or came from reacting to 1M noise.
The 4H-15M-5M Scalping Routine
Some scalpers use 4H only to mark larger structure before dropping to lower charts. In this routine, 4H is not the entry chart. It is used to identify broad trend direction, major support or resistance, and zones where short-term movement may become difficult.
After the larger area is marked, the 15M chart can show whether price is reacting cleanly, and the 5M chart can provide the actual scalping setup. This routine may suit traders who want a stronger location filter before taking fast intraday trades.
1-Minute Vs 5-Minute Vs 15-Minute For Forex Scalping
The 1M, 5M, and 15M charts are not competitors by default. They can answer different questions in the same scalping plan.
| Question | 15M | 5M | 1M |
|---|---|---|---|
| Best role | Context or setup quality | Main working setup | Entry refinement |
| Signal frequency | Lower | Moderate | High |
| Noise level | Lower than 5M and 1M | Balanced for many scalpers | Highest |
| Decision pressure | Lower | Moderate | Very high |
| Spread sensitivity | Important | Very important | Critical |
| Best avoided when | It hides too much entry detail | Higher-chart context is unclear | The trader is searching for signals instead of executing a setup |
For many scalpers, the 5M chart should carry the main setup decision. The 15M chart can stop the trader from scalping into poor structure, while the 1M chart can help only when timing needs refinement.
Best Timeframe For Beginner Forex Scalpers
Beginner scalpers often need fewer signals, not more. Starting from 1M can make every small fluctuation feel important, which increases the chance of overtrading and changing rules during the session.
A cleaner beginner routine is 15M for context and 5M for setup practice. The trader can add 1M later only after the plan already has written rules for entry, invalidation, spread checks, exit behavior, and when to stop trading for the session.
How Sessions Affect Forex Scalping Timeframes
A scalping timeframe is not the same thing as a trading session. A timeframe is the candle interval, such as 1M, 5M, or 15M. A session is the part of the trading day when certain markets and participants are active.
Scalping depends heavily on movement quality. A 1M or 5M chart during a quiet period may produce choppy signals with limited follow-through. During active periods, including commonly watched overlaps such as London/New York for many major pairs, movement may increase, but news timing and sudden volatility can still make entries difficult.
This is a session filter, not a full trading-session strategy. Before testing a scalping routine, choose the market and session together. Use the currency-pair pages to review available forex markets, then test whether the selected pair moves clearly enough during the trader's available hours.
Spread, Slippage, Stop Distance, And Margin Checks
Scalping is highly sensitive to trading costs because the expected move is usually small. A setup can look valid on 1M or 5M and still be impractical if the spread takes too much of the planned movement or if slippage changes the entry quality.
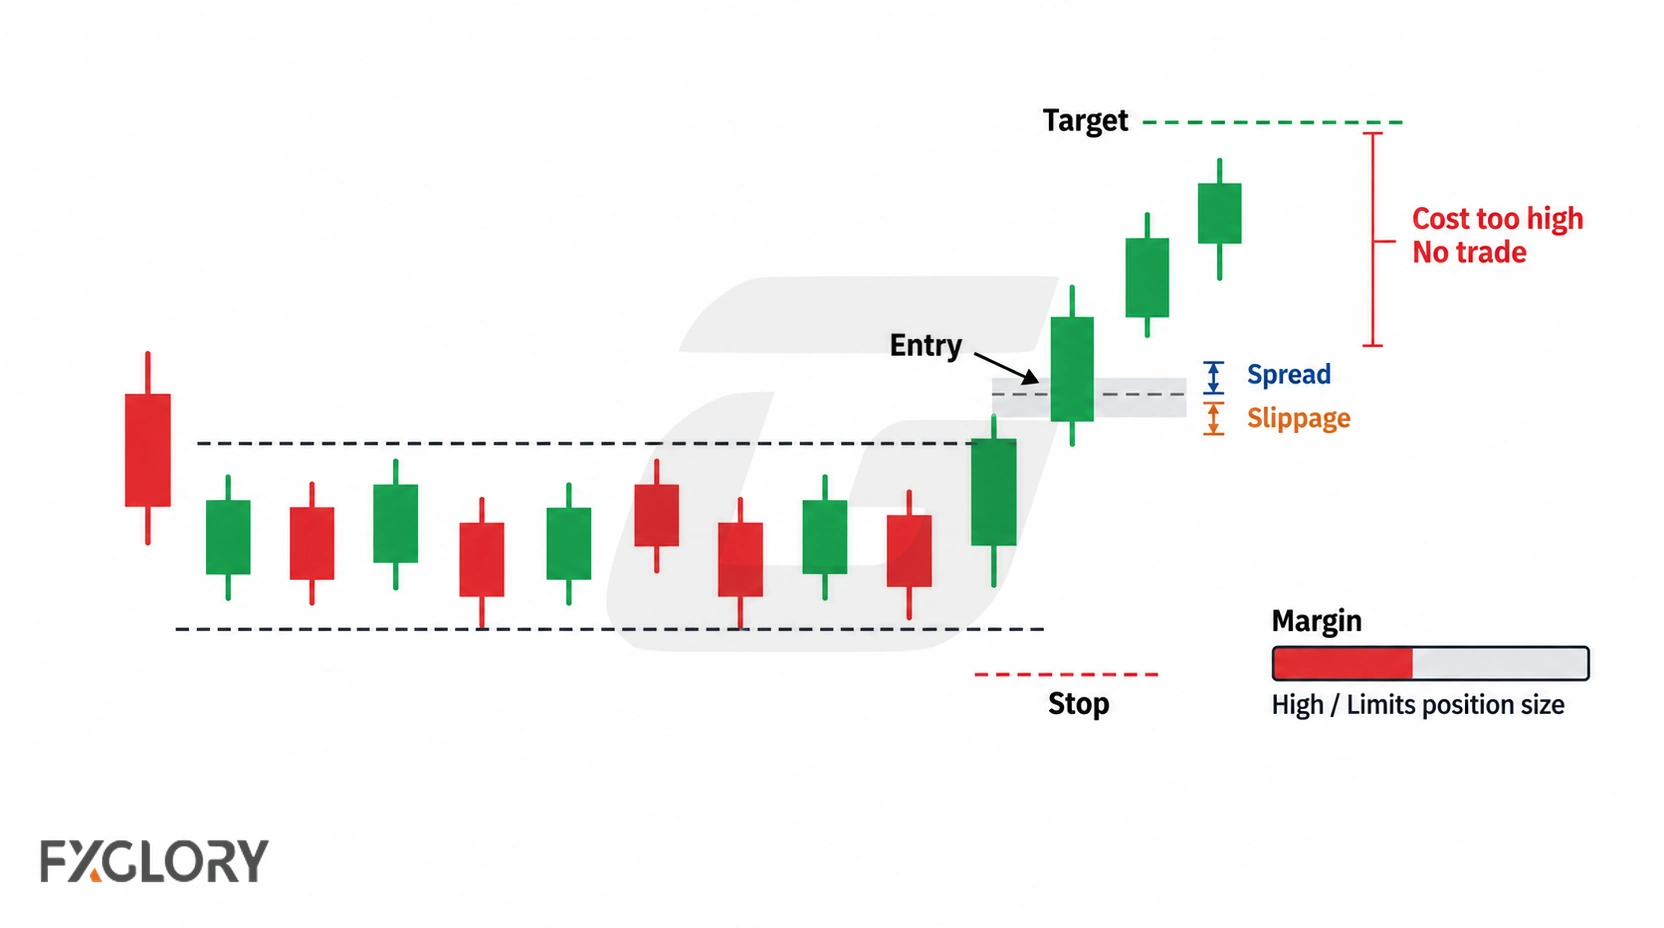
- Spread check: Is the expected scalp large enough after the spread is considered?
- Slippage check: Would a worse entry make the setup invalid or reduce the trade logic?
- Stop-distance check: Is the stop based on structure rather than a random tight number?
- Margin check: Does the position size fit the stop distance and account conditions?
- Session check: Is the market active enough, but not being distorted by immediate news risk?
- Stop-trading check: Is there a rule for ending the session after repeated invalid signals or rule-breaking?
Use FXGlory spread information when testing short-timeframe plans, and use the margin calculator before comparing position size across 15M, 5M, and 1M routines.
When Not To Drop From 5M To 1M
The 1M chart should be a timing tool, not a rescue tool. Dropping from 5M to 1M only makes sense when the 5M setup is already valid, the cost check is acceptable, and the trader knows exactly what the 1M chart must confirm.
- Do not drop to 1M when the 5M setup is unclear: More candles will not fix weak structure.
- Do not drop to 1M when spread is too large: A tighter entry does not repair an unfavorable cost-to-move relationship.
- Do not drop to 1M near immediate news risk: Fast candles can become execution noise rather than useful timing.
- Do not drop to 1M after missing the planned entry: The lower chart can turn a missed trade into a forced trade.
- Do not drop to 1M to move the stop: Invalidation belongs to the setup chart, not the latest small candle.
Common Forex Scalping Timeframe Mistakes
- Starting every decision from 1M: The trader reacts to fast candles before knowing the structure.
- Using 5M without context: A short-term pattern may be trading directly into a higher-chart obstacle.
- Calling every fast trade scalping: Scalping still needs entry, invalidation, exit, and review rules.
- Ignoring spread on small targets: The chart may move, but the cost structure may not support the trade idea.
- Moving stops from 1M noise: The stop should come from the setup, not from the most recent small candle.
- Scalping quiet periods as if they were active sessions: Thin movement can create entries with poor follow-through.
- Adding tools to fix unclear structure: More chart inputs do not repair a weak setup.
- Testing 1M, 3M, 5M, and 15M at the same time: The trader cannot tell which timeframe is actually helping or hurting the routine.
One-Session Scalping Practice Plan
A scalping timeframe routine should be tested one session at a time before live trading. Choose one pair, one session, one context chart, one setup chart, and one optional trigger chart. Do not change the chart order during the session.
- Before the session: Mark 15M or 30M context and define the areas where scalping is not allowed.
- During the session: Use 5M to wait for the setup; use 1M only when the 5M setup is already valid.
- Before entry: Check spread, stop distance, upcoming news, and whether the expected move is still practical.
- After exit: Record whether the trade followed the chart order or came from a fast-chart impulse.
- After several sessions: Review whether losses came from poor context, weak setup, cost sensitivity, timing, or rule-breaking.
Use the demo account information to practice one scalping timeframe routine before applying it to live trading conditions. A platform layout should make the routine easier to follow, so review FXGlory trading platforms before building a multi-chart scalping layout.
Scalping Timeframe Cost-Feasibility Study Notes
This hypothetical educational study compares 1M, 5M, and 15M scalping charts with one target-survival rule model. It checks whether a short-term target remains practical after spread and slippage assumptions. It does not rank one timeframe as best, and it does not simulate account return, leverage, margin, position size, expectancy, or profit factor.
The model reviewed EURUSD, GBPUSD, USDJPY, AUDUSD, USDCAD, and USDCHF using public yfinance 1-minute OHLC data where available. The 5M and 15M candles are resampled from the same 1-minute data window so the three timeframes are compared over the same available sample.
| Study Area | Educational Model Rule |
|---|---|
| Study type | Scalping timeframe cost-feasibility and target-survival comparison |
| Compared timeframes | 1M, 5M, and 15M |
| Base data | Public yfinance 1-minute OHLC data |
| Direction filter | EMA(20) compared with EMA(50) |
| Trigger range | Previous 6 completed candles |
| Long observation | Close above the trigger high by at least 0.05 ATR(14), above EMA(20), with close in the upper 40% of the candle range |
| Short observation | Close below the trigger low by at least 0.05 ATR(14), below EMA(20), with close in the lower 40% of the candle range |
| Entry reference | Next candle open after the completed signal candle |
| 1M gross target | max(3 pips, 0.75 ATR(14)) capped at 12 pips |
| 5M gross target | max(5 pips, 0.75 ATR(14)) capped at 20 pips |
| 15M gross target | max(8 pips, 0.75 ATR(14)) capped at 35 pips |
| Target survival | Target must be reached before whipsaw, adverse trigger-boundary touch, or time expiry |
| Cost feasibility | Net target after cost must be positive and round-turn cost must be 40% or less of the gross target |
| Maximum holding window | One hour: 60 candles on 1M, 12 candles on 5M, and 4 candles on 15M |
| Cost Input | Assumptions Used |
|---|---|
| Spread | 0.5, 1.5, and 3.0 pips |
| Slippage | 0.1, 0.5, and 1.0 pips per side |
| Baseline comparison | 1.5-pip spread and 0.5-pip slippage per side |
| Swap and rollover | Not included |
The review records observation count, gross target survival, positive net target after costs, cost-feasible target survival, cost share of target, whipsaw rate, adverse-touch rate, time-expiry rate, ambiguous same-candle outcomes, holding time, timeframe-level behavior, pair-level behavior, session-level behavior, and spread/slippage sensitivity.
Educational Cost-Feasibility Study Results
The baseline comparison used a 1.5-pip spread and 0.5-pip slippage per side, equal to a 2.5-pip round-turn cost. The study produced 1771 accepted observations from 2414 candidates after the same-pair/timeframe overlap filter.
| Baseline Metric | Value |
|---|---|
| Accepted observations | 1771 |
| Gross target survival rate | 25.07% |
| Positive net target rate | 100.0% |
| Cost-feasible rate | 10.95% |
| Cost-adjusted target survival rate | 2.15% |
| Average gross target | 4.2597 pips |
| Average net target after cost | 1.7597 pips |
| Median cost share of target | 70.84% |
| Whipsaw rate | 64.31% |
| Ambiguous same-candle rate | 1.47% |
Baseline By Timeframe
| Timeframe | Observations | Gross Target Survival | Cost-Feasible Rate | Cost-Adjusted Target Survival | Average Gross Target | Median Cost Share | Whipsaw Rate |
|---|---|---|---|---|---|---|---|
| 1M | 1044 | 24.14% | 0.1% | 0.0% | 3.1762 pips | 83.33% | 70.5% |
| 5M | 542 | 28.97% | 1.48% | 0.55% | 5.0655 pips | 50.0% | 58.67% |
| 15M | 185 | 18.92% | 100.0% | 18.92% | 8.0134 pips | 31.25% | 45.95% |
Baseline By Pair
| Pair | Observations | Gross Target Survival | Cost-Feasible Rate | Cost-Adjusted Target Survival | Median Cost Share | Whipsaw Rate |
|---|---|---|---|---|---|---|
| AUDUSD | 129 | 24.03% | 25.58% | 4.65% | 50.0% | 49.61% |
| EURUSD | 120 | 38.33% | 22.5% | 4.17% | 50.0% | 35.83% |
| GBPUSD | 152 | 26.32% | 24.34% | 4.61% | 50.0% | 58.55% |
| USDCAD | 374 | 18.45% | 10.16% | 2.41% | 65.98% | 72.73% |
| USDCHF | 535 | 26.73% | 6.17% | 0.37% | 83.33% | 66.54% |
| USDJPY | 461 | 24.95% | 5.64% | 1.95% | 83.33% | 68.33% |
Baseline By Session
| Session | Observations | Gross Target Survival | Cost-Feasible Rate | Cost-Adjusted Target Survival | Median Cost Share | Whipsaw Rate |
|---|---|---|---|---|---|---|
| Asia | 563 | 26.47% | 12.08% | 2.31% | 73.88% | 61.99% |
| London morning | 379 | 27.18% | 9.5% | 2.64% | 72.01% | 65.17% |
| London/New York overlap | 344 | 32.27% | 13.95% | 3.49% | 60.34% | 63.66% |
| New York afternoon | 350 | 16.86% | 7.71% | 0.86% | 74.42% | 70.57% |
| Rollover/off-hours | 135 | 16.3% | 11.11% | 0.0% | 62.96% | 57.04% |
Spread And Slippage Sensitivity
| Timeframe | Spread | Slippage Per Side | Round-Turn Cost | Cost-Feasible Rate | Cost-Adjusted Target Survival | Median Cost Share |
|---|---|---|---|---|---|---|
| 1M | 0.5 | 0.1 | 0.7 | 100.0% | 24.14% | 23.33% |
| 1M | 1.5 | 0.5 | 2.5 | 0.1% | 0.0% | 83.33% |
| 1M | 3.0 | 1.0 | 5.0 | 0.0% | 0.0% | 166.67% |
| 5M | 0.5 | 0.1 | 0.7 | 100.0% | 28.97% | 14.0% |
| 5M | 1.5 | 0.5 | 2.5 | 1.48% | 0.55% | 50.0% |
| 5M | 3.0 | 1.0 | 5.0 | 0.0% | 0.0% | 100.0% |
| 15M | 0.5 | 0.1 | 0.7 | 100.0% | 18.92% | 8.75% |
| 15M | 1.5 | 0.5 | 2.5 | 100.0% | 18.92% | 31.25% |
| 15M | 3.0 | 1.0 | 5.0 | 0.0% | 0.0% | 62.5% |
What This Cost-Feasibility Study Shows
The baseline sample had a 25.07% gross target survival rate, but only a 2.15% cost-adjusted target survival rate after the 2.5-pip round-turn cost and 40% cost-share rule were applied.
The 1M chart produced the largest number of observations, but its median cost share was 83.33% of the gross target and its baseline cost-adjusted target survival rate was 0.0%. The 5M chart had the highest gross target survival rate at 28.97%, but its median cost share was 50.0%, above the model's 40% feasibility threshold. The 15M chart had fewer observations and a lower gross target survival rate, but its 8-pip median target kept the baseline cost share at 31.25%.
For this educational model, the main pressure came from small target size, spread and slippage assumptions, and whipsaw closes back inside the trigger range. The study points to cost gating as a scalping filter: a fast chart can generate more observations, but the target must remain large enough after round-turn cost.
Use the result as a cost-feasibility review, not as a live-trading conclusion. Test one pair, one session, one timeframe routine, one target rule, and one cost assumption before comparing scalping chart intervals.