

What Is the Three Black Crows Pattern in Forex?
Three Black Crows is a bearish three-candlestick formation, traditionally examined after an upward move. It consists of three consecutive bearish candles with progressively lower closes, typically substantial real bodies and relatively short lower shadows. Later candles commonly open within the preceding real body. On platforms that use red instead of black for bearish candles, the name and structure are unchanged.
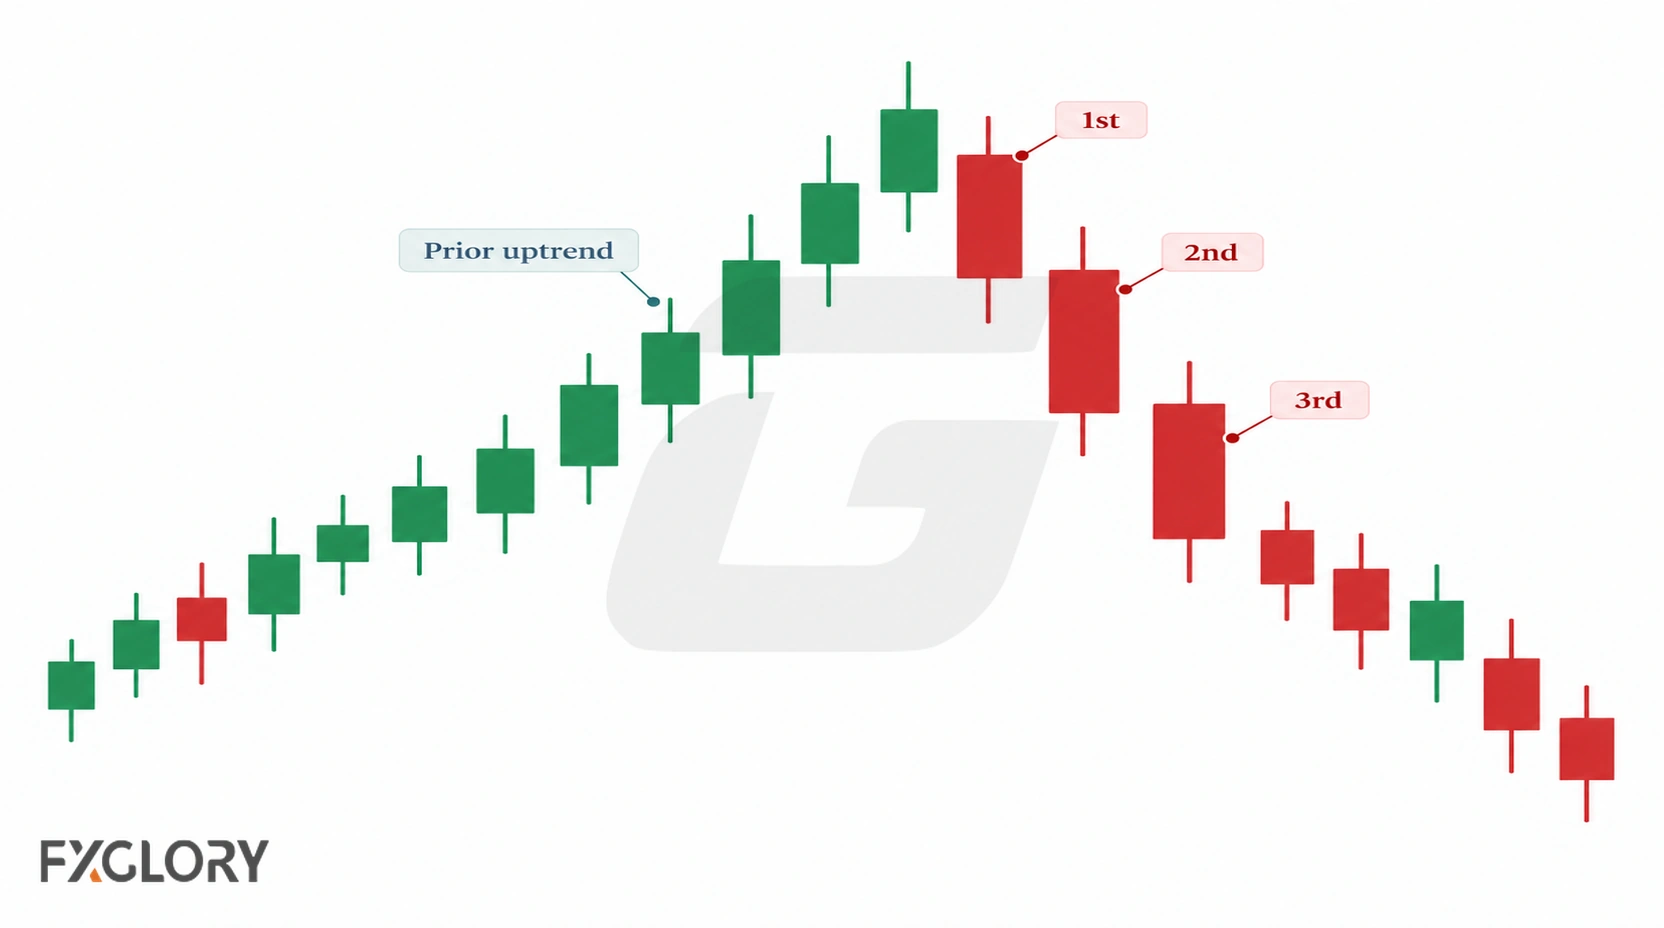
The sequence shows that prices declined over three completed candle periods. It can suggest a change in pressure after an advance, but it does not, by itself, establish a trend reversal or predict how far price will fall. For a refresher on real bodies and wicks, see the forex candlestick guide.
Three Black Crows Candle Structure
Look at the three completed candles as a sequence, not merely three matching colors. The first bearish candle interrupts the preceding advance; the second and third extend the decline with lower closes. The third candle must finish before the entire formation can be assessed.
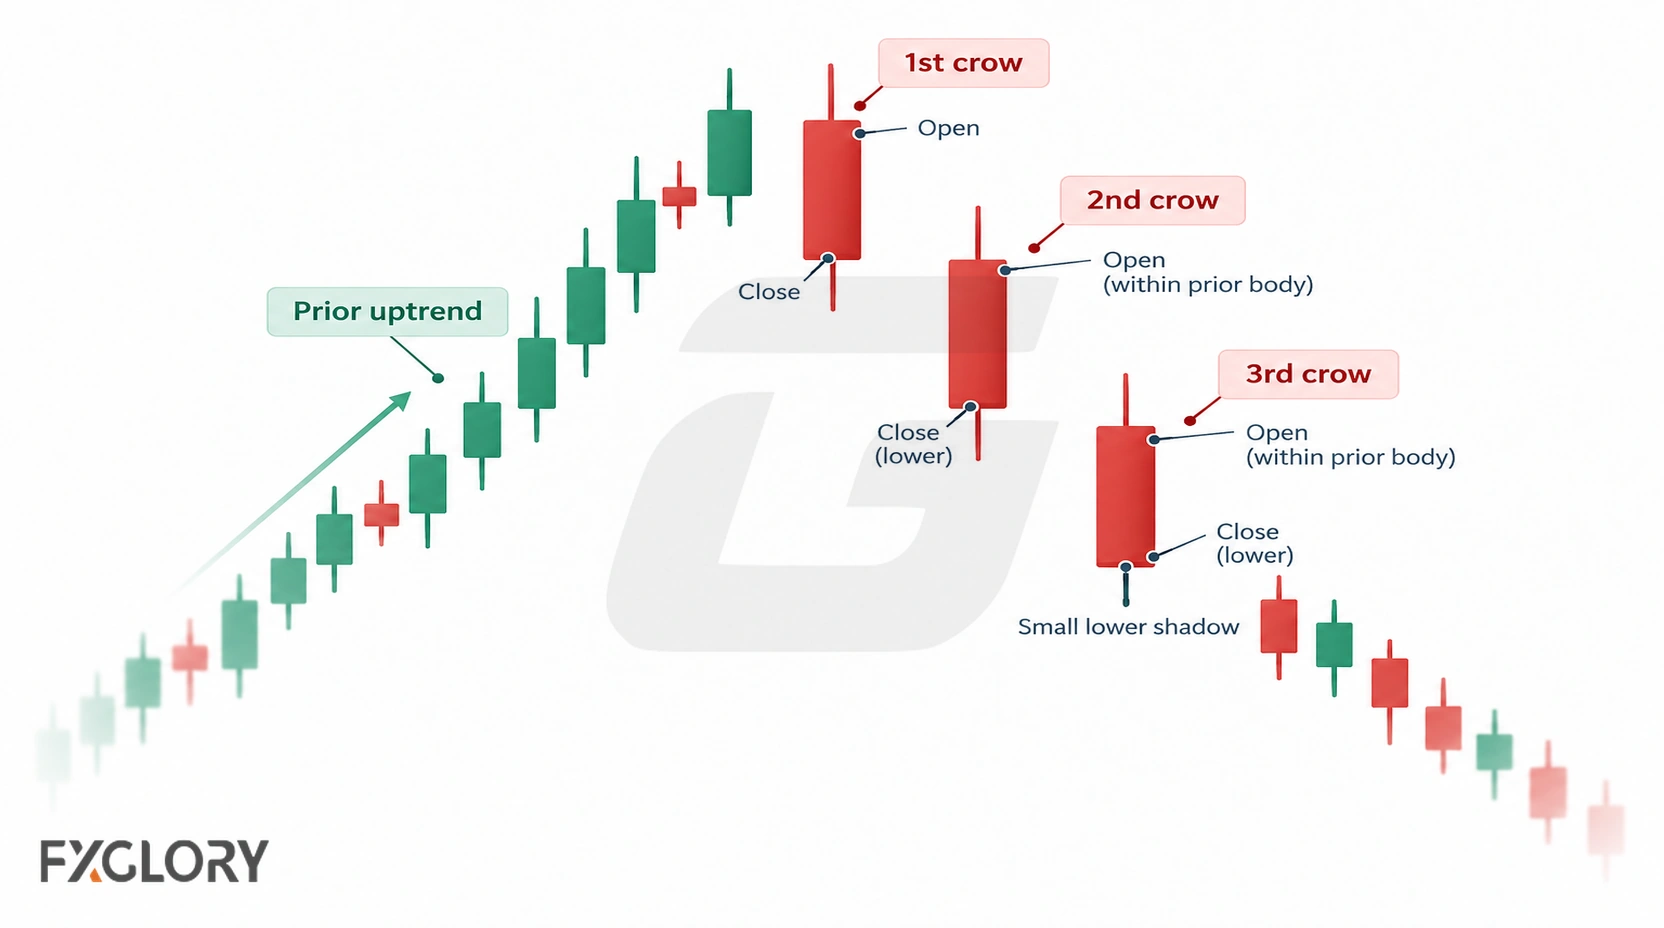
| Feature | What to look for | Interpretive value |
|---|---|---|
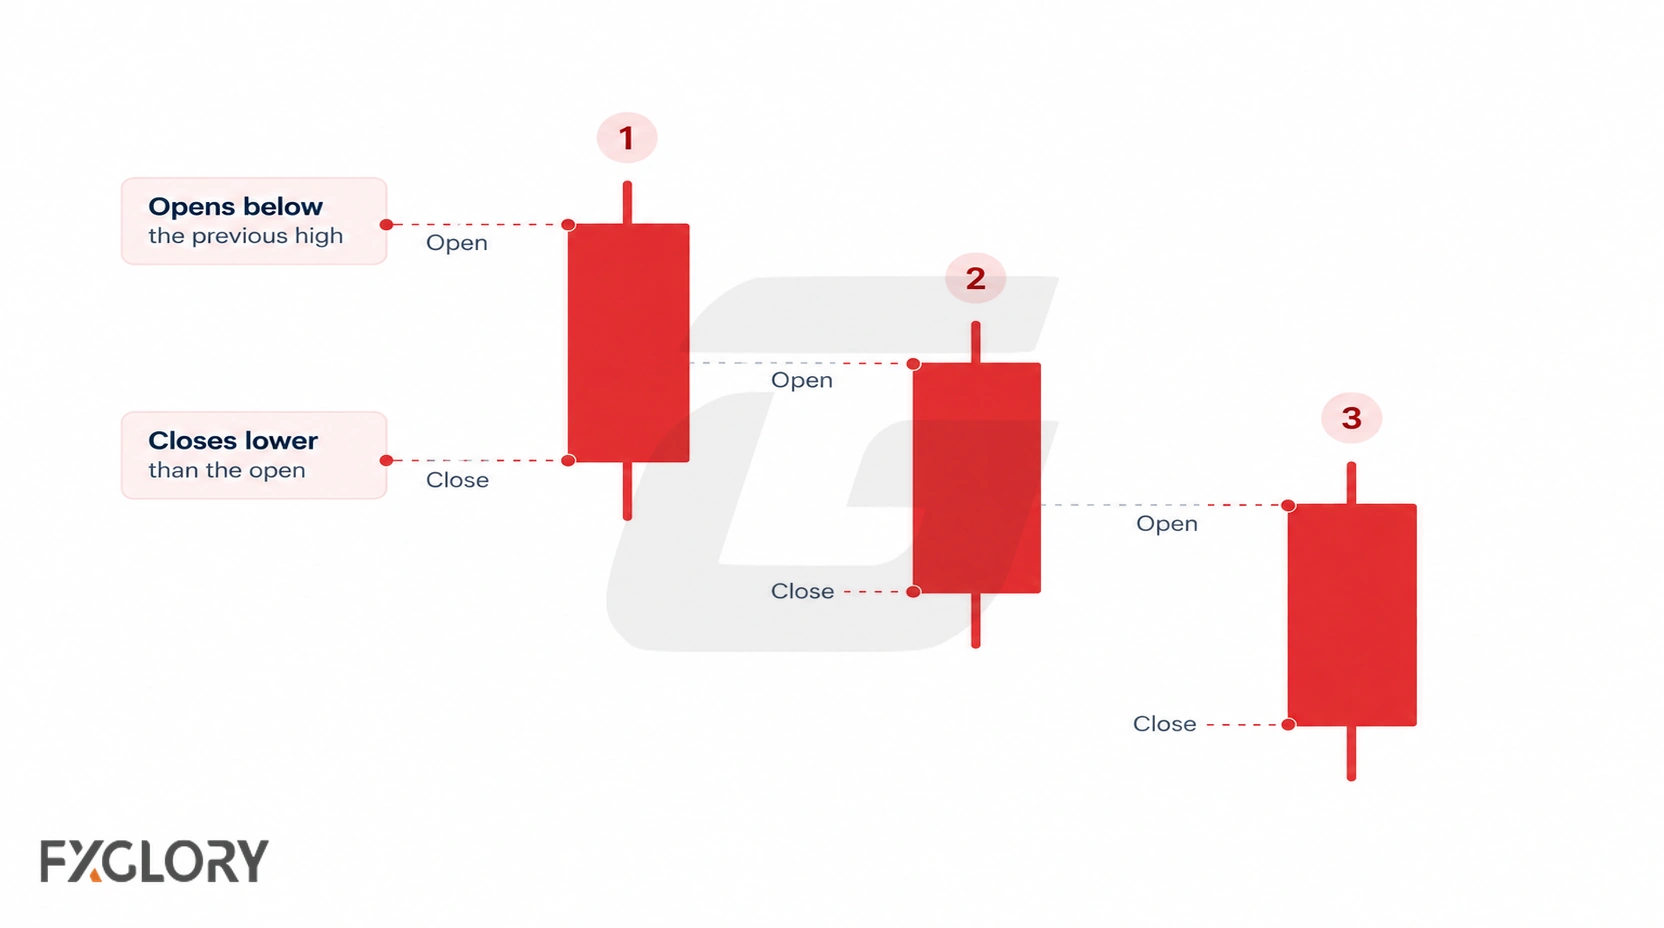
| Three real bodies | Three consecutive candles each close below their own open, with reasonably substantial bodies. | Shows downward movement in each candle period. |
| Progressive closes | Each candle closes below the previous close, preferably near its own low. | Shows continued downward progress across periods. |
| Later opens | The second and third candles commonly open within the previous real body. | Distinguishes the traditional formation from a disconnected sequence. |
| Lower shadows | Relatively short lower shadows. | Less rebound from each candle's low before its close. |
| Third candle | Its body and close retain meaningful downward progress. | Sharp body contraction or a long lower shadow makes the selling-pressure interpretation less clear. |
Some stricter descriptions prefer each new open to be below the prior open or near the middle of the preceding real body; others require closes below prior lows. Treat these as stricter quality filters, not universal requirements. Candle dimensions and apparent gaps depend partly on the selected market feed and timeframe.
Why Prior Buying Pressure Matters
The classic bearish-reversal reading depends on what happened before the candles: a rise, sustained buying pressure, or a test of higher prices. Three bearish candles inside an established downtrend may instead reflect continuation of selling, while similar candles in a sideways range may have no clear reversal implication.
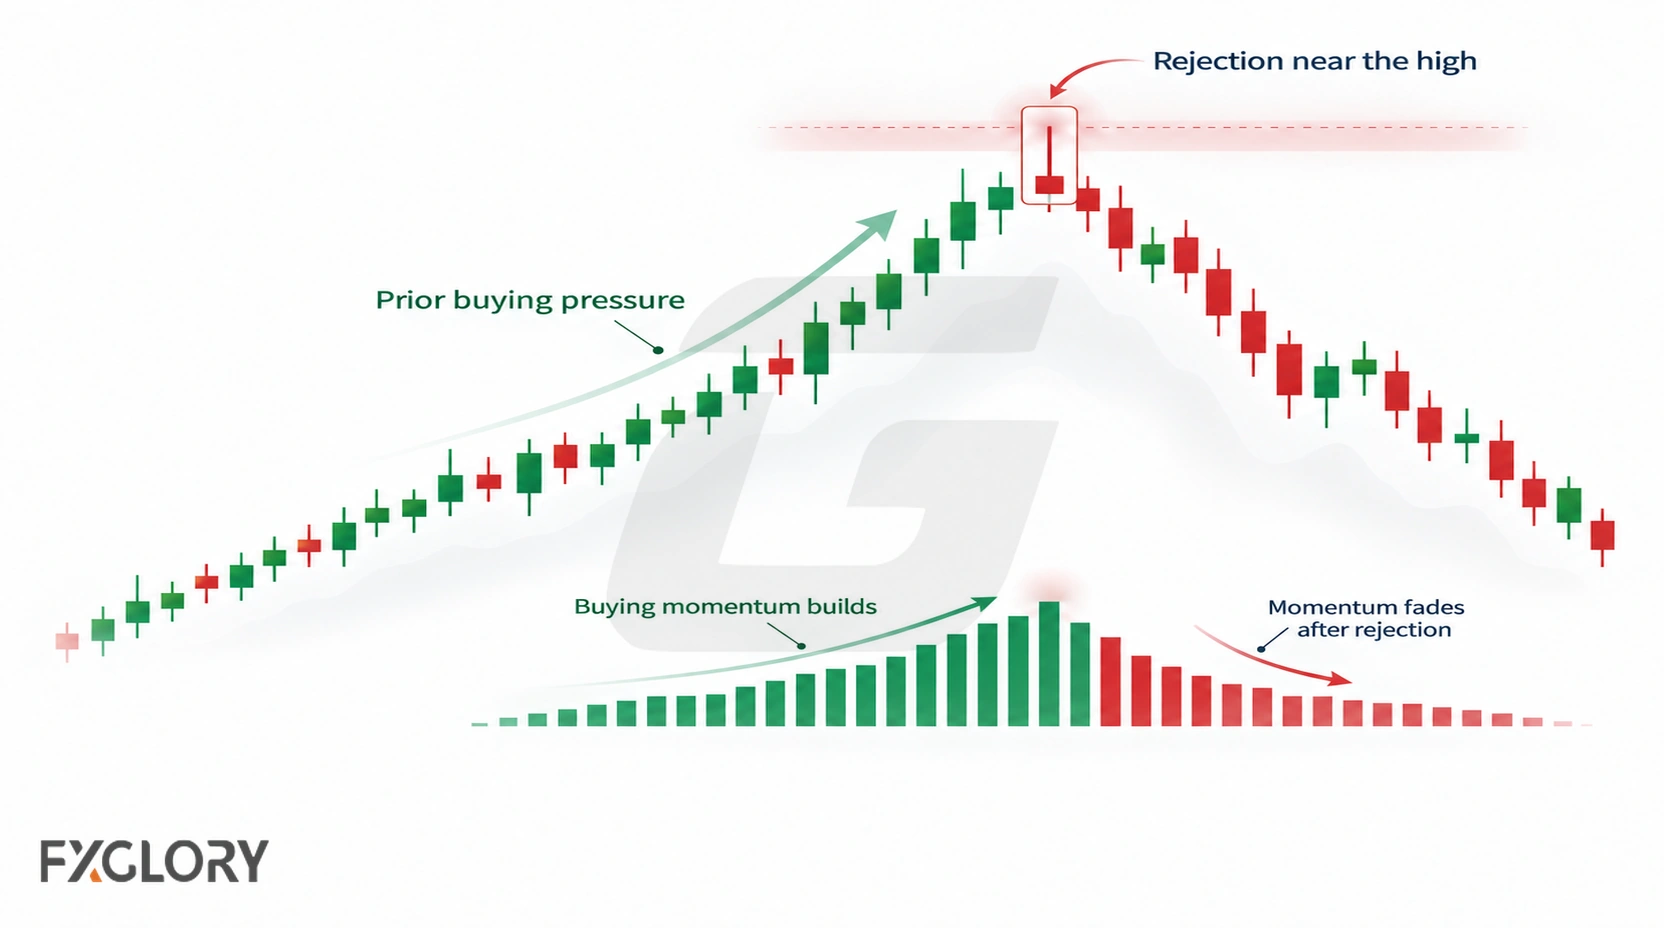
The formation is a description of completed price action, not proof that buyers have disappeared. The preceding movement determines whether a reversal interpretation is sensible.
Strong vs Weak Three Black Crows
A more coherent sequence has meaningful bodies, progressive lower closes, later opens connected to the previous bodies, and limited lower shadows. It is less convincing when the second or third body contracts sharply, repeated long lower shadows indicate intraperiod rebounds, or one candle is unusually large compared with recent ranges.
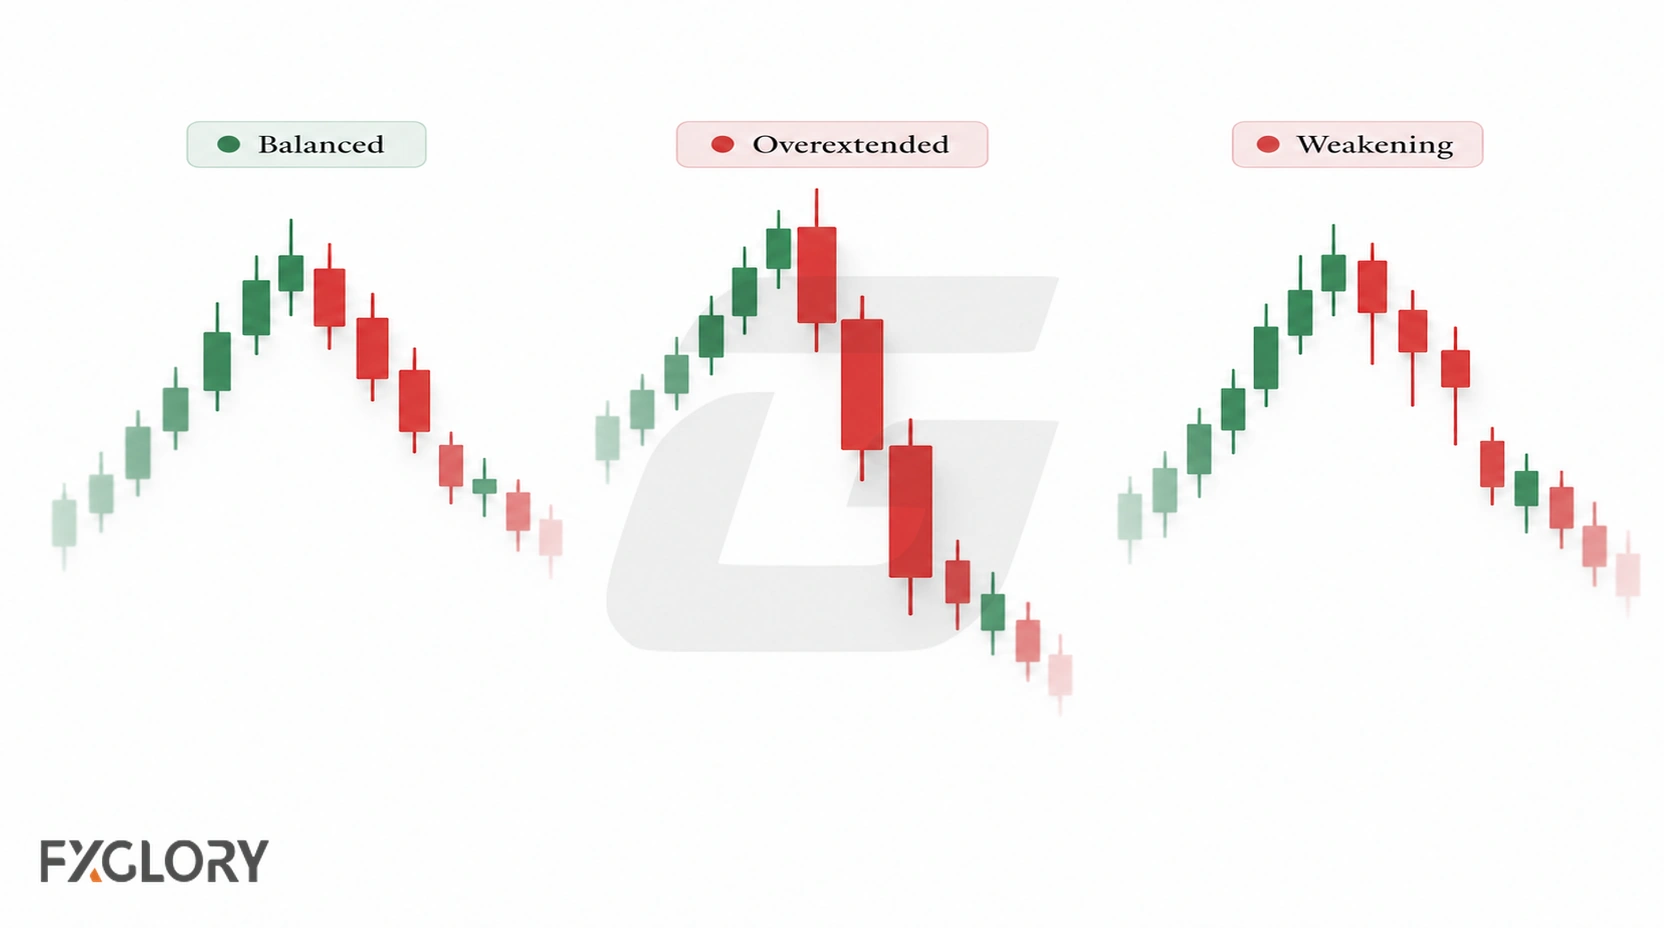
A substantial decline can also run directly into established support. That does not erase the historical formation, but the distance to support and the extent of the move matter when interpreting its possible aftermath. Compare body size and candle ranges with nearby price action rather than relying on a universal pip threshold.
Three Black Crows vs Similar Candlestick Patterns
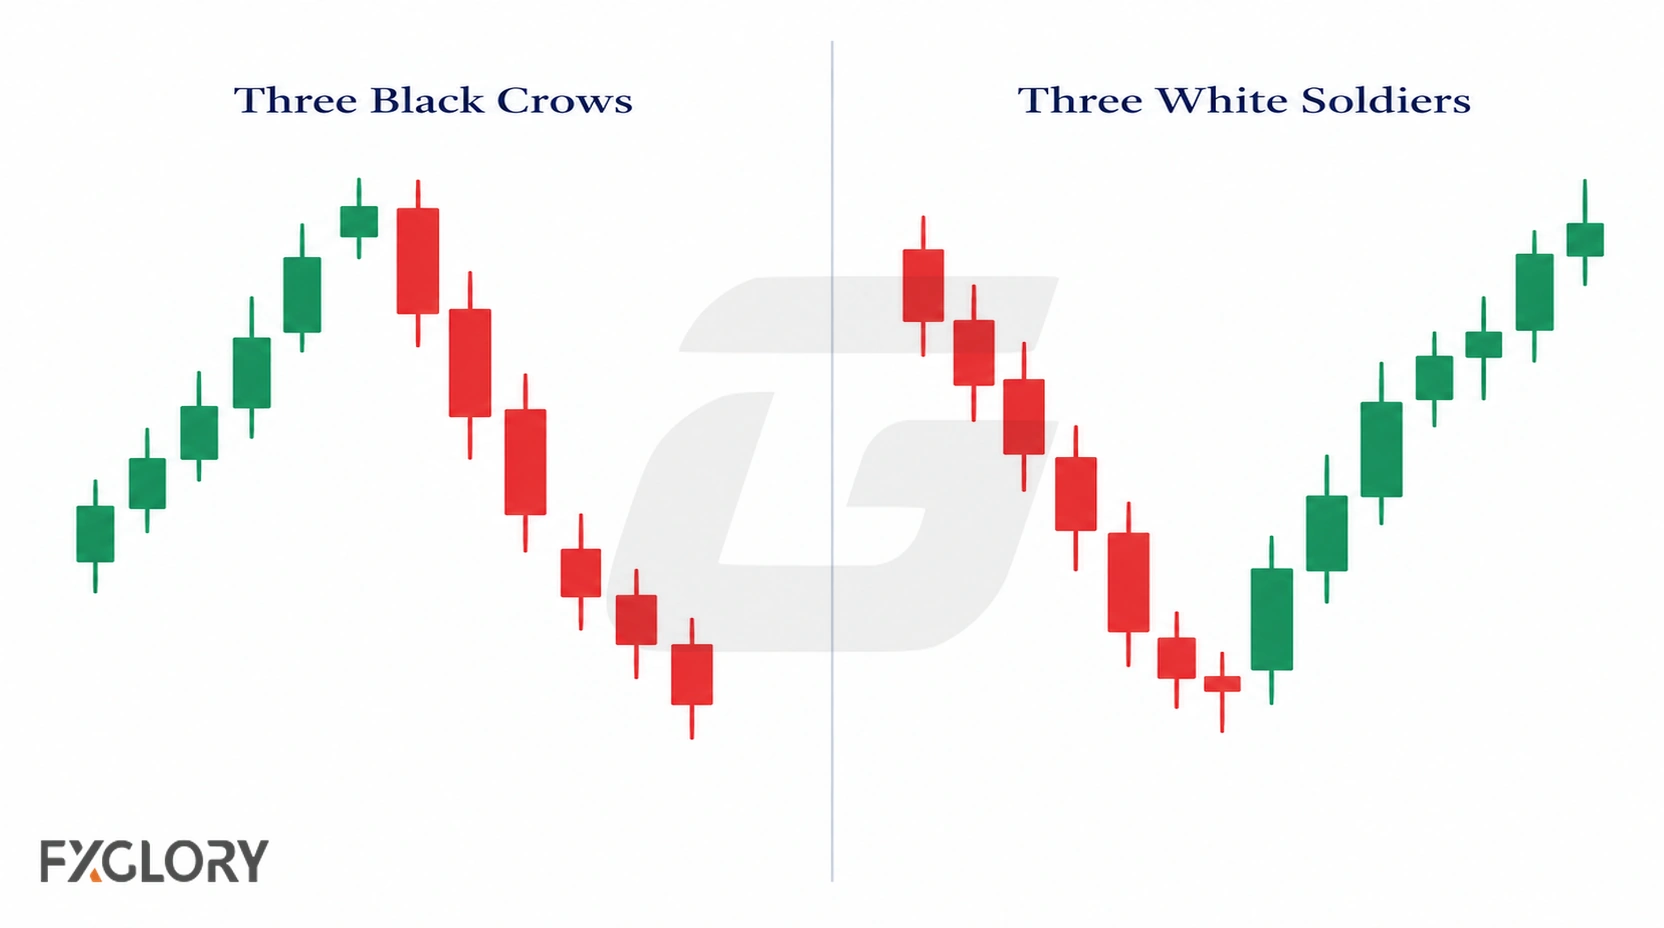
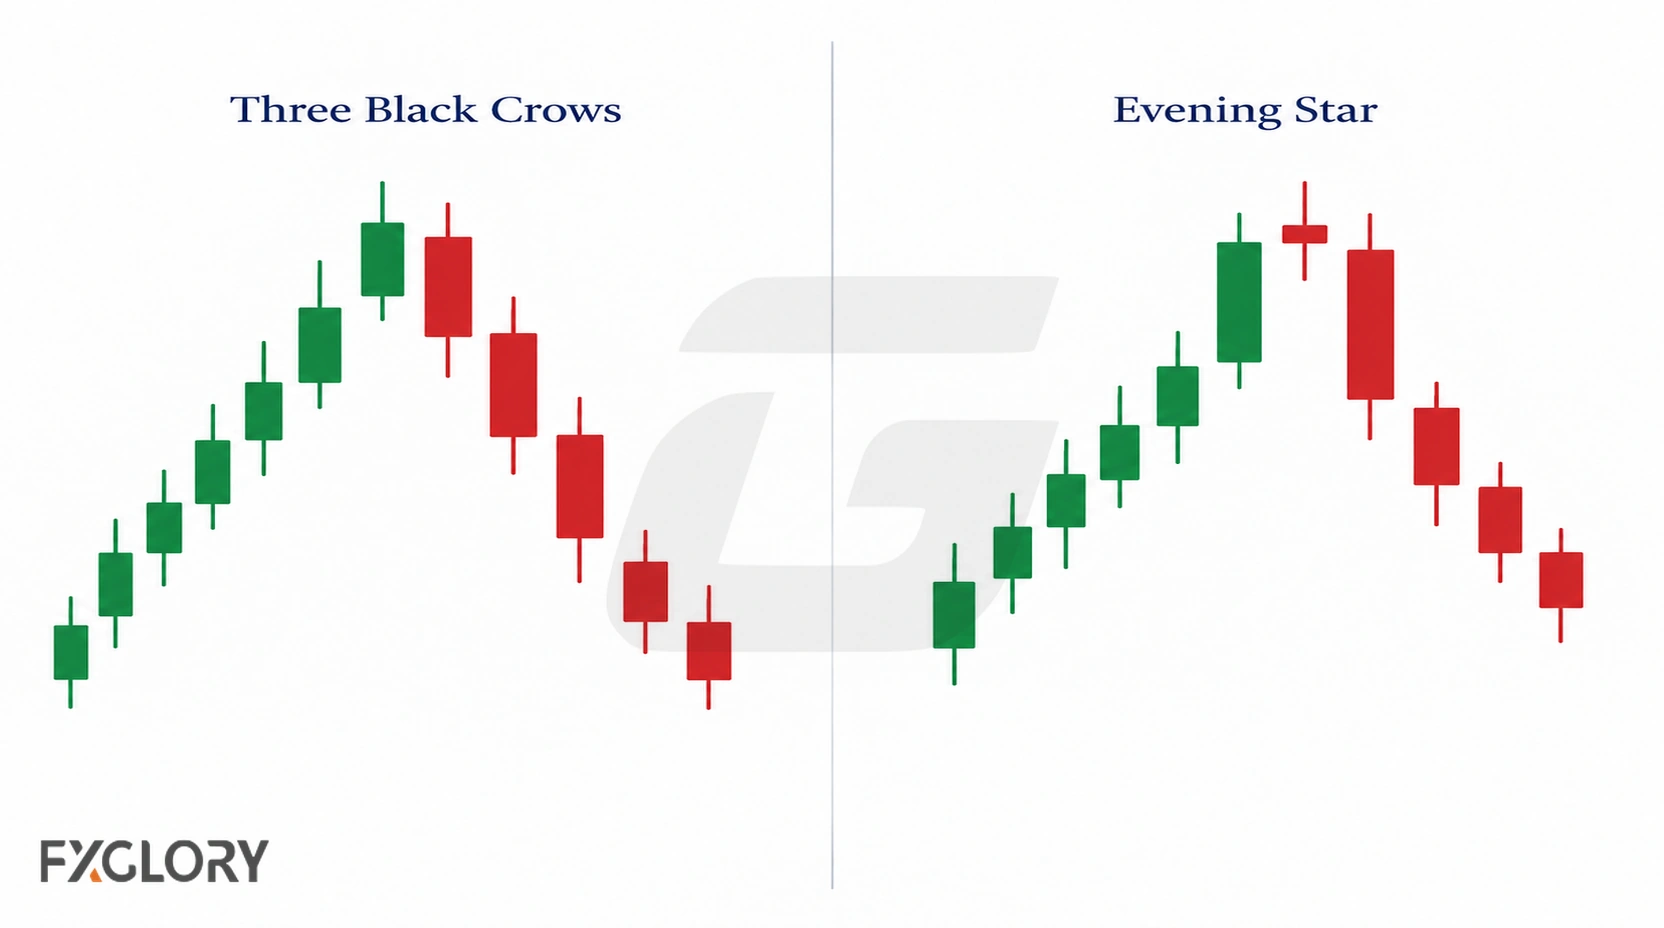
Three White Soldiers is the bullish counterpart: three progressively higher bullish closes, conventionally studied after selling pressure. Evening Star is a different bearish reversal formation with an initial bullish candle, a smaller middle candle and a bearish final candle.
| Pattern | Structure | Key distinction |
|---|---|---|
| Three Black Crows | Three consecutive bearish candles with descending closes. | Extended three-period bearish movement. |
| Three White Soldiers | Three consecutive bullish candles with ascending closes. | Opposite direction and traditional context. |
| Evening Star | Bullish candle, small middle candle, bearish final candle. | Includes hesitation rather than three bearish bodies. |
| Dark Cloud Cover | Two candles: bullish then bearish, with the second closing into the first body. | Two-candle partial bearish penetration. |
| Bearish Engulfing | A bearish real body engulfs the preceding bullish real body. | Two-candle body relationship. |
| Shooting Star / Hanging Man | Individual candles with characteristic upper / lower shadows. | One-candle formations. |
| Tweezer Top | Nearby candles test approximately the same high. | Focuses on repeated highs rather than three lower closes. |
| Falling Three Methods | Bearish continuation structure with a short intervening countertrend phase. | Continuation pattern, not three successive bearish candles. |
For fuller comparisons, see Three White Soldiers, Evening Star, Dark Cloud Cover and Bearish Engulfing.
Where Three Black Crows Matter on a Forex Chart
The same candles can carry different implications depending on their location. After a mature rally, near an established resistance area, or around a recent swing or range high, the formation can be examined as a possible response to prior buying. In the middle of a range, the sequence may describe a short decline without a clear reversal. Near support, a bounce may quickly challenge a bearish interpretation.
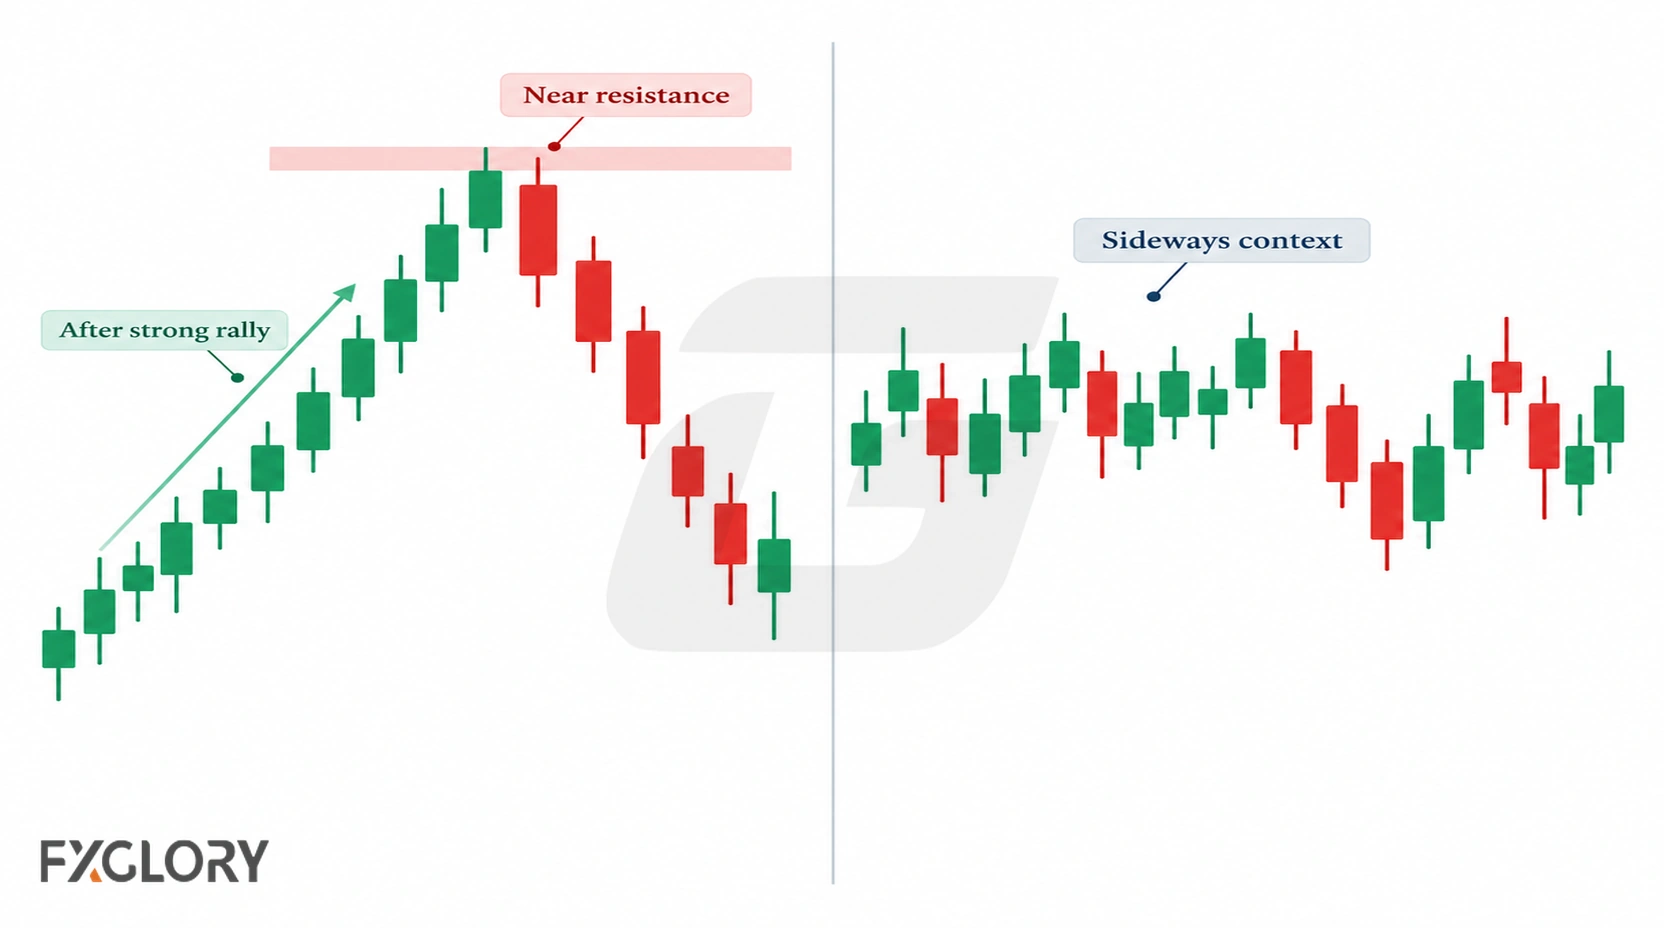
Quiet consolidation after an advance is another possible backdrop, provided the three-candle decline is assessed against the entire preceding move. A resistance level and a swing high may overlap, so there is no need to count them as separate confirmations. The relevant levels should be identifiable on the chart before interpreting subsequent price movement.
How to Identify and Evaluate the Pattern
- Identify completed candles: Select the timeframe and check that all three candles have closed, with bearish real bodies and progressively lower closes.
- Evaluate construction: Compare later openings, body sizes, close locations and lower shadows with the traditional anatomy above.
- Establish context: Determine whether the candles followed an advance, formed in a range, or continued an existing decline; note nearby resistance and support.
- Observe the aftermath separately: Further declining prices may support the bearish reading; a prompt rebound or break above relevant highs may contradict it. Neither outcome changes what the three completed candles looked like.
- Assess any proposed trade separately: An entry rule, invalidation condition, stop, size, and allowance for costs must be evaluated independently of pattern identification.
Indicators can provide additional—not decisive—context: RSI or MACD for momentum conditions, and ATR for recent price-range volatility. Spot-forex volume is typically broker- or platform-specific rather than a complete centralized market total.
Weak Patterns, Lookalikes, and Failed Reversals
Three distinct situations should not be grouped under the label “false pattern”:
- Incomplete candidate or lookalike: Only two candles have closed; the third reverses before its close; or successive closes and opening relationships do not meet the intended structural definition.
- Identifiable sequence with weak reversal context: The candles satisfy the chosen structural criteria but appear in an existing decline, the middle of a range, or after a highly extended selloff. Such circumstances weaken a reversal interpretation without changing the completed candles.
- Completed pattern without bearish follow-through: Price stabilizes at support or rebounds after the third candle. The prospective reversal may have failed even though the historical formation was identifiable.
Short timeframes can contain more frequent, small-range three-candle sequences; compare them with neighboring candle ranges and actual spread before drawing conclusions. Around major releases, rollover, or thin trading conditions, abnormal spreads and slippage can complicate a trade even if the candle pattern itself is clear.
Trading Considerations and Limitations
A Three Black Crows formation is not an entry order. Traders may choose different follow-through conditions—such as a close below an identified level or a later retest—and those conditions must be defined rather than described interchangeably as “confirmation.” A reversal hypothesis can weaken while a trade's selected stop remains untouched, or a trade can be stopped out without proving the original candle labeling wrong.
Stop placement should follow the strategy's invalidation logic. Position size then depends on the distance to the stop, the instrument's pip or contract value, and the predetermined amount of account capital at risk; transaction costs also affect the calculation. More volatility alone does not mechanically determine the stop distance or position size. For further detail, see forex risk management.
What to Study After Three Black Crows
To compare the bearish sequence with other formations, review the forex candlestick patterns guide, opposite bullish three-candle formation and three-candle pattern with a middle pause.