
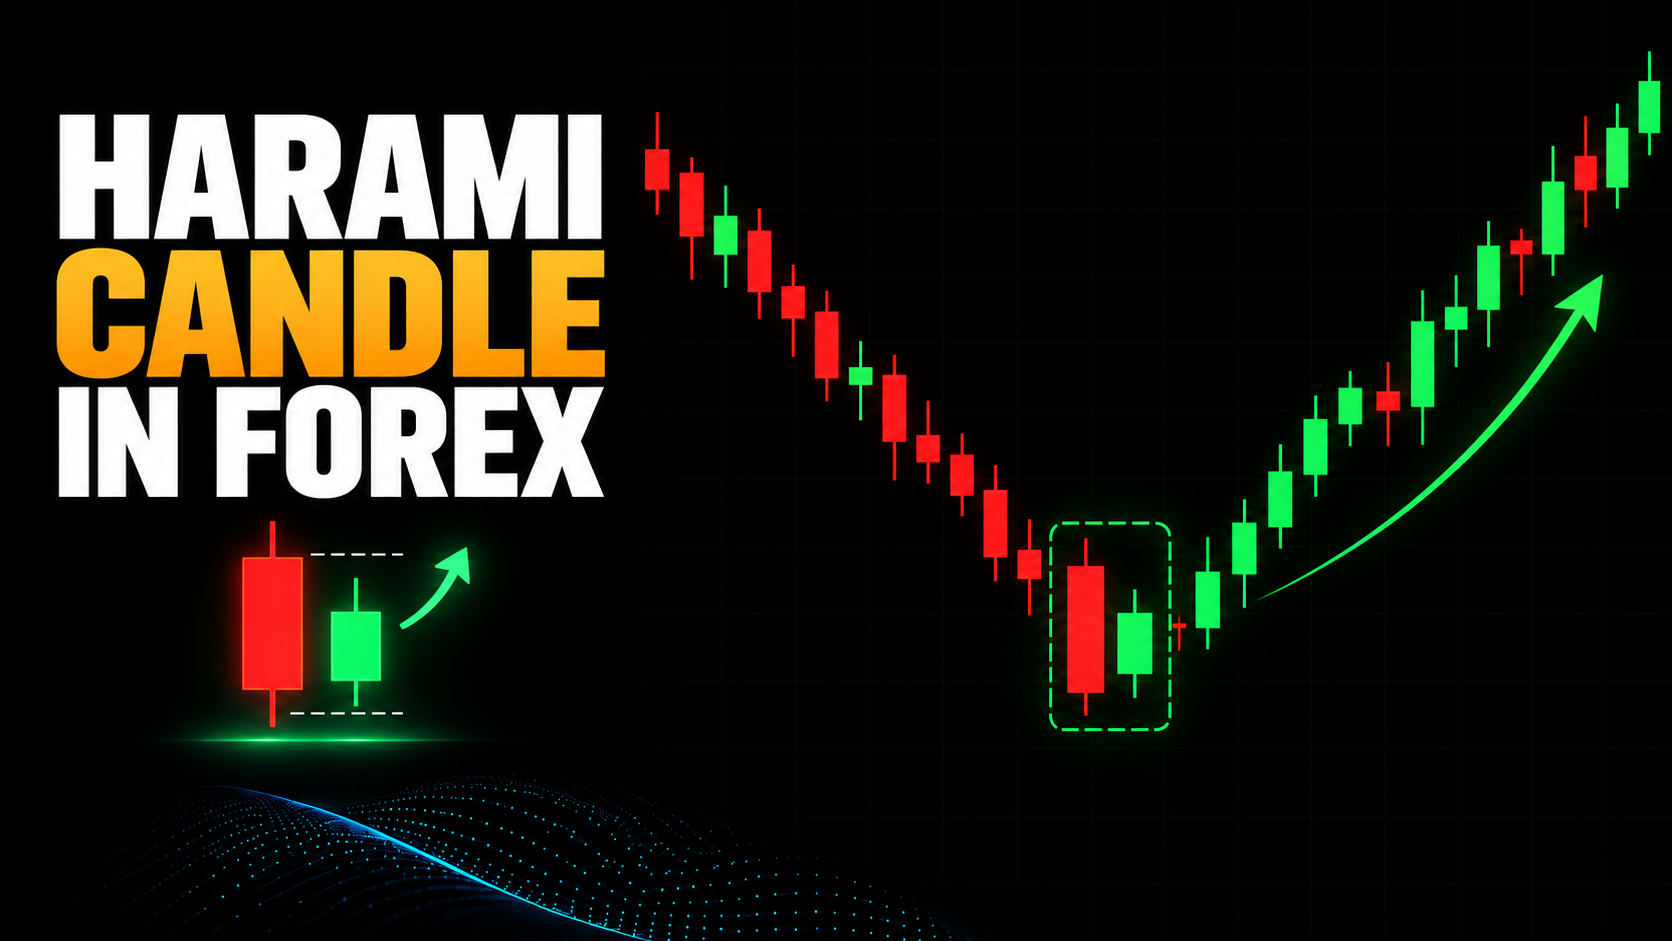
What Is A Harami Candle Forex Pattern?
A harami candle forex pattern is a two-candle formation where a large first candle is followed by a smaller second candle that forms inside the first candle's body. The first candle shows the earlier pressure. Its smaller real body records less net open-to-close movement than the preceding candle, without establishing that trading activity or the full high-low range declined.
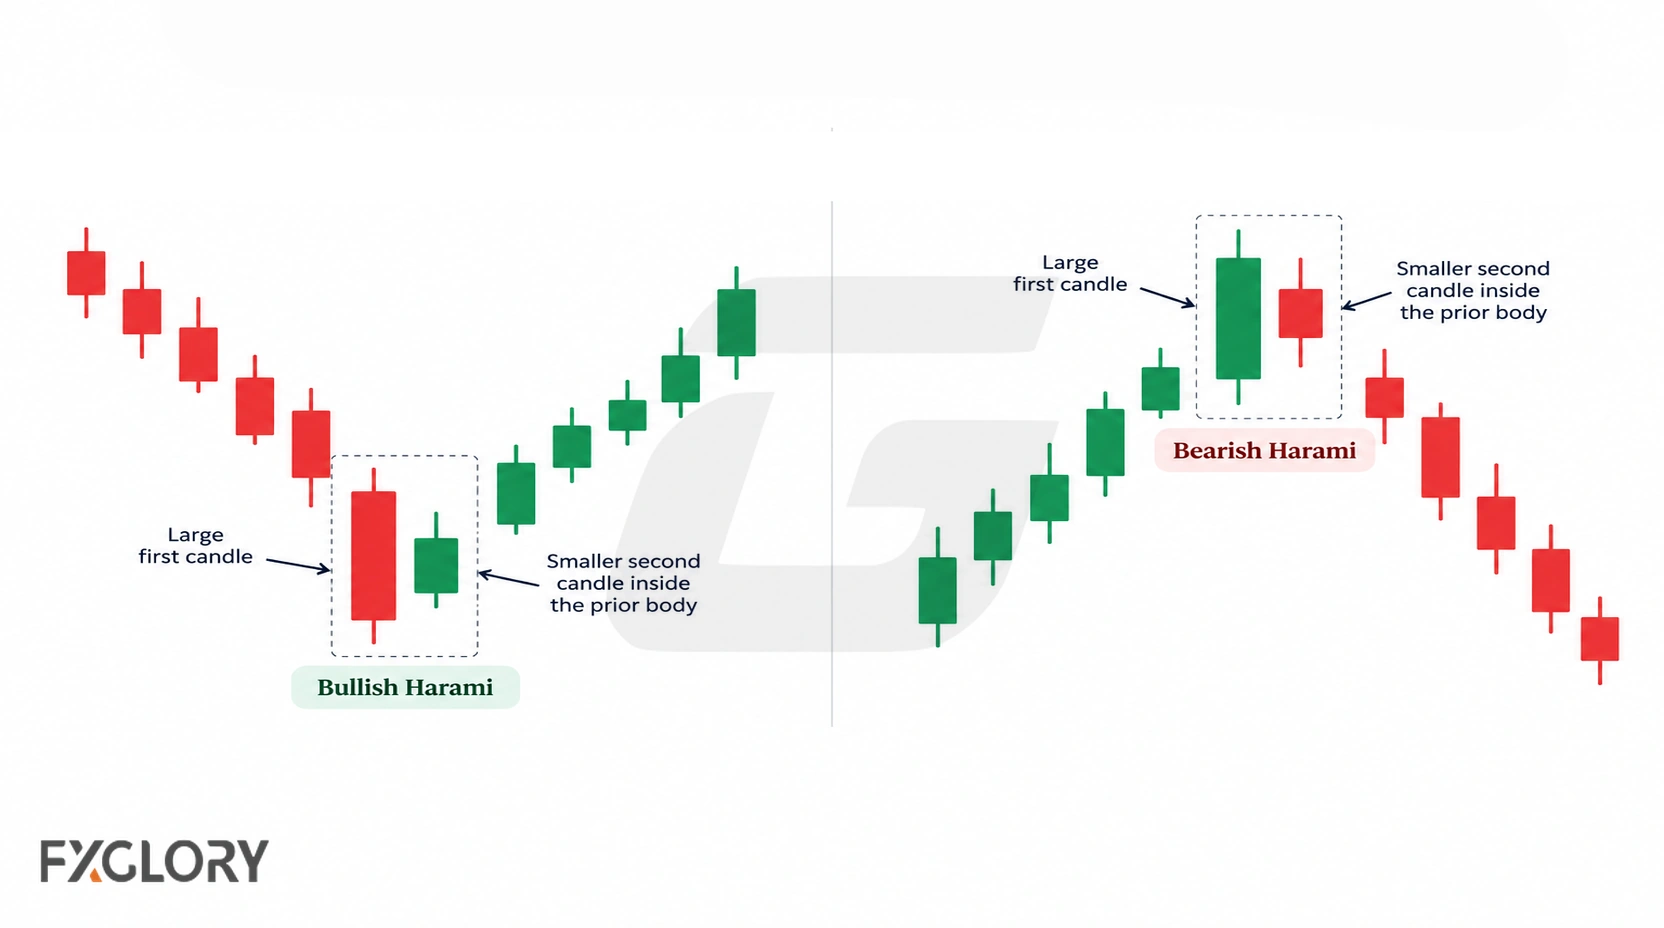
The word harami is often explained through a parent-child visual: the first candle is the larger candle, and the second candle is the smaller candle contained within it. Traders sometimes describe the first candle as the larger mother candle and the second as the smaller inside candle, but the useful part is still the body contraction.
A harami candlestick in forex should be judged by the two-candle relationship, the size of the first candle, the body position of the second candle, prior market pressure, chart location, and completed candle structure.
A harami does not confirm that price will reverse. It is a two-candle chart clue about pressure narrowing after a stronger candle. The useful question is whether the prior move, inside-body structure, chart location, and follow-up movement make the formation worth reviewing.
If you need the basic candle parts first, review the open, close, body, and wick relationship. A harami uses those same candle parts, but its message depends on how the second candle sits inside the body of the first candle.
Harami Pattern Anatomy
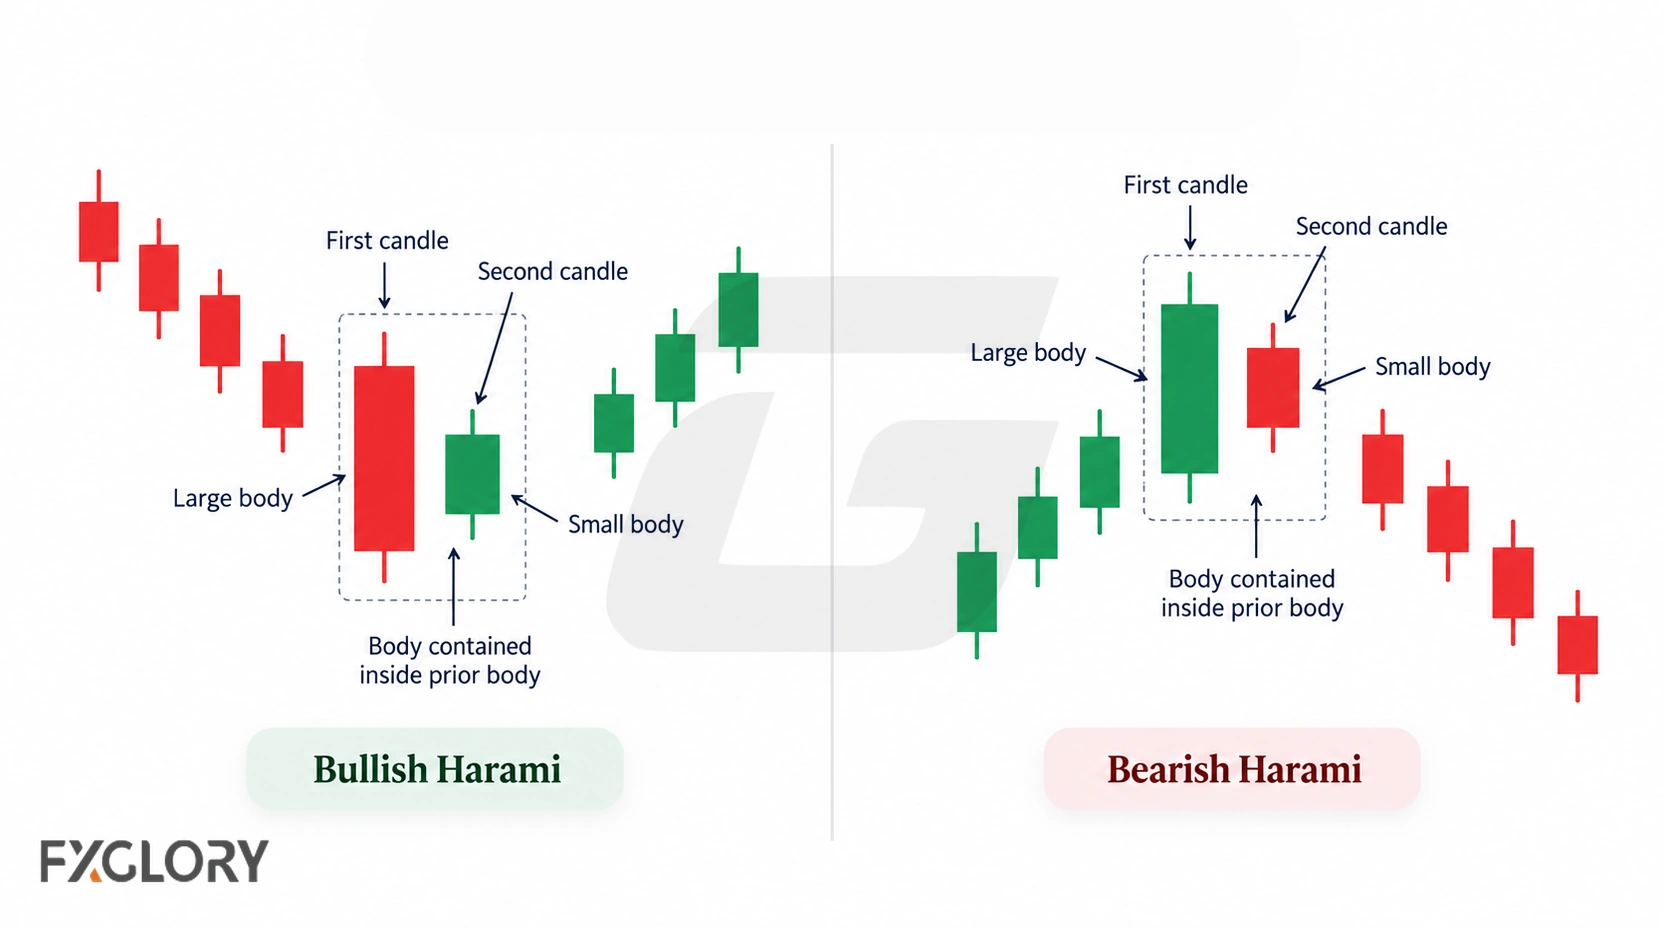
The anatomy of a harami pattern has two main parts: the larger first candle and the smaller second candle. The first body records a larger net open-to-close price change; the second records a smaller one within those boundaries. This relationship alone cannot identify the volume of buying or selling.
| Harami Part | Common Structure | What It Shows | Reading Caution |
|---|---|---|---|
| First candle | A larger bullish or bearish body. | The prior pressure was clear during that candle period. | If the first body is small, the contraction may be less meaningful. |
| Second candle | A smaller body contained inside the first candle's body. | The second candle had a smaller net open-to-close change; its high-low range need not be smaller. | If the second body is not clearly smaller, the structure is weak. |
| Body relationship | The second body sits within the open-close area of the first candle. | The pattern shows body contraction. | Wicks do not have to remain inside the first real body. |
| Prior context | Usually after buying pressure or selling pressure. | The harami has something to contract from. | Without prior pressure, it may be random candle overlap. |
| Completed candles | Both candles have closed. | The two-candle structure can be reviewed. | An unfinished second candle can change before the close. |
A clean harami usually has a first candle with a clear real body, followed by a second candle whose body opens and closes inside the first candle's real body. The second candle can be bullish, bearish, or nearly neutral. Its body shows a smaller net open-to-close move; the high-low range may still be wide.
Body Containment vs Full-Range Containment
The cleanest harami reading focuses on the body of the second candle forming inside the body of the first candle. This means the second candle's open-close area is contained within the first candle's open-close area.
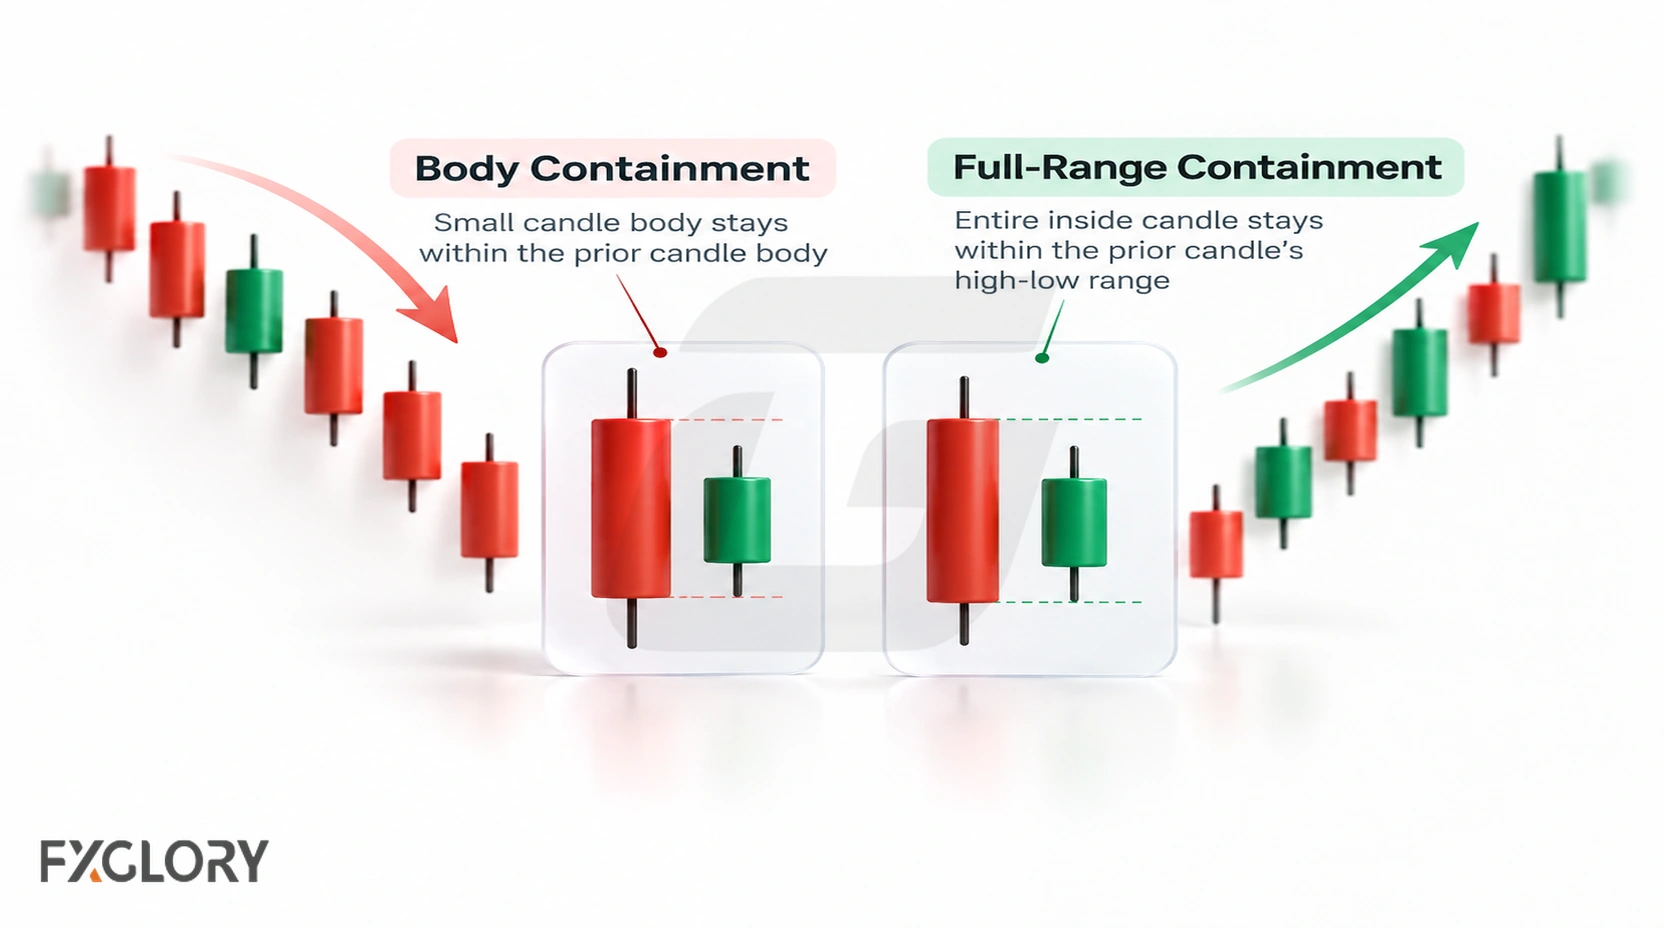
Some chart readers also compare the full high-low range, including the wicks. That can be useful for checking how clean the formation looks, but it is not the same as the main body-based harami idea. Wicks extending beyond the first candle's real body do not invalidate a body-defined harami. Wicks that extend beyond the first candle's entire high-low range indicate a different full-range relationship and may make the price action more volatile or complex, without undoing the body containment.
This differs from the inside bar pattern, which focuses on containment within the previous candle's high-low range. Some stock-focused examples may show gaps around the second candle. In forex chart reading, the cleaner focus is the body relationship on the selected timeframe: a larger first body, a smaller second body inside it, prior pressure, and chart location.
| Containment Type | What To Review | Cleaner Reading | Weaker Reading |
|---|---|---|---|
| Body containment | Second candle body inside first candle body. | The smaller body is clearly inside the larger body. | The second body overlaps or extends outside the first body. |
| Wick containment | Second candle high-low range compared with first candle range. | The entire second high-low range stays within the first high-low range. | The second range extends beyond the first; this does not invalidate body containment. |
| Close location | Where the second candle closes inside the first body. | The close stays contained and does not erase the contraction idea. | The close pushes strongly outside the first body. |
In forex, wick behavior can change during fast movement, rollover, low-liquidity periods, and news events. That is why the cleaner reading starts with the candle bodies and then reviews the wicks as a quality filter.
Bullish Harami In Forex
A bullish harami is usually reviewed after selling pressure, a decline, or a lower-price test. It commonly has a larger bearish first candle followed by a smaller second candle whose body forms inside the first candle's body.
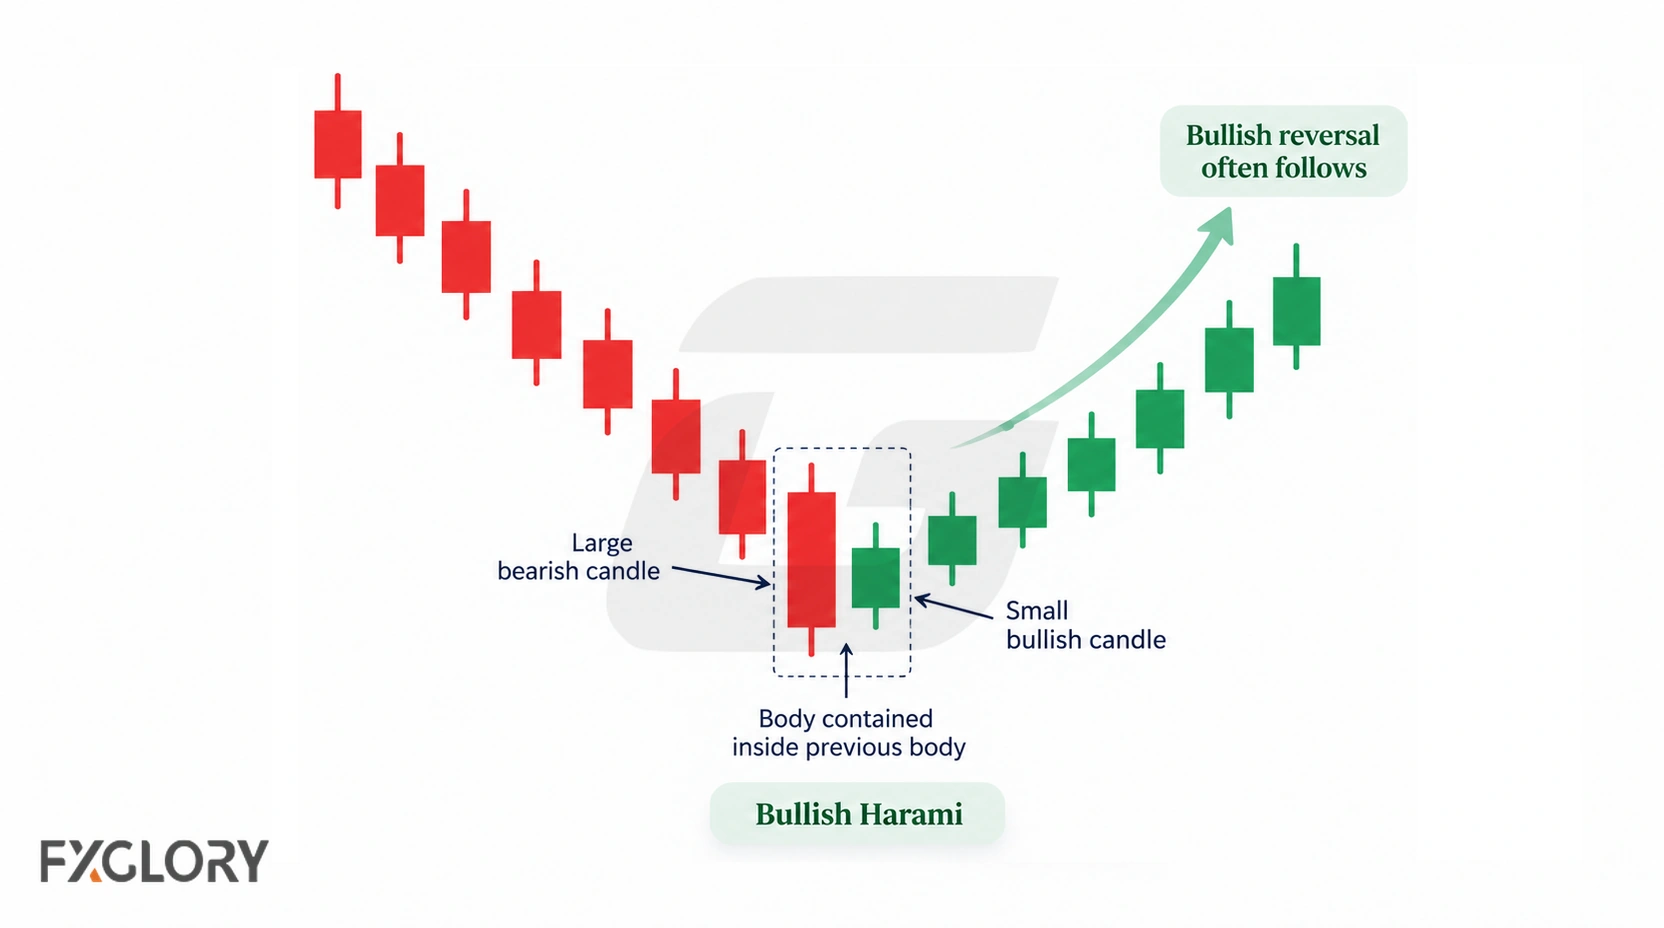
The larger bearish first body records a net decline. The smaller body in the next period records less net open-to-close movement, suggesting hesitation after that decline, not proof that buyers have gained control.
A bullish harami is a candidate for further review, particularly near support, a swing low, a range low, or after a clear lower-price test. Subsequent price action must be assessed separately.
| Bullish Harami Part | Common Structure | What It May Show |
|---|---|---|
| Prior movement | Selling pressure or decline. | The market had a prior downward push to pause from. |
| First candle | Larger bearish candle. | Sellers were visible in the first candle. |
| Second candle | Smaller candle inside the first body. | Selling pressure narrowed during the next candle period. |
| Chart location | Support, swing low, or range low. | The contraction has a clearer place on the chart. |
The second candle in a bullish harami can close bullish or bearish. The more important question is whether its body is clearly smaller and contained inside the first candle's body.
Bearish Harami In Forex
A bearish harami is usually reviewed after buying pressure, a rise, or a higher-price test. It commonly has a larger bullish first candle followed by a smaller second candle whose body forms inside the first candle's body.
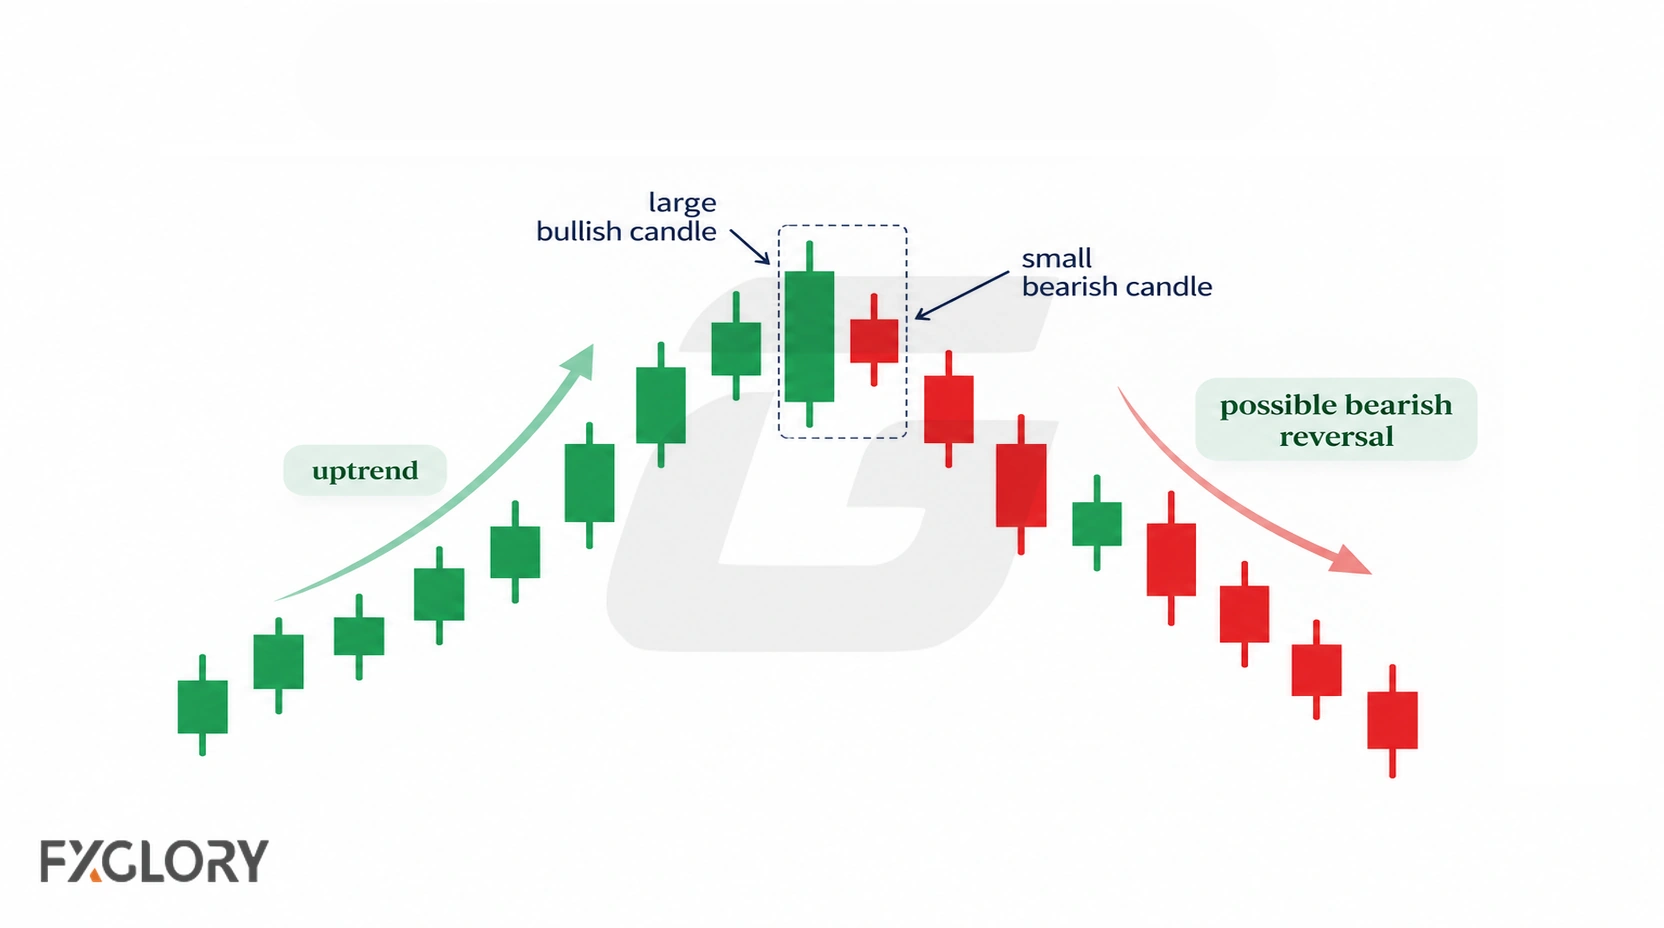
The larger bullish first body records a net rise. The smaller body in the next period records less net open-to-close movement, suggesting hesitation after that advance, not proof that sellers have gained control.
A bearish harami is a candidate for further review, particularly near resistance, a swing high, a range high, or after a clear higher-price test. Subsequent price action must be assessed separately.
| Bearish Harami Part | Common Structure | What It May Show |
|---|---|---|
| Prior movement | Buying pressure or rise. | The market had a prior upward push to pause from. |
| First candle | Larger bullish candle. | Buyers were visible in the first candle. |
| Second candle | Smaller candle inside the first body. | Buying pressure narrowed during the next candle period. |
| Chart location | Resistance, swing high, or range high. | The contraction has a clearer place on the chart. |
The second candle in a bearish harami can close bullish or bearish. The body relationship and chart location usually matter more than the color of the smaller candle alone.
Harami Cross In Forex
A harami cross is a harami variation where the second candle is a doji. The first candle is still the larger candle. The second candle still forms inside the first candle's body, but its open and close are equal or almost equal.
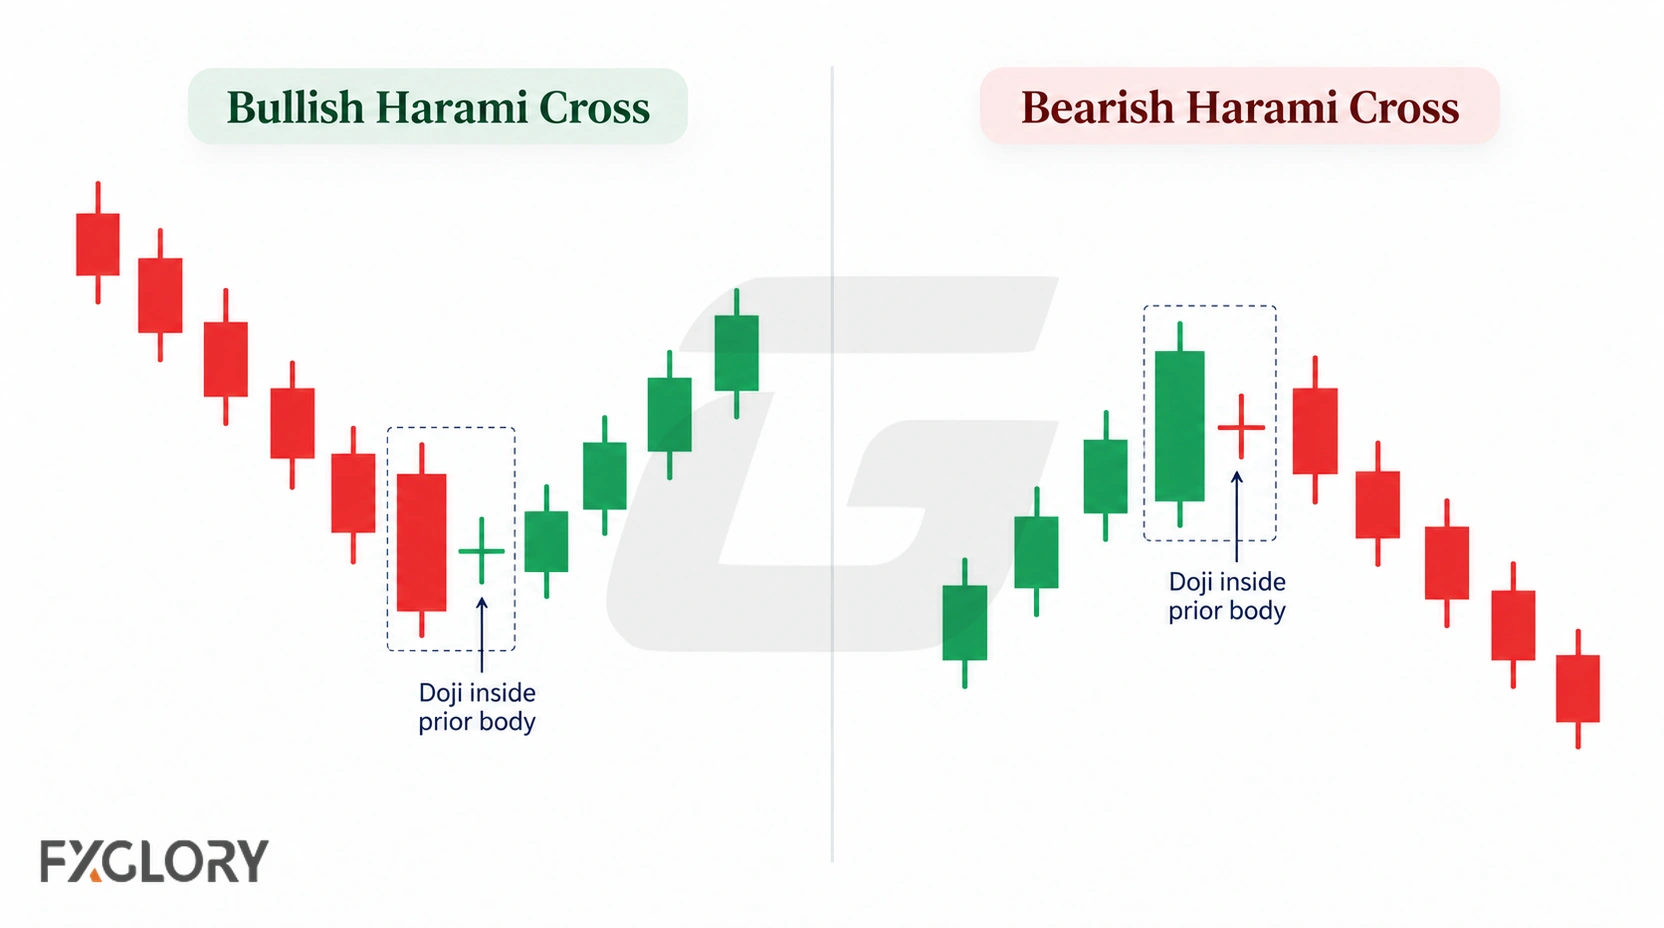
The doji second candle can show stronger open-close balance during the pause. This makes the contraction easier to notice, but it does not turn the formation into a complete trading reason. The harami cross still needs prior pressure, useful chart location, stable market conditions, and follow-up movement.
| Pattern | Second Candle | Main Difference | Reading Caution |
|---|---|---|---|
| Harami | Small-bodied candle inside the first body. | Shows contraction after the first candle. | The second candle should be clearly smaller. |
| Harami cross | Doji inside the first body. | Shows open-close balance inside the first candle's body. | The doji is not enough without the full two-candle structure. |
For deeper doji structure, use the open-close balance candle guide. A doji can be the second candle in a harami cross, but a doji alone is not the full harami pattern.
Harami vs Engulfing In Forex
Harami and engulfing patterns are both two-candle formations, but they describe opposite body relationships.
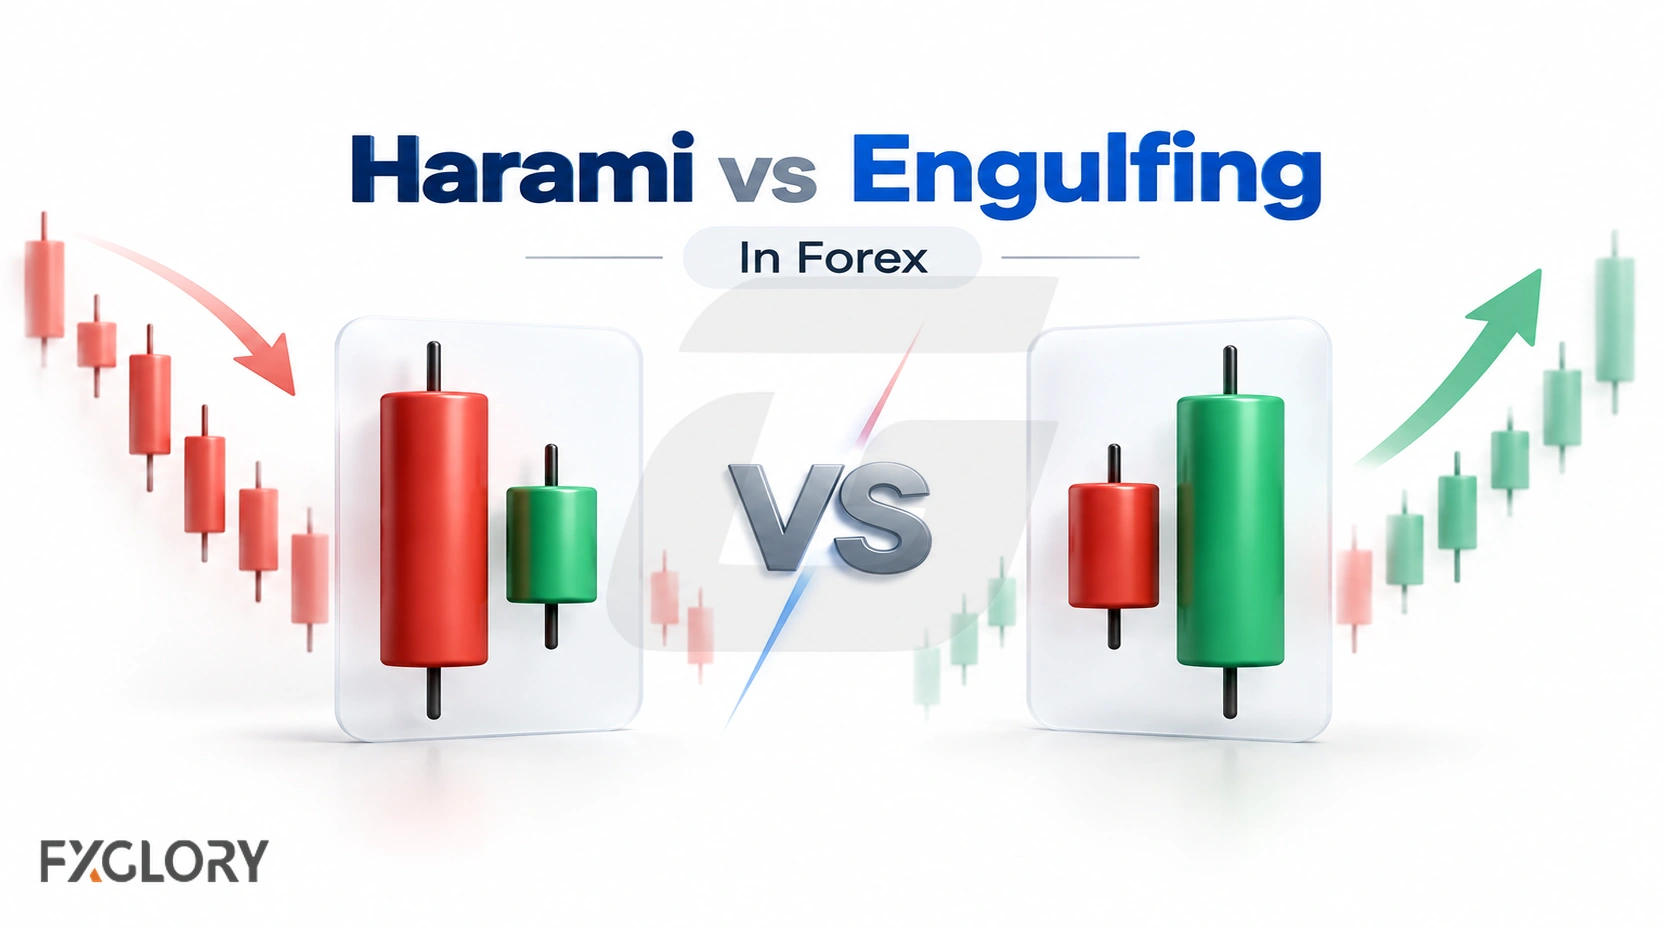
A harami is a contraction pattern. The second candle is smaller and forms inside the first candle's body. An engulfing pattern is an expansion pattern. The second candle's body covers the previous candle's body.
| Pattern | Body Relationship | Common Message | Main Difference |
|---|---|---|---|
| Harami | Second body sits inside the first body. | Previous pressure paused or narrowed. | Contraction after a larger candle. |
| Engulfing | Second body covers the first body. | Visible pressure shift during the second candle. | Expansion beyond the previous body. |
For the opposite two-candle body relationship, use the engulfing candle guide. The difference is important because a harami narrows inside the prior candle, while an engulfing pattern expands beyond it.
Harami vs Similar Forex Patterns
A harami can overlap visually with several candle ideas. Comparing them helps avoid forcing the wrong label onto the chart.
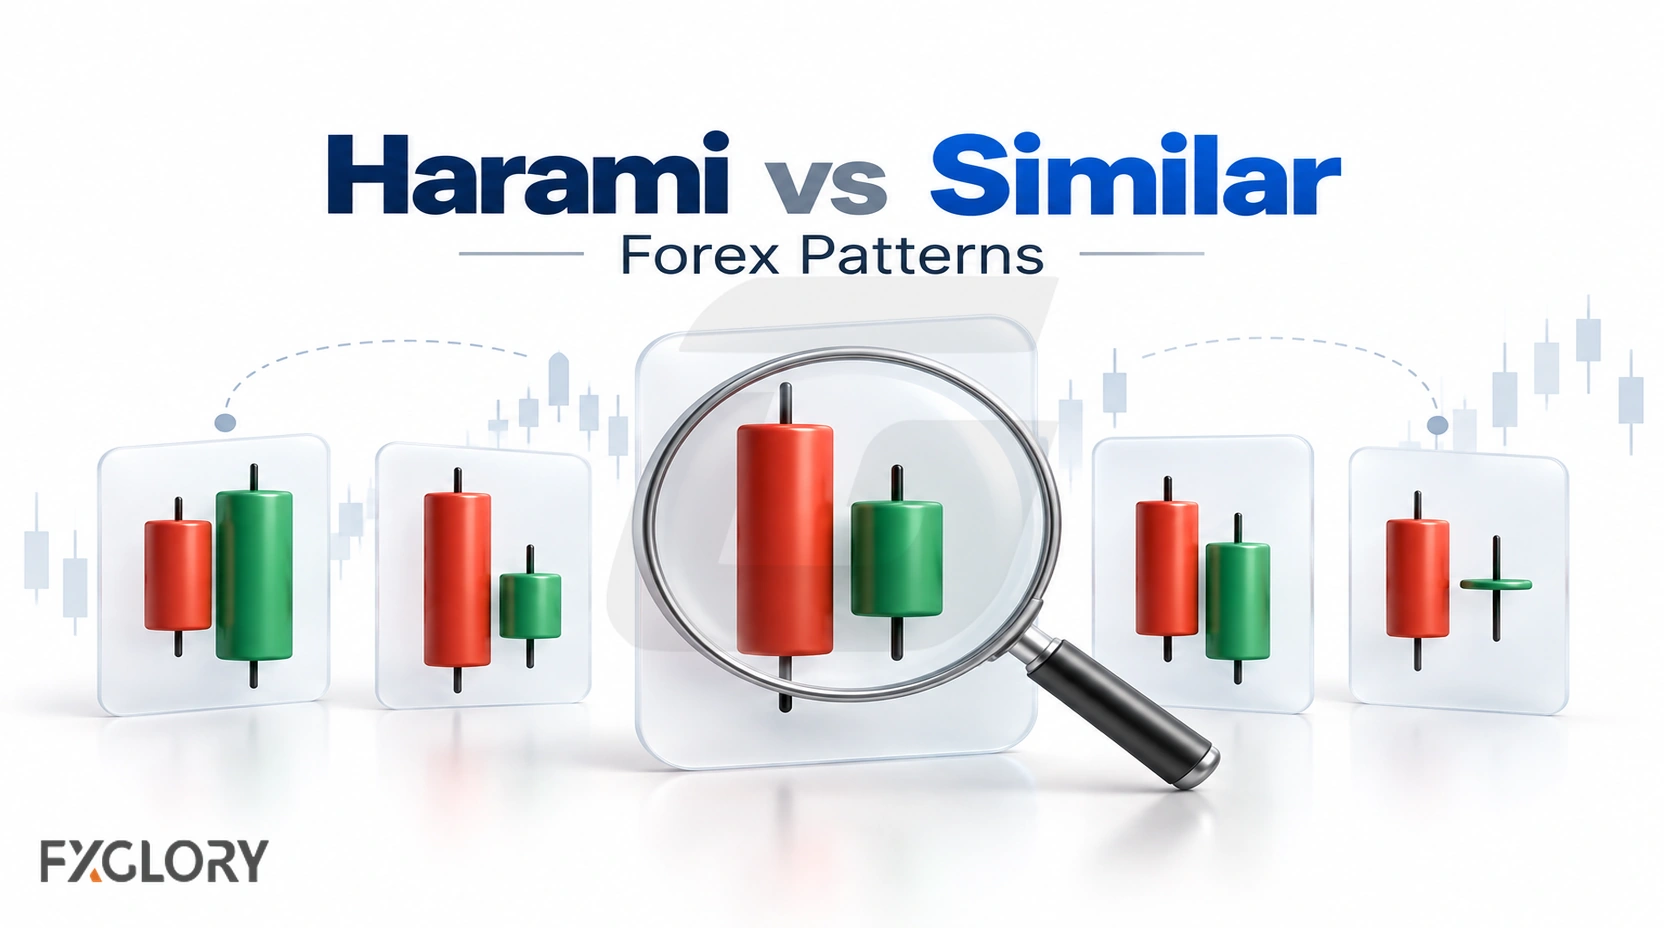
| Pattern Or Candle | Main Structure | Main Difference From Harami |
|---|---|---|
| Inside bar | Second candle range often sits inside the previous candle's high-low range. | Inside bar focuses more on full range, while harami focuses on body containment. |
| Doji | Open and close are equal or almost equal. | A doji can form a harami cross, but it is not the full pattern by itself. |
| Spinning top | Small visible body with upper and lower wicks. | A spinning top can be the second candle, but the two-candle body relationship still matters. |
| Morning star | Bearish candle, small middle candle, bullish third candle. | Morning star uses three candles, not two. |
| Evening star | Bullish candle, small middle candle, bearish third candle. | Evening star uses three candles, not two. |
A candle can look like an inside bar without being a clean harami if the body relationship is not clearly contained.
For broader context, return to forex candlestick pattern groups. For three-candle comparisons, review the morning star sequence and the evening star sequence.
Where Harami Patterns Matter More
A harami becomes easier to review when it appears in a place where contraction after pressure matters. Without a useful chart location, the formation may only be ordinary candle overlap.
After Selling Pressure
A bullish harami after a decline is more informative when it forms near a tested low rather than amid unrelated sideways candles.
After Buying Pressure
A bearish harami after an advance is more informative when it forms near a tested high rather than amid unrelated sideways candles.
Near Support
A bullish harami near support can be easier to review because the contraction appears around a lower-price area that already matters on the chart.
Near Resistance
A bearish harami near resistance can be easier to review because the contraction appears around a higher-price area that already matters on the chart.
Inside A Range
Harami-like structures can appear often inside sideways ranges. In that environment, one harami may not say much unless it forms near a range boundary or after a clear directional candle.
After A Large Candle
A harami after a large candle can show that the following candle period was more contained. This does not mean the first candle has failed; it only shows that the next candle did not continue with the same body expansion.
For observation, a trader can compare harami-like structures on live market pages such as GBP/USD around visible swing areas or gold during wider candle ranges. These pages are useful for chart review, not as standalone trading reasons.
Harami Strength Filter: Stronger vs Weaker Readings
A harami does not have the same value in every chart condition. The table below helps separate clearer two-candle contraction readings from weaker ones.
| Harami Factor | Clearer Reading | Weaker Reading |
|---|---|---|
| First candle | The first candle has a clear, larger real body. | The first candle is too small or unclear. |
| Second candle | The second body is meaningfully smaller than the first. | The second body is too large or barely contained. |
| Body containment | The second body sits inside the first body. | The second body overlaps or extends outside the first body. |
| Prior context | The pattern appears after buying pressure or selling pressure. | The pattern appears without clear prior movement. |
| Chart location | The pattern forms near support, resistance, a swing point, or a range boundary. | The pattern forms in the middle of random movement. |
| Market conditions | Spread and volatility conditions are stable enough for chart review. | The pattern forms during abnormal news movement, rollover, or thin liquidity. |
How To Read A Harami Candle Pattern In Forex
A simple workflow helps keep harami reading disciplined. The goal is to describe the two-candle relationship before giving the structure more meaning than it deserves.
- Check the timeframe: Decide whether the two-candle relationship reflects a short-term pause or a broader candle period.
- Review the prior move: Look for buying pressure, selling pressure, a rise, a decline, or a clear level test before the pattern.
- Read the first candle: Check whether it has a larger real body that shows visible prior pressure.
- Read the second candle: Confirm that the body is meaningfully smaller than the first candle's body.
- Check body containment: Review whether the second body sits inside the first body.
- Review the wicks: Note whether the second candle's full range extends beyond the first candle's high-low range, without confusing this with body containment.
- Check chart location: Look for support, resistance, swing points, range boundaries, or recent level tests.
- Review market conditions: Consider volatility, spread, liquidity, rollover, and scheduled news events.
- Watch follow-up movement: After the second candle closes, distinguish a completed harami from subsequent confirmation. For example, a trader may define a bullish confirmation as a later candle closing above the harami pair's high, or bearish confirmation as a later close below the pair's low. An intrabar break is not the same as a completed close; retests and follow-through are optional further evidence. None guarantees a reversal.
Some traders compare harami patterns with technical indicators for additional context. For example, RSI can add momentum context, MACD can add trend-momentum context, ATR can add volatility context, and Bollinger Bands can help review range and expansion conditions. These tools can support candle review, but they do not remove trading risk.
Some traders also review activity or volume-style tools around the pattern, but spot forex volume is usually broker/platform-specific and should not be treated as a complete confirmation by itself.
Rule-based tools may identify harami patterns by comparing candle bodies, but the chart still needs review for location, volatility, liquidity, and whether the structure is meaningful or only random candle overlap.
Invalid Harami Candidates vs Failed Reversals
Not every apparent harami qualifies as a completed two-candle pattern. A second candle that has not closed, whose body extends beyond the first real body, or whose body is not meaningfully smaller may be an unconfirmed or structurally invalid candidate. A small contained candle in a choppy market can be structurally identifiable but offer little useful context.
A different situation arises when both completed candles form a valid harami but price subsequently continues in the prior direction. That is an unsuccessful reversal interpretation, not evidence that the original two-candle structure never existed. If a trader uses a defined subsequent closing breakout to confirm the setup, a later move against that setup should be evaluated under that trader's separate invalidation and risk rules.
News spikes and thin liquidity can create large intraperiod excursions; assess spreads, volatility, and trade execution separately from the candle's shape.
Common Mistakes With Harami Candles In Forex
A candle pattern and a trade plan answer different questions. Avoid assuming that a valid harami automatically predicts a reversal, that a doji by itself creates a harami cross, or that candle-body contraction implies a reduction in traded volume or the entire high-low range.
- Using color as a rule: The second body can be bullish or bearish; body containment and prior context matter more.
- Confusing pattern and confirmation: Two completed candles can form a harami even before any later directional trigger occurs.
- Replacing risk planning with candle confidence: Entry criteria, trade invalidation, stop placement, transaction costs, and position size require separate decisions. Position size depends on stop distance, pip or contract value, and the trader's preset risk limit.