

Parabolic SAR Forex Strategy In 60 Seconds
Parabolic SAR Strategy Overview And Mechanics
Parabolic Stop and Reverse can be assigned different jobs inside a strategy: entry trigger, direction confirmation, trailing stop, or exit. A complete system must define the remaining rules separately. FXGlory's Forex Indicator Strategies guide explains the difference between an indicator signal and a complete trading system.
Dots below price indicate the active bullish PSAR state, while dots above price indicate the bearish state. The indicator uses an acceleration factor that increases as price makes new trend extremes, up to a maximum value.
Next SAR = Current SAR + Acceleration Factor × (Extreme Point − Current SAR)
The two main parameters are Step, which controls how quickly the acceleration factor increases, and Maximum, which caps that acceleration.
| Settings | Trades | Average hold | Three-bar whipsaw rate |
|---|---|---|---|
| 0.01 / 0.10 | 55 | 19.40 bars | 7.27% |
| 0.02 / 0.20 | 132 | 12.06 bars | 12.12% |
| 0.03 / 0.30 | 183 | 9.89 bars | 18.03% |
Faster settings produced more trades, shorter holding periods, and more short-lived losses. The 0.01 / 0.10 setting had the strongest complete-sample result in this sensitivity check, but it had only 55 trades and was not separately validated. It should not be treated as a recommended setting.
First Dot, Three-Dot Confirmation, And Stop-And-Reverse
The test entered after the first completed side change. A bullish setup ended with PSAR below price; a bearish setup ended with PSAR above price. The order entered at the next daily open.
Waiting for two or three completed dots is a different rule. It delays entry, changes the initial stop, removes some early reversals, and can miss part of a fast move. This article publishes no three-dot performance figure because that version was not tested.
The original stop-and-reverse concept can remain continuously long or short, reversing when PSAR changes side. This tested model could remain flat because SMA50 and ADX filters were allowed to reject a flip.
Exact Tested Rules
| Component | Tested rule |
|---|---|
| Pairs | EURUSD, GBPUSD, USDJPY, AUDUSD, USDCAD, USDCHF |
| Timeframe | Daily |
| PSAR | 0.02 Step and 0.20 Maximum |
| Direction | Close and three-bar SMA50 slope aligned with the trade |
| Strength | ADX(14) at or above 25 |
| Entry | Next daily open after the completed flip |
| Initial stop | Exact setup-candle PSAR value |
| Primary exit | Completed-bar PSAR trailing stop, active from the following candle |
| Maximum hold | 120 daily bars |
| Overlap | One open trade per pair and model variant |
For a long, price had to close above a rising SMA50; for a short, below a falling SMA50. Read Forex Moving Average for SMA mechanics. ADX measured strength only; ADX Forex Indicator explains its interpretation.
- Reject an unconfirmed flip.
- Reject a long below a falling SMA50 or a short above a rising SMA50.
- Reject the combined model when ADX(14) is below 25.
- Reject an entry when the PSAR stop is on the wrong side of the next open.
- Do not add a second position in the same pair and model while one is active.
Ranges, ADX 25, And Economic News
What ADX 25 Did—and Did Not Do
The threshold of 25 was declared before the result review. ADX did not determine direction, +DI and -DI were not entry conditions, and ADX was not required to be rising. SMA50 position and slope determined direction; ADX only accepted or rejected the setup on strength.
How The Model Addressed Sideways Markets
The coded range controls were limited to SMA50 direction and ADX of at least 25. It did not calculate horizontal range width, count recent PSAR flips, or require a breakout from support or resistance.
| Range warning | Why it matters |
|---|---|
| Flat SMA50 | Direction is weak or changing slowly |
| Price repeatedly crossing SMA50 | The directional filter is unstable |
| Frequent PSAR side changes | The indicator is repeatedly catching price |
| Horizontal swing highs and lows | Price is rotating inside a boundary instead of extending |
| ADX below the tested threshold | The combined model rejects the setup |
Adding a swing-range, breakout, or flip-count filter would create a new strategy and require a new test.
Economic-Calendar Treatment
No economic-calendar blackout was used. Central-bank decisions, inflation releases, employment reports, and other scheduled announcements remained in the historical sample. A trader who adds a news exclusion would be testing a different strategy. FXGlory's Economic Calendar Forex Strategy covers event timing as a separate strategy component.
Metrics And Position Size
| Metric | Meaning |
|---|---|
| 1R | The initial entry-to-stop risk before costs |
| Expectancy | Average net R gained or lost per trade |
| Profit factor | Gross winning R divided by absolute gross losing R |
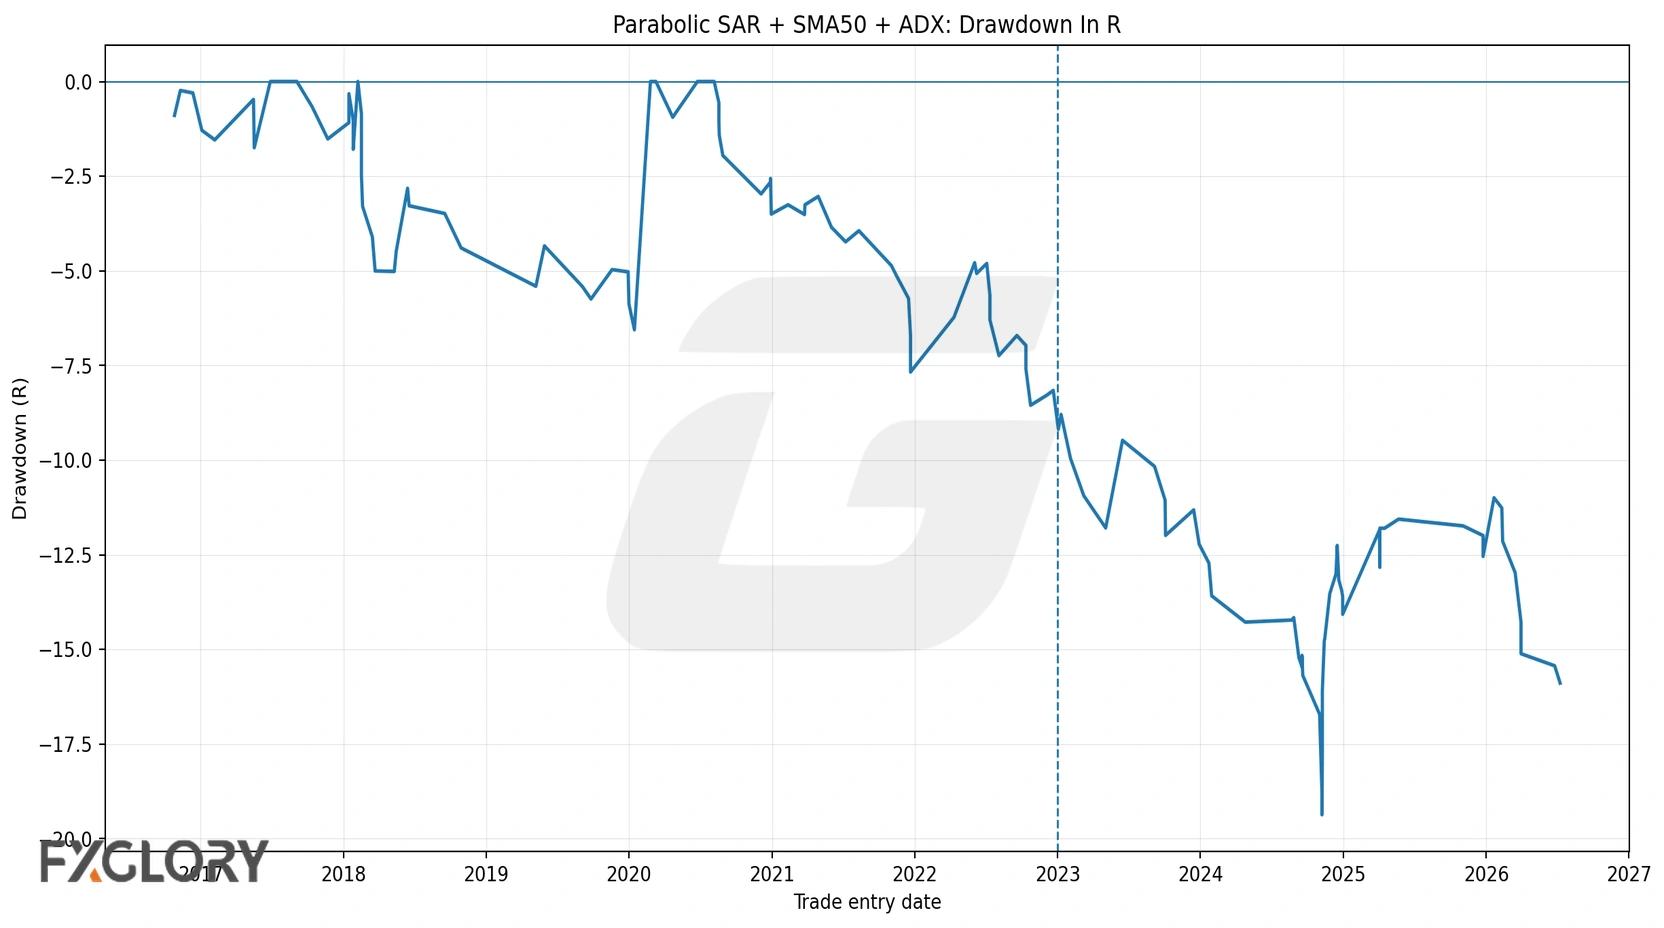
| Maximum drawdown | Largest peak-to-trough decline in cumulative net R |
Worked Position-Size Example
Assume a USD account balance of $5,000 and a maximum risk of 0.5%, or $25. An EURUSD long enters at 1.0900 with a completed PSAR stop at 1.0850, creating a 50-pip stop. At approximately $10 per pip for one standard EURUSD lot:
Position size = $25 ÷ (50 pips × $10 per pip per standard lot) = 0.05 lots.
Pip value changes with the pair, position size, and account currency. Margin is separate from stop-based loss. Use Forex Risk Management Strategy for risk rules and the FXGlory Margin Calculator for margin estimates.
Entry And Exit Results
Entry Filters With The Same PSAR Trailing Exit
| Entry model | Trades | Expectancy | Profit factor | Net R |
|---|---|---|---|---|
| PSAR flip only | 990 | -0.0209R | 0.9518 | -20.6451R |
| PSAR + SMA50 | 442 | -0.0523R | 0.8856 | -23.0969R |
| PSAR + ADX | 373 | -0.0650R | 0.8596 | -24.2460R |
| PSAR + SMA50 + ADX | 132 | +0.0512R | 1.1213 | +6.7607R |
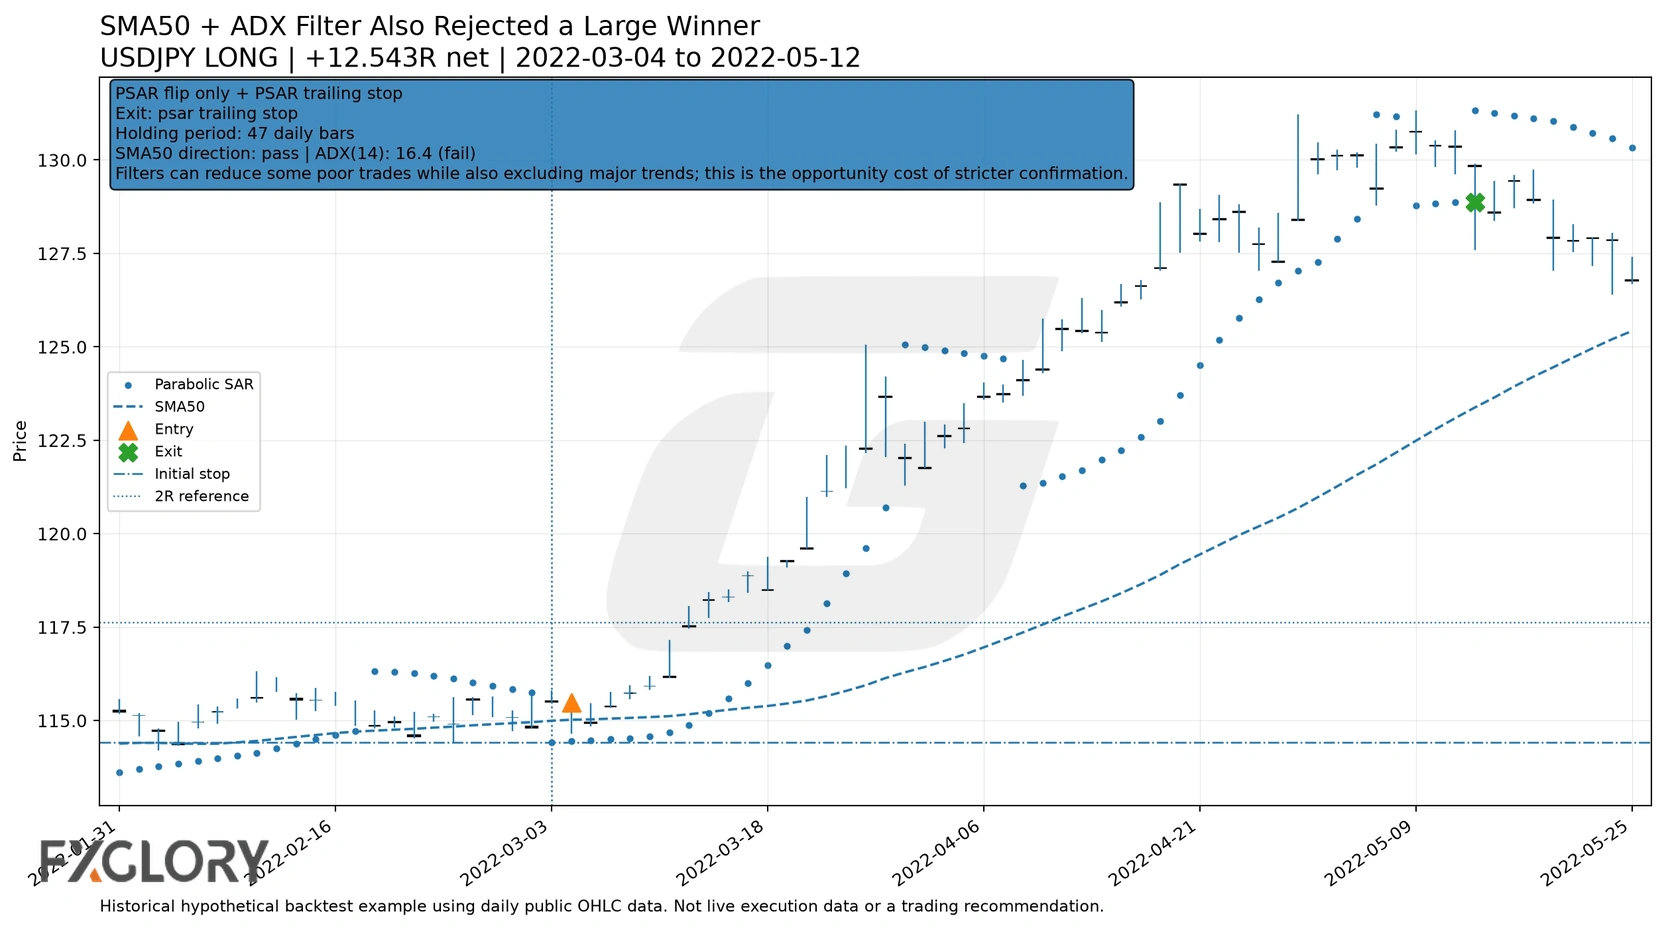
SMA50 alone and ADX alone reduced trade count without improving expectancy. Only the combined filter was positive over the complete sample.
Exit Methods With The Same Combined Entry
| Exit method | Trades | Expectancy | Profit factor | Net R |
|---|---|---|---|---|
| PSAR trailing stop | 132 | +0.0512R | 1.1213 | +6.7607R |
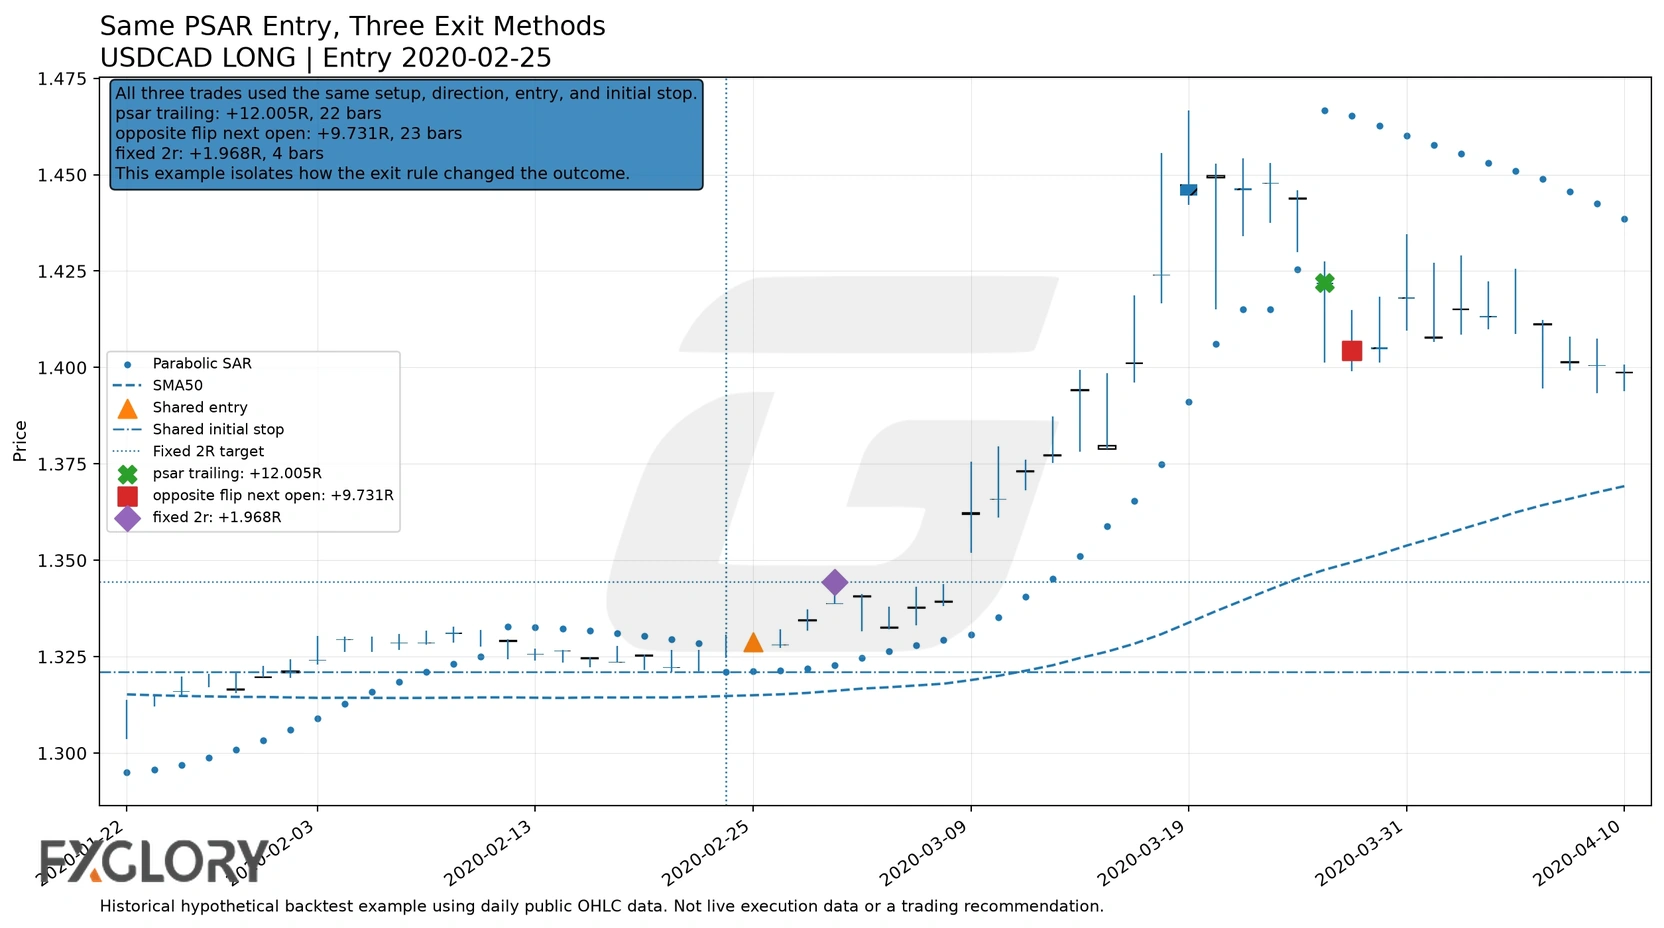
| Opposite PSAR flip, next open | 138 | +0.1387R | 1.3491 | +19.1357R |
| Fixed 2R target | 122 | -0.0292R | 0.9559 | -3.5564R |
The opposite-flip exit led the complete sample but produced negative expectancy in validation. It did not establish a stable advantage. Compare the structures in Forex Exit Strategies.
Validation, Year Concentration, And Direction
| Sample | Trades | Win rate | Expectancy | Profit factor | Net R |
|---|---|---|---|---|---|
| Development: before 2023 | 80 | 41.25% | +0.1811R | 1.4582 | +14.4897R |
| Validation: 2023 onward | 52 | 34.62% | -0.1486R | 0.6796 | -7.7290R |
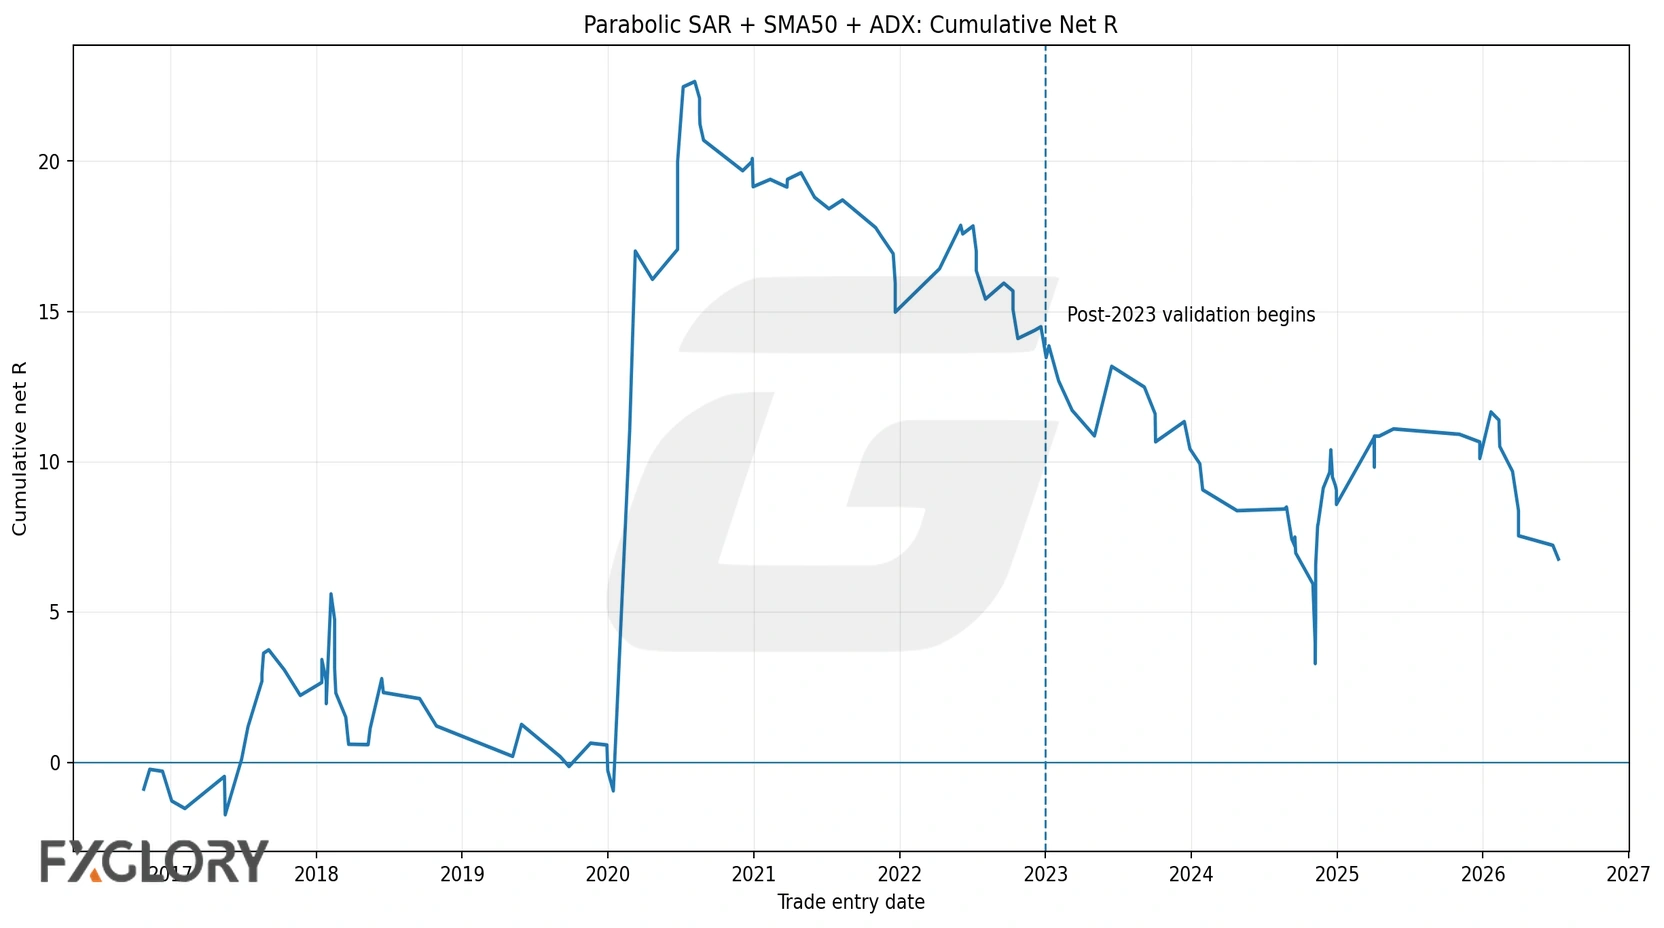
The primary model earned +6.7607R over the full sample but lost -7.7290R after 1 January 2023. Maximum drawdown was -19.3649R, 2.86 times the final full-sample gain. On that evidence, the result did not validate.
Year Concentration
| Measure | Result |
|---|---|
| Best entry year | 2020: +18.5745R across 17 trades |
| Worst complete entry year | 2021: -4.1715R across 12 trades |
| Positive entry-year buckets | 2017, 2020, and 2025 |
| Negative entry-year buckets | Eight of eleven; 2016 and 2026 are partial years |
| 2020 versus final result | 2020 alone produced 2.75 times the final +6.7607R gain |
Losses outside 2020 erased most of that trend-year gain, so the final result was not produced by broad year-to-year consistency.
Long Versus Short Trades
| Direction | Trades | Expectancy | Profit factor | Net R | Max drawdown |
|---|---|---|---|---|---|
| Long | 67 | +0.1659R | 1.4240 | +11.1155R | -6.4081R |
| Short | 65 | -0.0670R | 0.8526 | -4.3548R | -12.9568R |
The pooled result concealed a directional imbalance: longs generated the gain, while shorts reduced it.
Pair And Cost Sensitivity
Primary Model By Pair
| Pair | Trades | Expectancy | Profit factor | Net R |
|---|---|---|---|---|
| USDCAD | 19 | +0.5149R | 2.3673 | +9.7837R |
| USDJPY | 20 | +0.2073R | 1.6450 | +4.1462R |
| AUDUSD | 23 | +0.1326R | 1.3444 | +3.0502R |
| EURUSD | 25 | +0.0933R | 1.2177 | +2.3323R |
| USDCHF | 20 | -0.0991R | 0.7429 | -1.9824R |
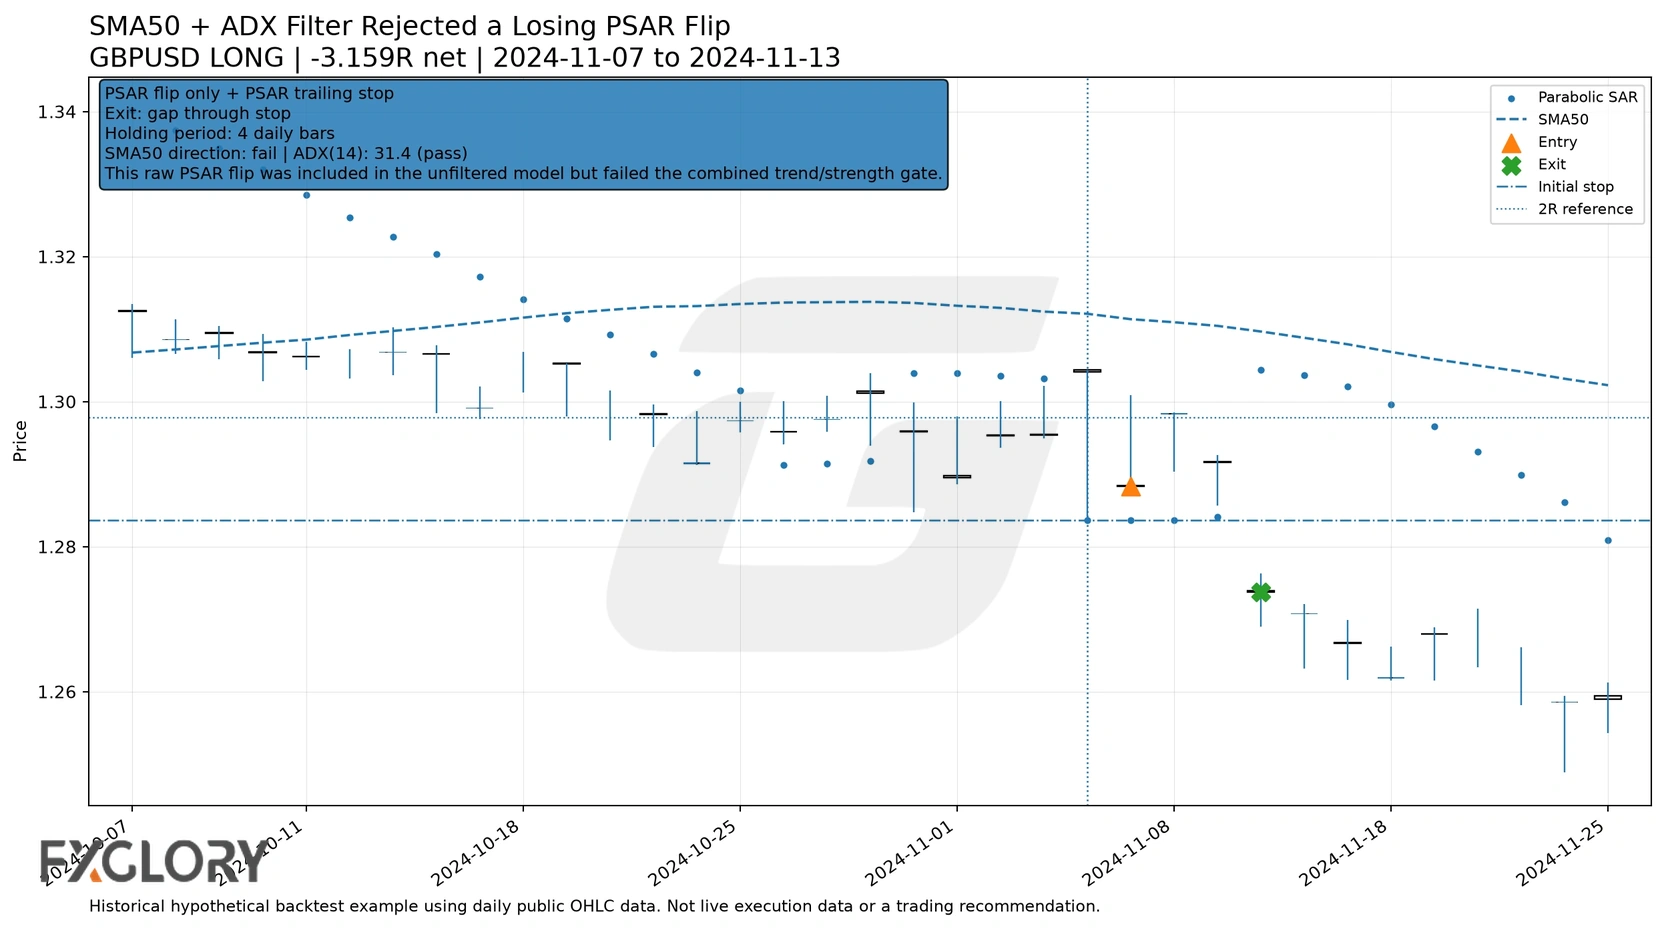
| GBPUSD | 25 | -0.4228R | 0.2899 | -10.5693R |
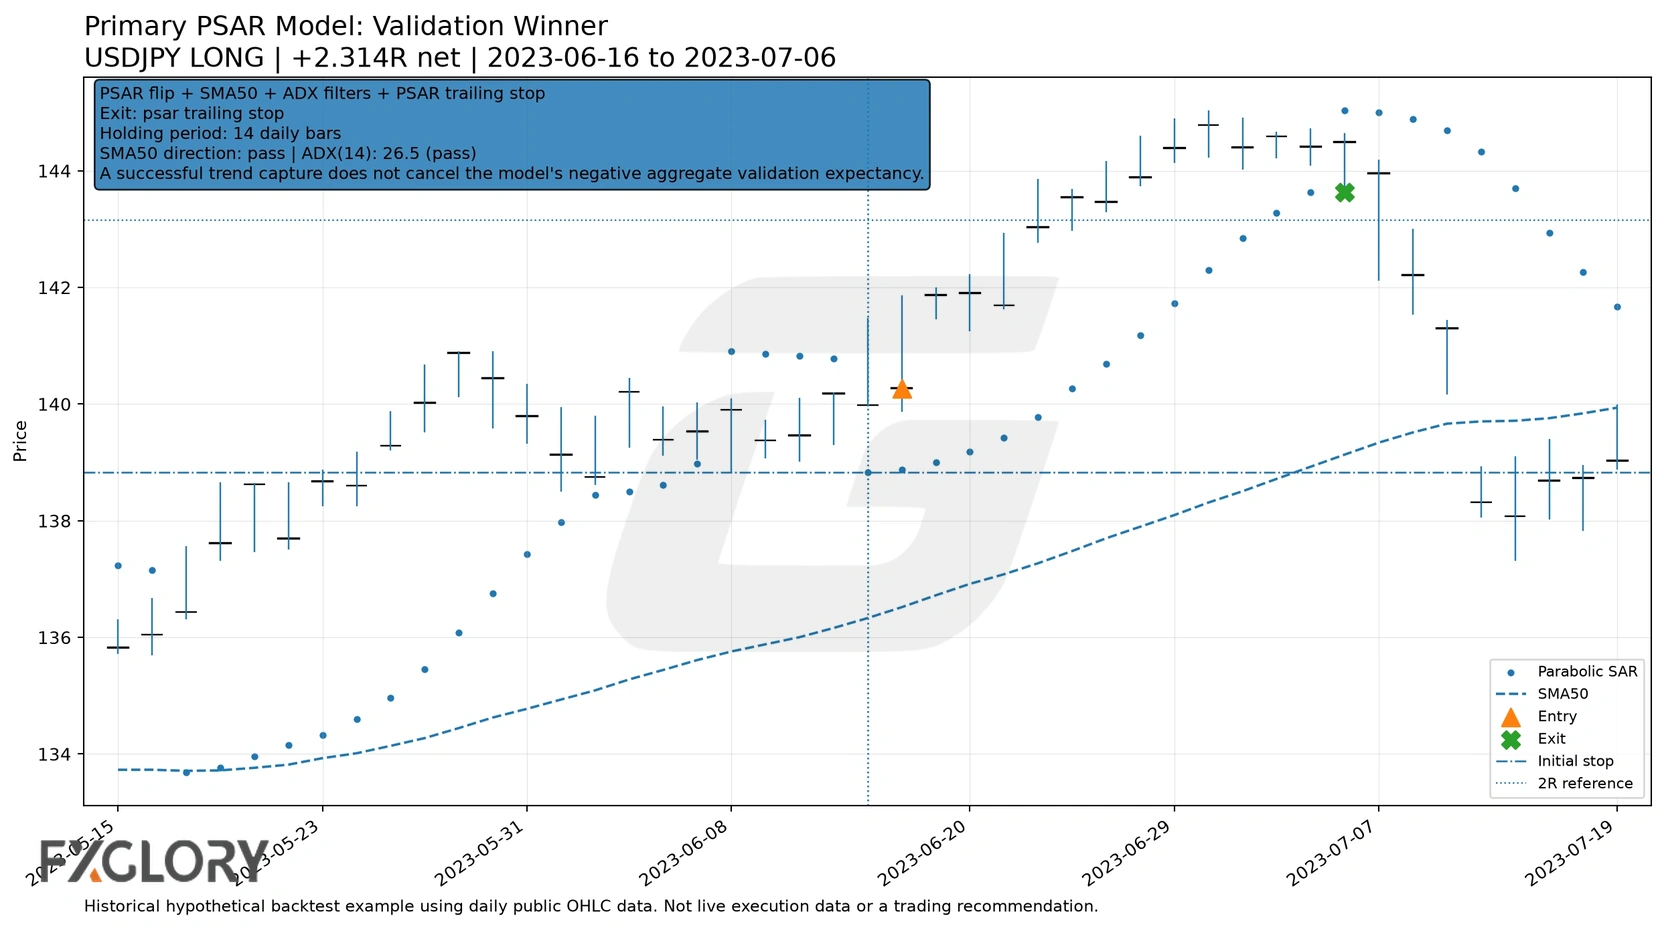
USDCAD's result included the exceptional 2020 trend shown later. GBPUSD was negative across 25 trades. These samples are too small to support a best-pair recommendation.
Execution-Cost Sensitivity
| Scenario | Assumption | Expectancy | Net R |
|---|---|---|---|
| Low | 0.7-pip spread + 0.1 pip slippage per side | +0.0632R | +8.3453R |
| Baseline | 1.5-pip spread + 0.5 pip slippage per side | +0.0512R | +6.7607R |
| Higher | 2.0-pip spread + 0.5 pip slippage per side | +0.0475R | +6.2655R |
| High stress | 3.0-pip spread + 1.0 pip slippage per side | +0.0325R | +4.2848R |
| Holding-cost stress | Baseline + 0.2 pip per calendar day | +0.0297R | +3.9213R |
The complete sample remained positive under these assumptions, but costs reduced an already thin edge. The holding-cost input is a generic stress, not historical FXGlory swap.
What PSAR Added To An Independent EMA Entry
This was a separate role-isolation experiment, not the primary PSAR strategy. It used an EMA20/EMA50 crossover so PSAR could be tested as confirmation or exit logic without also defining the entry. See Forex Moving Average Crossover Strategy for crossover mechanics.
| Model | Trades | Expectancy | Profit factor | Net R |
|---|---|---|---|---|
| EMA crossover, no PSAR, fixed 2R | 212 | +0.1359R | 1.2202 | +28.8130R |
| EMA crossover + PSAR confirmation, fixed 2R | 203 | +0.1624R | 1.2663 | +32.9608R |
| EMA crossover + opposite PSAR exit | 272 | -0.0357R | 0.8897 | -9.7166R |
| EMA crossover + PSAR trailing stop | 271 | -0.0498R | 0.8562 | -13.4935R |
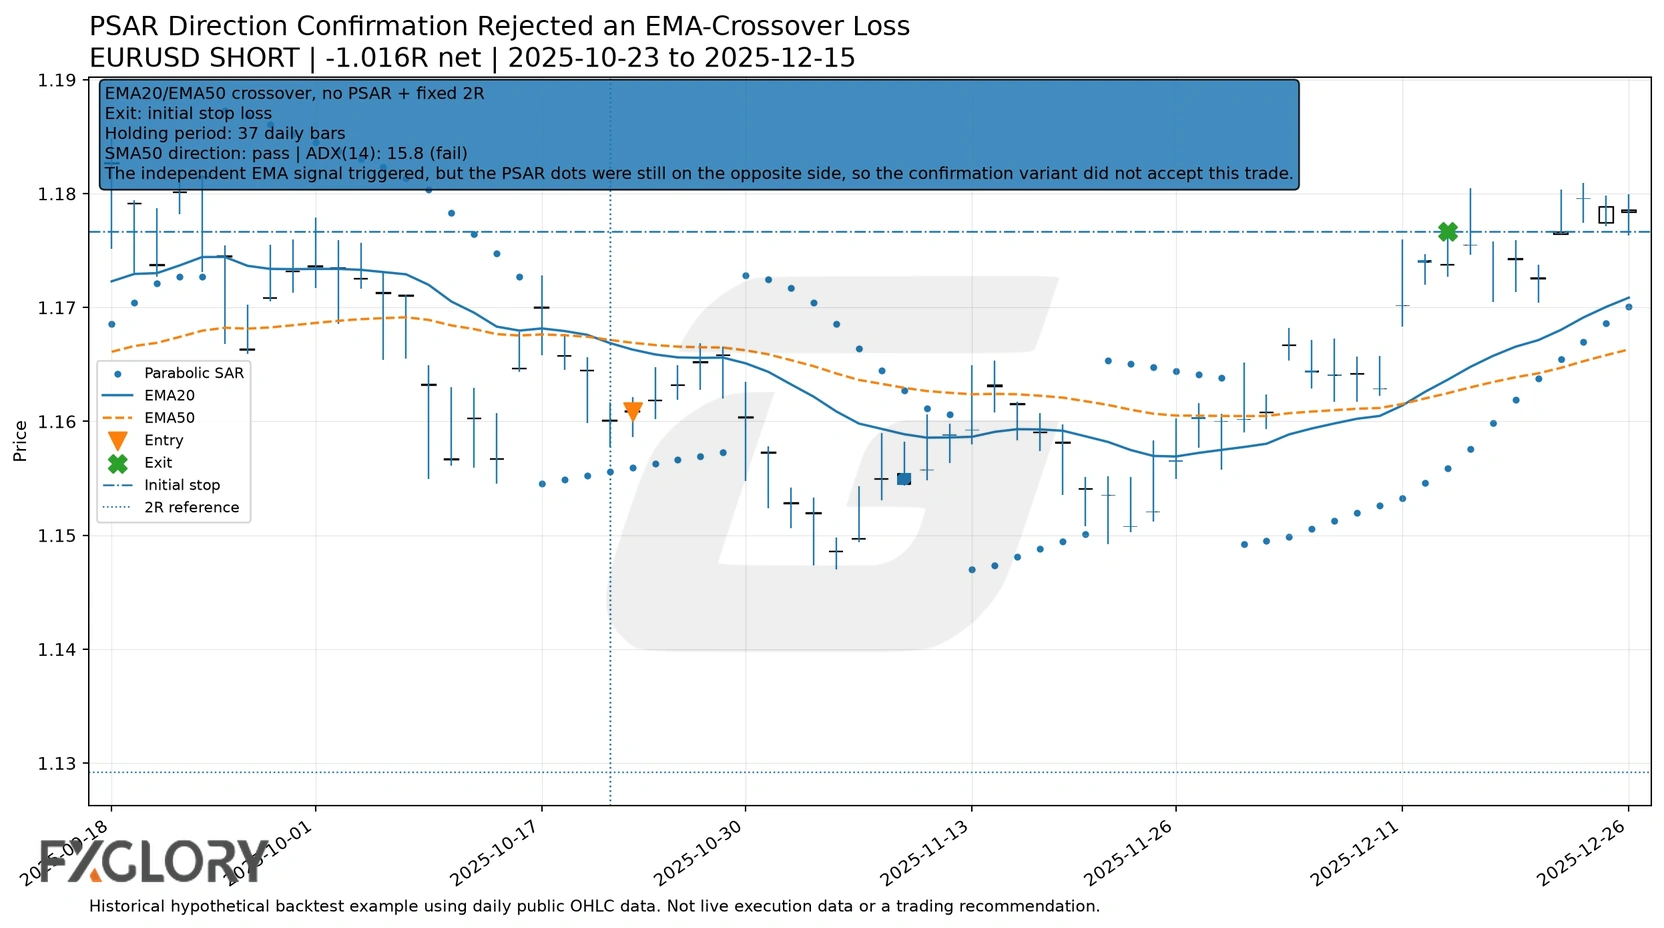
PSAR confirmation increased full-sample expectancy by 0.0265R in this specific control while rejecting nine entries. That does not establish a universal or validated improvement, and both PSAR exit variants were negative.
MT4, MT5, Alerts, And Automation
- Open the currency-pair chart and select the daily timeframe used by the study.
- Add Parabolic SAR and set Step = 0.02 and Maximum = 0.20.
- Add a 50-period Simple Moving Average to closing prices.
- Add ADX with period 14 and use 25 as the tested strength threshold.
- Wait for the daily candle to close before confirming the flip.
- Record the setup-candle PSAR value and evaluate the next open.
- Move a manual stop only after a new eligible PSAR value is confirmed.
The standard indicator plots values; it does not place, reverse, or modify orders by itself. Automated entries and trailing stops require an Expert Advisor that reproduces the tested logic.
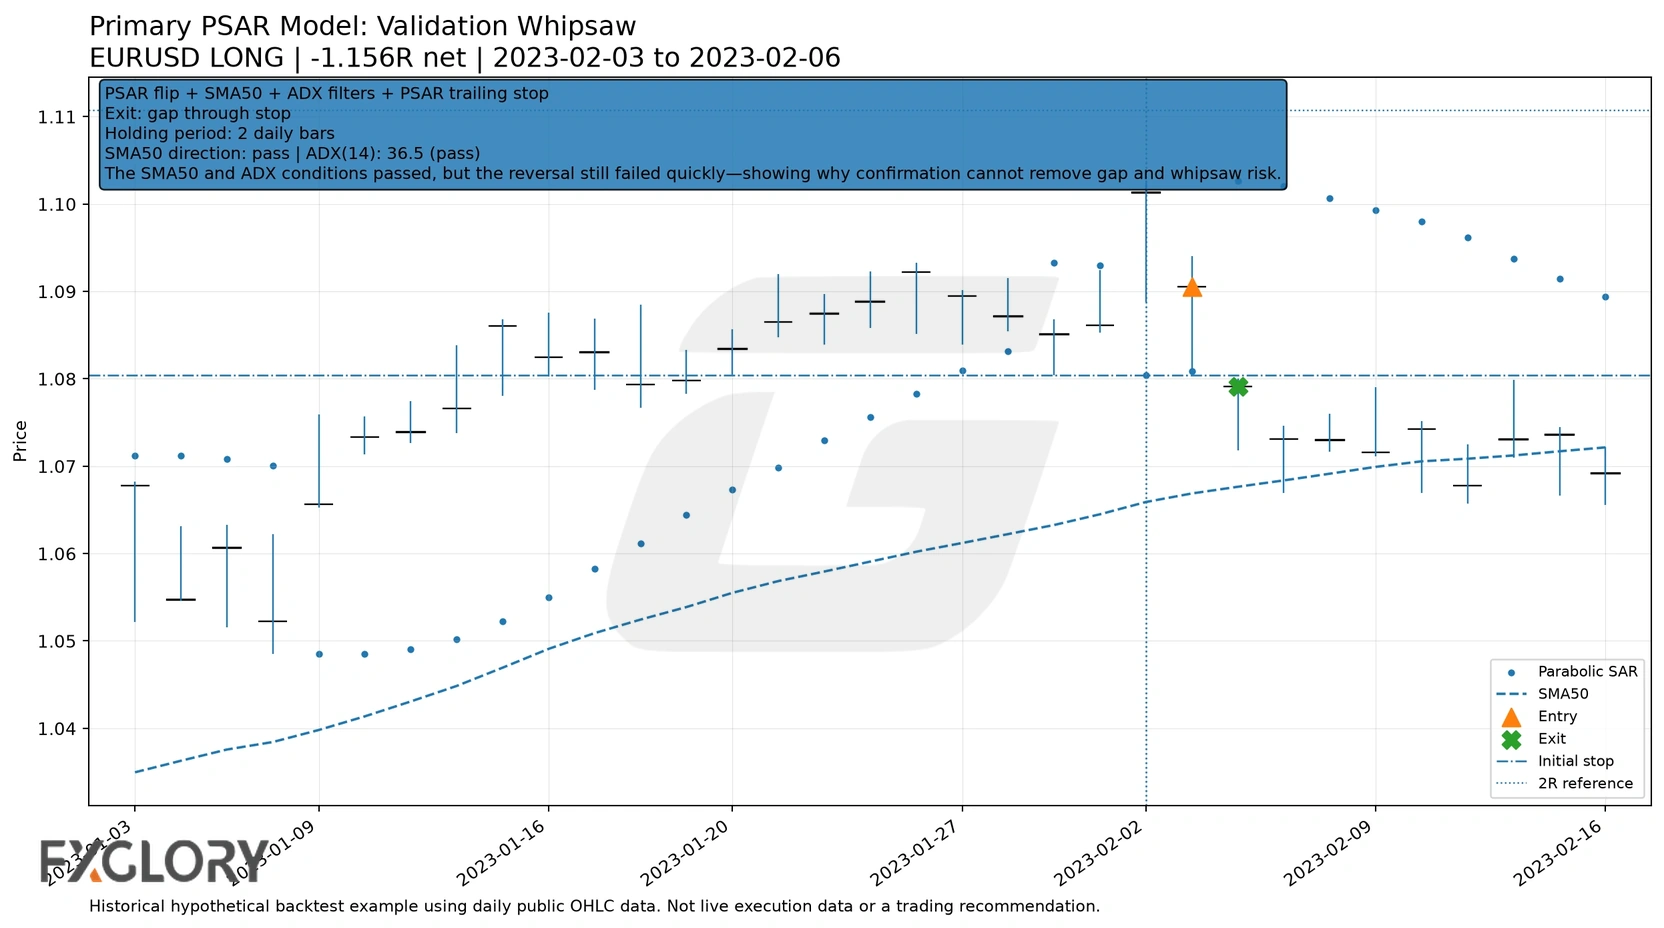
An EA reproducing this model must explicitly enforce completed-bar signals, next-open entries, one-bar-delayed trailing values, gap-through-stop fills, the one-trade-per-pair rule, and the chosen cost assumptions. Removing any of those conditions creates a different test.
Review FXGlory Trading Platforms before matching the workflow to the platform you use.
Daily, Multi-Timeframe, And Intraday Boundaries
The published figures apply only to the daily model. They do not establish performance on one-minute, five-minute, fifteen-minute, hourly, four-hour, or mixed-timeframe versions.
A multi-timeframe version must separately define signal timing, lower-timeframe alignment, stop control, intraday costs, and same-candle event handling. FXGlory's Forex Multiple Time Frame Analysis guide covers the workflow concept, but none of this article's performance numbers can be transferred to that variation.
Scalping would require high-quality intraday bid/ask or tick data, session rules, spread spikes, slippage, and execution latency that this daily study does not contain.
Selected Backtest Examples
These examples illustrate specific behaviours from the trade log. They do not replace the aggregate tables above.
Limitations And Final Takeaway
- Public yfinance OHLC data is not FXGlory historical bid/ask, spread, swap, or order-execution data.
- Daily OHLC cannot reveal every intrabar event sequence; same-candle ambiguity remains.
- The study used no economic-calendar blackout.
- The six currency pairs were measured as separate strategy streams, not as one correlated account portfolio.
- Simultaneous USD exposure, account margin, leverage changes, and portfolio-level drawdown were not simulated.
- The primary validation sample contained 52 trades, which limits confidence in fine-grained conclusions.
- Platform implementations can differ slightly in initialization and reversal handling.
- The settings comparison was a pre-declared sensitivity review, not a complete optimization.
- The results do not apply to intraday, scalping, or multi-timeframe versions.
The evidence does not support treating Parabolic SAR as a consistently profitable standalone forex strategy. In this study, performance depended heavily on filtering, market period, direction, exit method, and testing assumptions, and the primary model failed its post-2023 validation segment.