
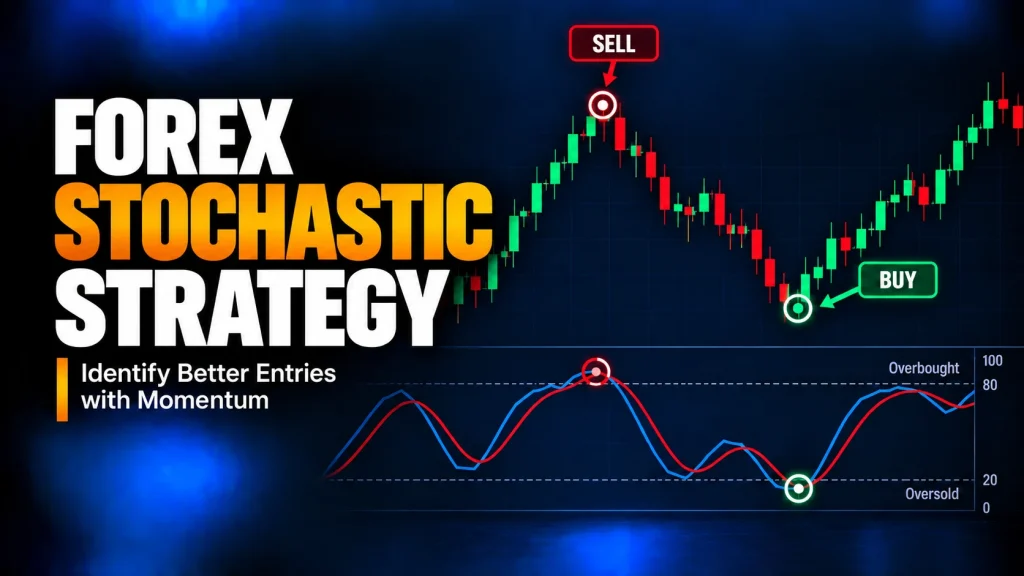
What Is A Forex Stochastic Strategy?
A forex Stochastic strategy turns a Stochastic reading into a defined trade plan: where the signal appears, what market condition must exist, where the entry triggers, where the setup is invalidated, and how the trade exits. In this article, Stochastic is tested through %K/%D crossovers, 80/20 re-entry, the 50 line, divergence, moving-average pullbacks, and oscillator trendline breaks.
The indicator reading is not a trade by itself. A %K cross above %D, a move below 20, a move above 80, or a divergence signal only becomes useful when it is tied to price structure, trend or range condition, stop placement, target logic, and cost assumptions.
This page focuses on Stochastic as a strategy tool. For indicator mechanics, fast versus slow Stochastic, %K/%D basics, and false-signal behavior, use the dedicated Stochastic Forex Indicator guide. For the broader framework, use Forex Indicator Strategies.
Forex Stochastic Strategy Test Summary
| Question | Answer From This Test |
|---|---|
| Did the tested Stochastic model pass? | No. The full baseline model finished negative. |
| Which setup had the least negative expectancy? | Stochastic 50-line trend continuation at -0.1977R per trade. |
| Which setup had the highest profit factor? | Stochastic divergence reversal at 0.5739, still below breakeven. |
| Which setup created the most total loss? | Stochastic oscillator trendline break at -103.6039R, partly because it produced 501 accepted trades. |
| What is the main practical lesson? | Stochastic signals need strict filters, realistic trading costs, and invalidation rules. A crossover alone was not enough in this model. |
Stochastic Strategy Rules At A Glance
The tested rules used the same operating window, cost assumption, stop logic, target logic, and same-day exit framework. This made the comparison about setup behavior, not about changing the rules until one version looked good.
| Setup | Market Condition | Trigger | Stop Logic | Exit Logic | Skip When |
|---|---|---|---|---|---|
| Stochastic range crossover | Range-like 1H context | %K crosses %D from the 20/80 zone with directional candle confirmation | Beyond setup or recent range extreme plus ATR buffer | 1.3R target, invalidation, time exit, or same-day cutoff | Price is trending hard or the signal appears without range structure |
| Stochastic + MA pullback | Trend aligned with SMA100 and 1H context | %K crosses %D after a pullback while price remains on the trend side of SMA100 | Beyond structure or setup candle plus ATR buffer | 1.3R target or close back through invalidation logic | SMA100 is flat or price has already stretched too far from the trigger |
| Stochastic 50-line continuation | Trend context | %K crosses the 50 line in the trend direction | Beyond structure plus ATR buffer | 1.3R target or Stochastic/price invalidation | The 50-line cross is against the higher-timeframe trend |
| Stochastic divergence reversal | Potential exhaustion near structure | Price/Stochastic divergence followed by %K/%D confirmation | Beyond divergence pivot plus ATR buffer | 1.3R target, stop, or invalidation | Divergence appears in the middle of noise without a price trigger |
| Stochastic trendline break | Oscillator pressure shifts with price structure | Oscillator trendline break plus price structure break | Beyond range or structure plus ATR buffer | 1.3R target or trendline setup invalidation | Oscillator breaks without price confirmation |
Why Stochastic Crossovers Alone Are Weak
The Stochastic Oscillator can stay above 80 or below 20 while a currency pair continues trending. That is why the page does not treat overbought as an automatic sell or oversold as an automatic buy. The model only allowed Stochastic signals after adding trend, range, structure, candle, stop, target, and session filters.
The backtest still finished negative after those filters. The result shows that Stochastic signals still need a complete trading plan and must be tested after realistic costs.
Use Support And Resistance Before Taking 80/20 Signals
A Stochastic signal near 20 or 80 is more useful when it appears at a price area where a reaction is plausible. For a range-crossover setup, that usually means support, resistance, a recent swing area, a range boundary, or another pre-defined structure level—not the middle of a noisy chart.
In practice, this means a long range-crossover idea should first identify a support or range-low area, then wait for Stochastic confirmation and a valid stop. A short range-crossover idea should first identify resistance or a range-high area, then wait for confirmation. The broader concept is covered in Support and Resistance in Forex, while this page keeps the focus on Stochastic strategy rules.
Five Forex Stochastic Strategy Types Tested
1. Stochastic Range Crossover Strategy
The range crossover setup looked for %K crossing %D from the oversold or overbought zone while the 1H context looked range-like. Long setups required a bullish crossover from the lower zone near a plausible support or range-low area; short setups required a bearish crossover from the upper zone near resistance or a range-high area. The model skipped signals without range context.
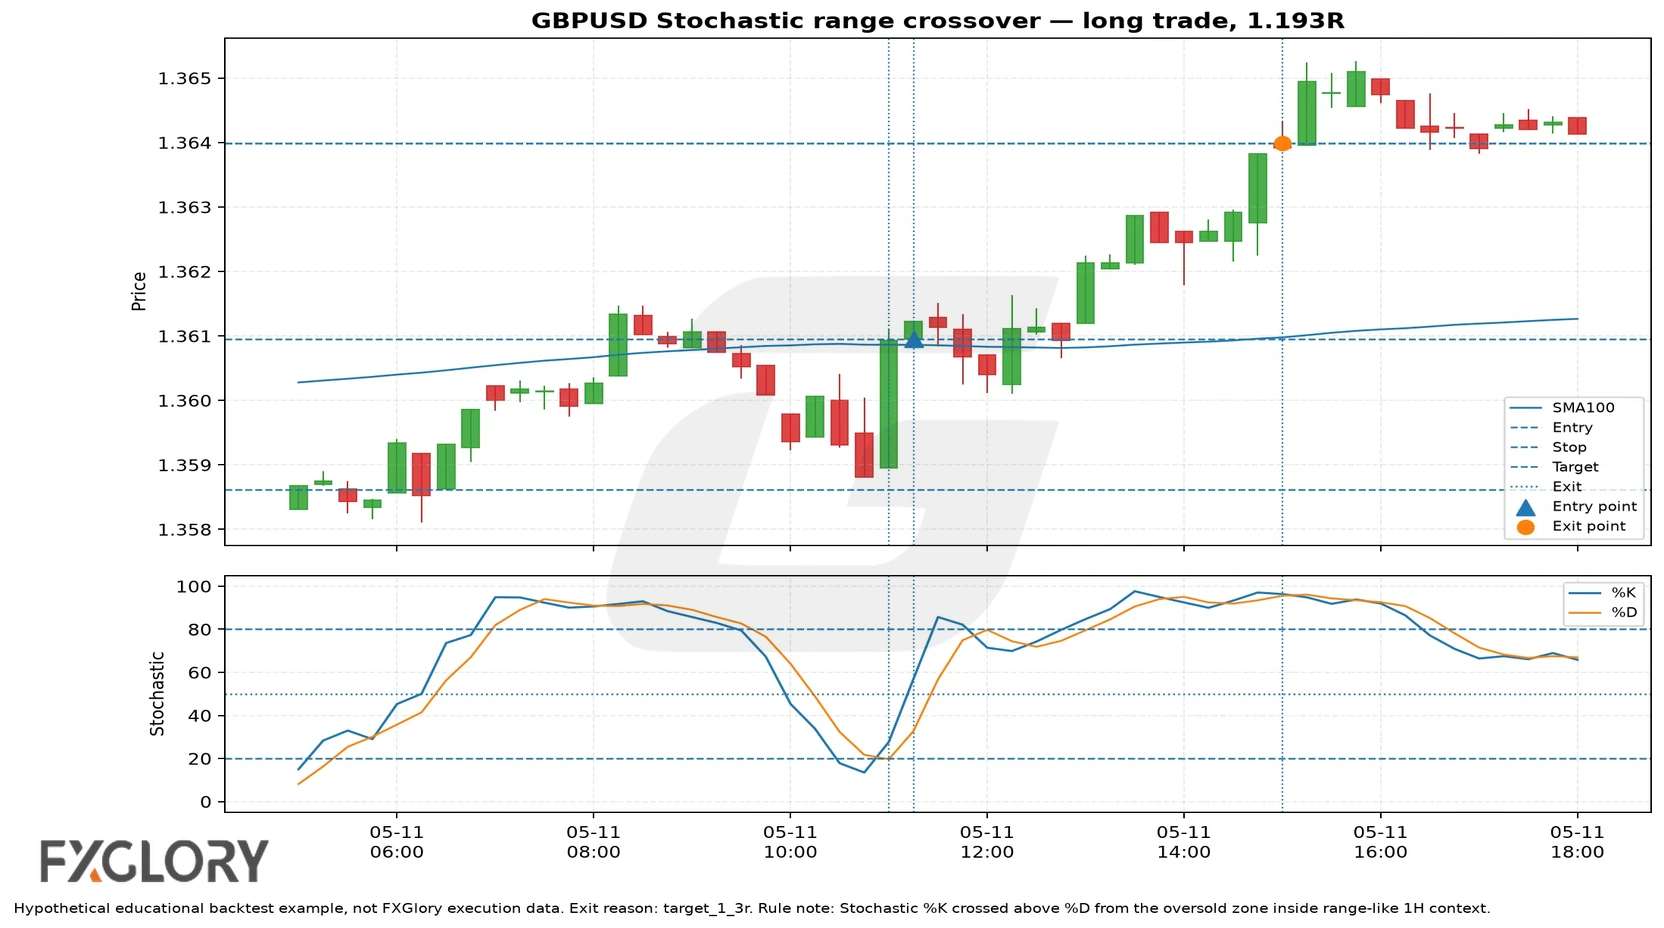
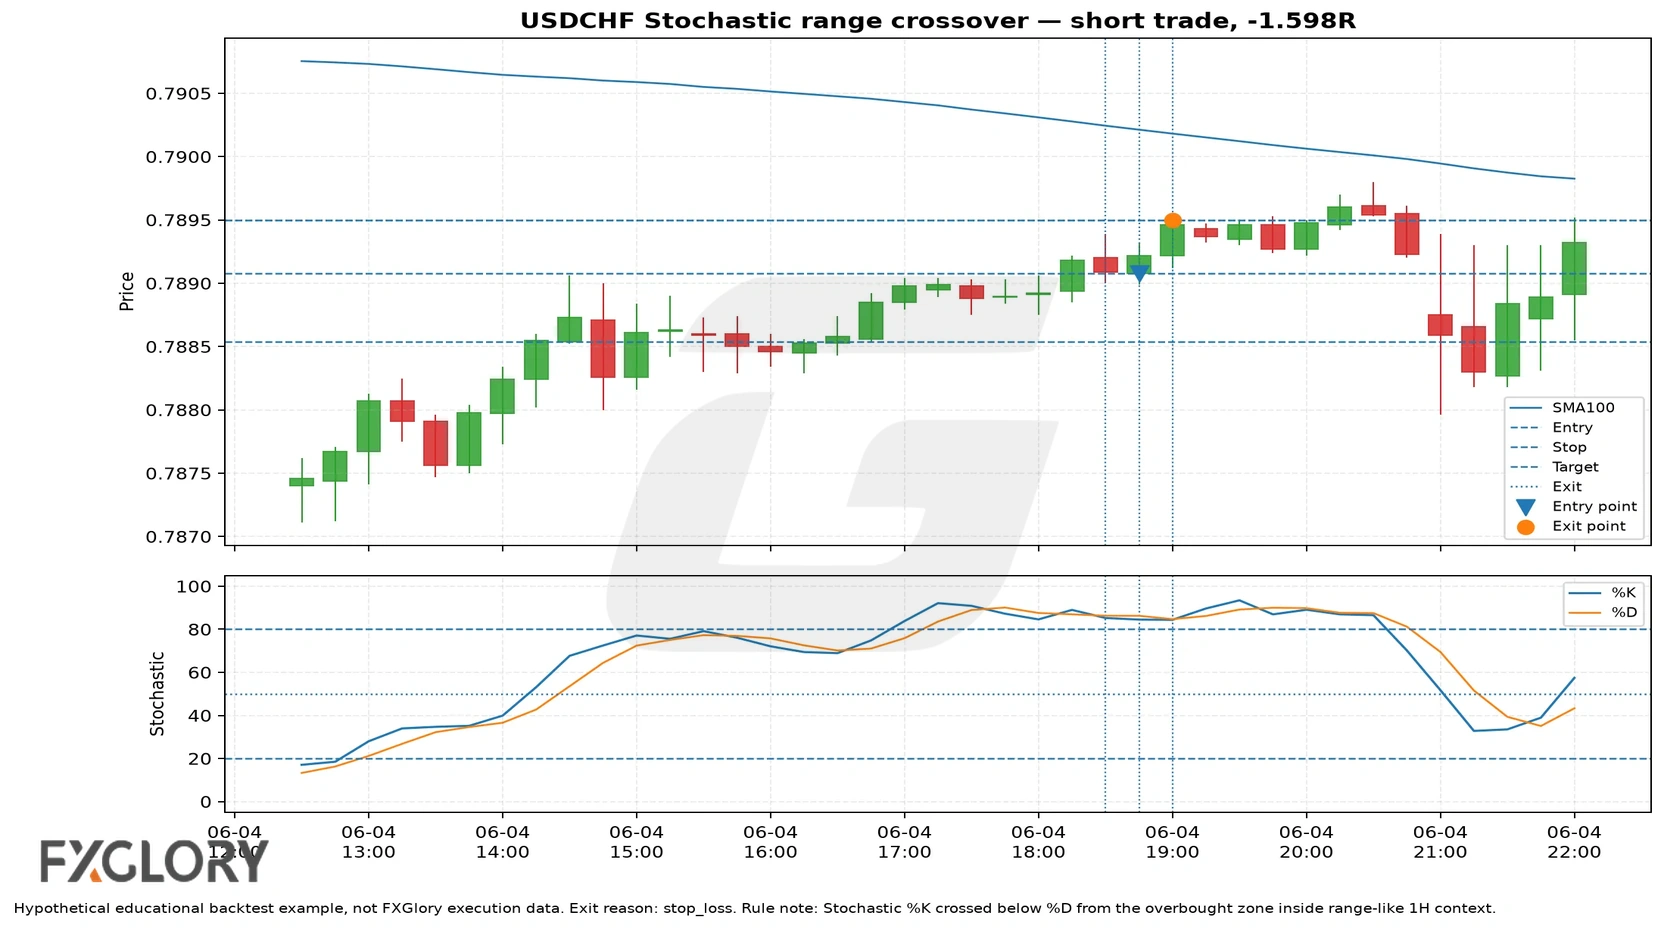
The failed range-crossover example shows why a clean %K/%D cross near the 80/20 zone is not enough. Price can still continue against the signal, so the setup needs a pre-defined stop, invalidation level, and cost-adjusted target room before entry.
2. Stochastic With Moving Average Pullback Strategy
The Stochastic with moving average setup used the 100-period SMA as a trend filter. In a long setup, price had to remain above a rising SMA100 while Stochastic crossed up after a pullback. In a short setup, price had to remain below a falling SMA100 while Stochastic crossed down after a pullback.
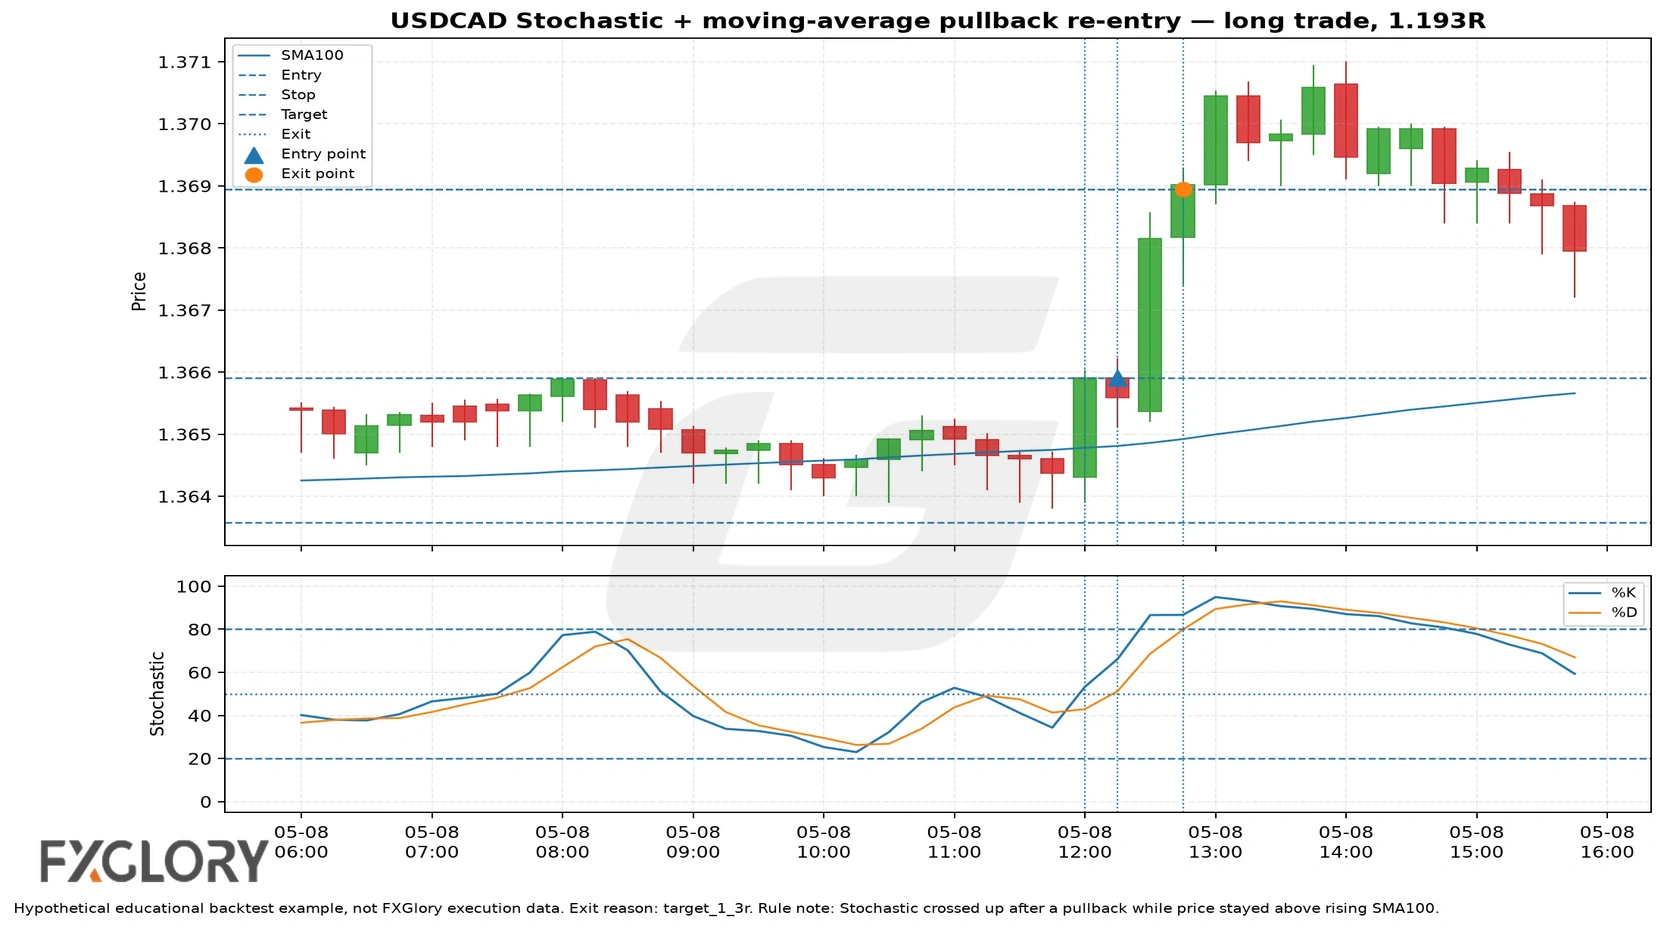
This setup is more practical than buying or selling every oscillator extreme because SMA100 decides the trade direction and Stochastic only times the pullback re-entry. If price is not on the correct side of SMA100, the model rejects the signal instead of forcing a crossover trade.
3. Stochastic 50-Line Trend Continuation Strategy
The 50-line setup treated Stochastic as a continuation filter instead of only an overbought/oversold tool. A bullish model required %K to move above 50 in a trend-aligned environment. A bearish model required %K to move below 50 in a downtrend context.
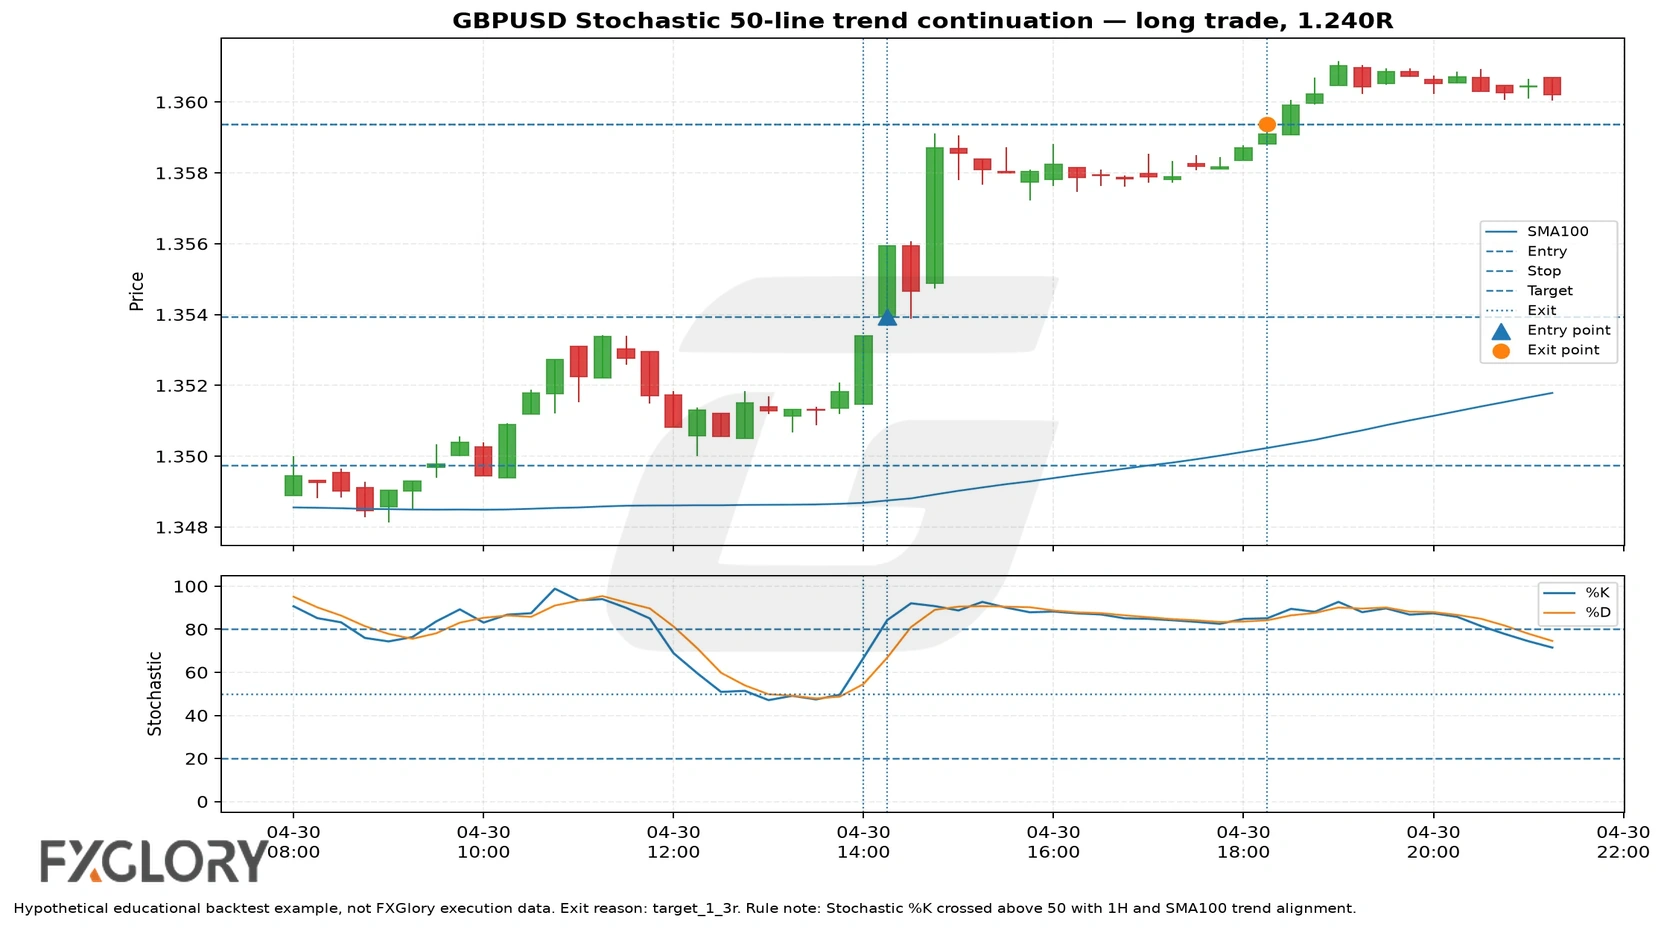
In the baseline results, this setup had the least negative expectancy at -0.1977R per trade. That does not make it profitable; it only means it failed less severely than the other tested variants under the same rules.
4. Stochastic Divergence Strategy Forex
The divergence setup looked for price to make a lower low while Stochastic made a higher low for bullish divergence, or price to make a higher high while Stochastic made a lower high for bearish divergence. The model then required %K/%D confirmation instead of entering on divergence alone.
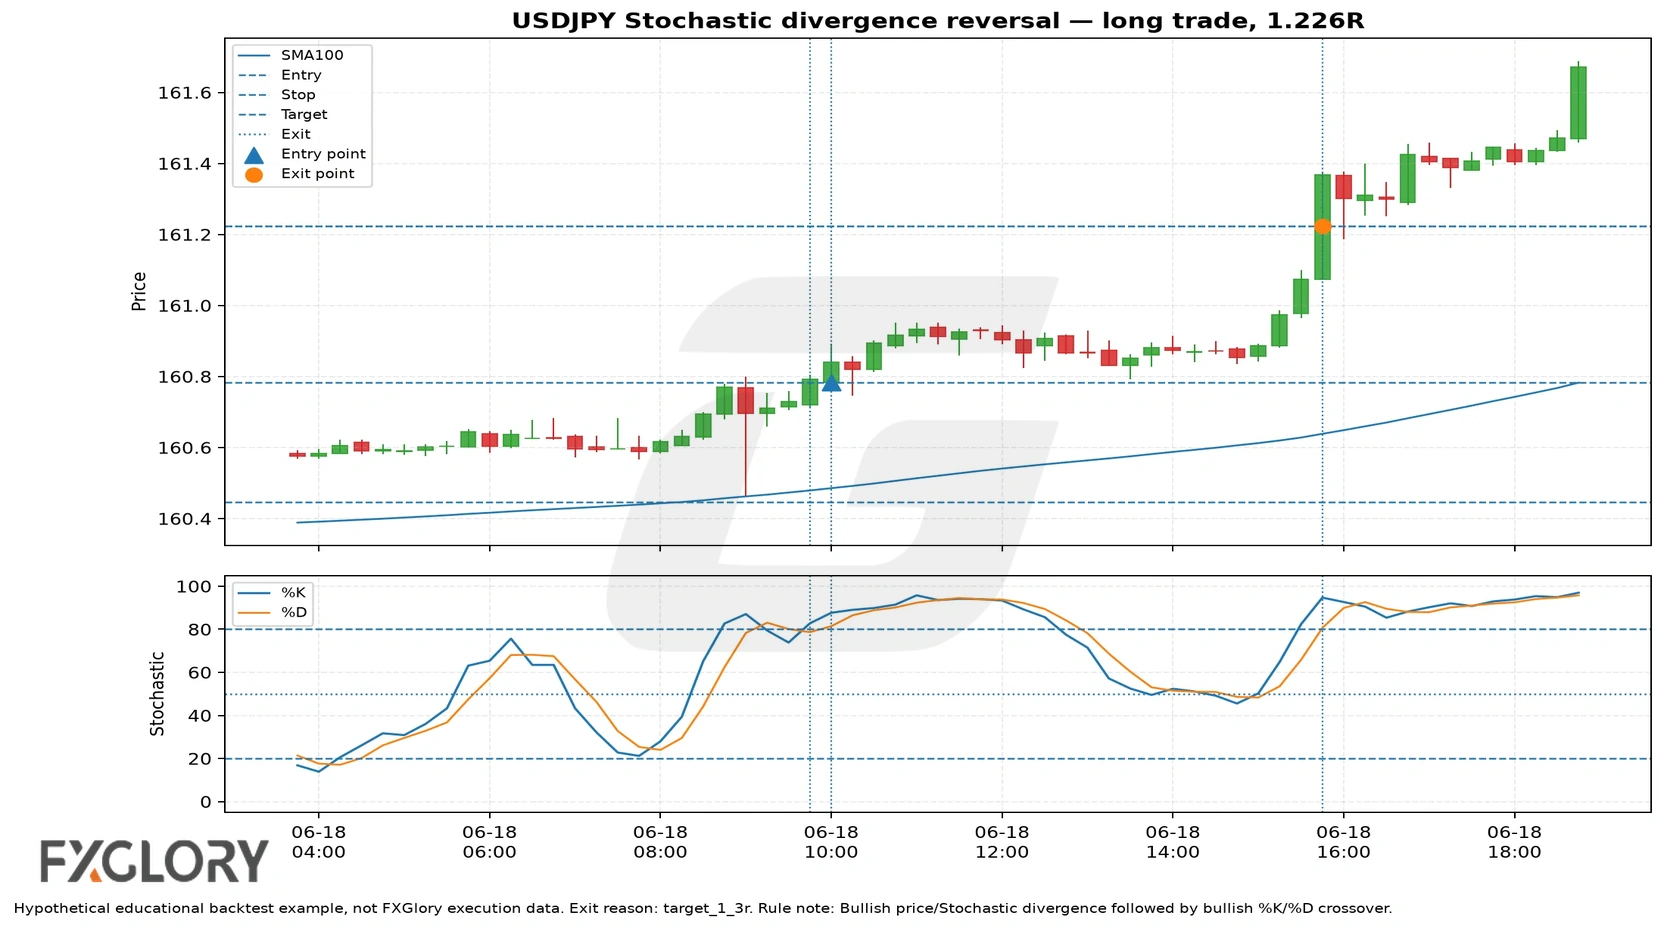
Divergence had the highest profit factor in the baseline setup comparison, but it still finished below breakeven. In this model, divergence worked better as a warning condition than as a standalone entry rule, because it still needed confirmation, invalidation, and position risk control.
Regular Vs Hidden Stochastic Divergence
This backtest used regular divergence: lower lows in price with higher lows in Stochastic for bullish reversal pressure, or higher highs in price with lower highs in Stochastic for bearish reversal pressure. Hidden Stochastic divergence is different. It usually appears during pullbacks inside an existing trend and is often used as a continuation clue, not a reversal clue.
Hidden divergence was not included in this test because it needs a separate trend-continuation rule model. Mixing regular reversal divergence and hidden continuation divergence inside one result table would blur the setup logic and create a weaker educational test.
5. Stochastic Oscillator Trendline Break Strategy
The trendline-break setup tested an oscillator trendline concept. The rule model used recent Stochastic pivots to form a simplified oscillator trendline, then required price structure confirmation before entry.
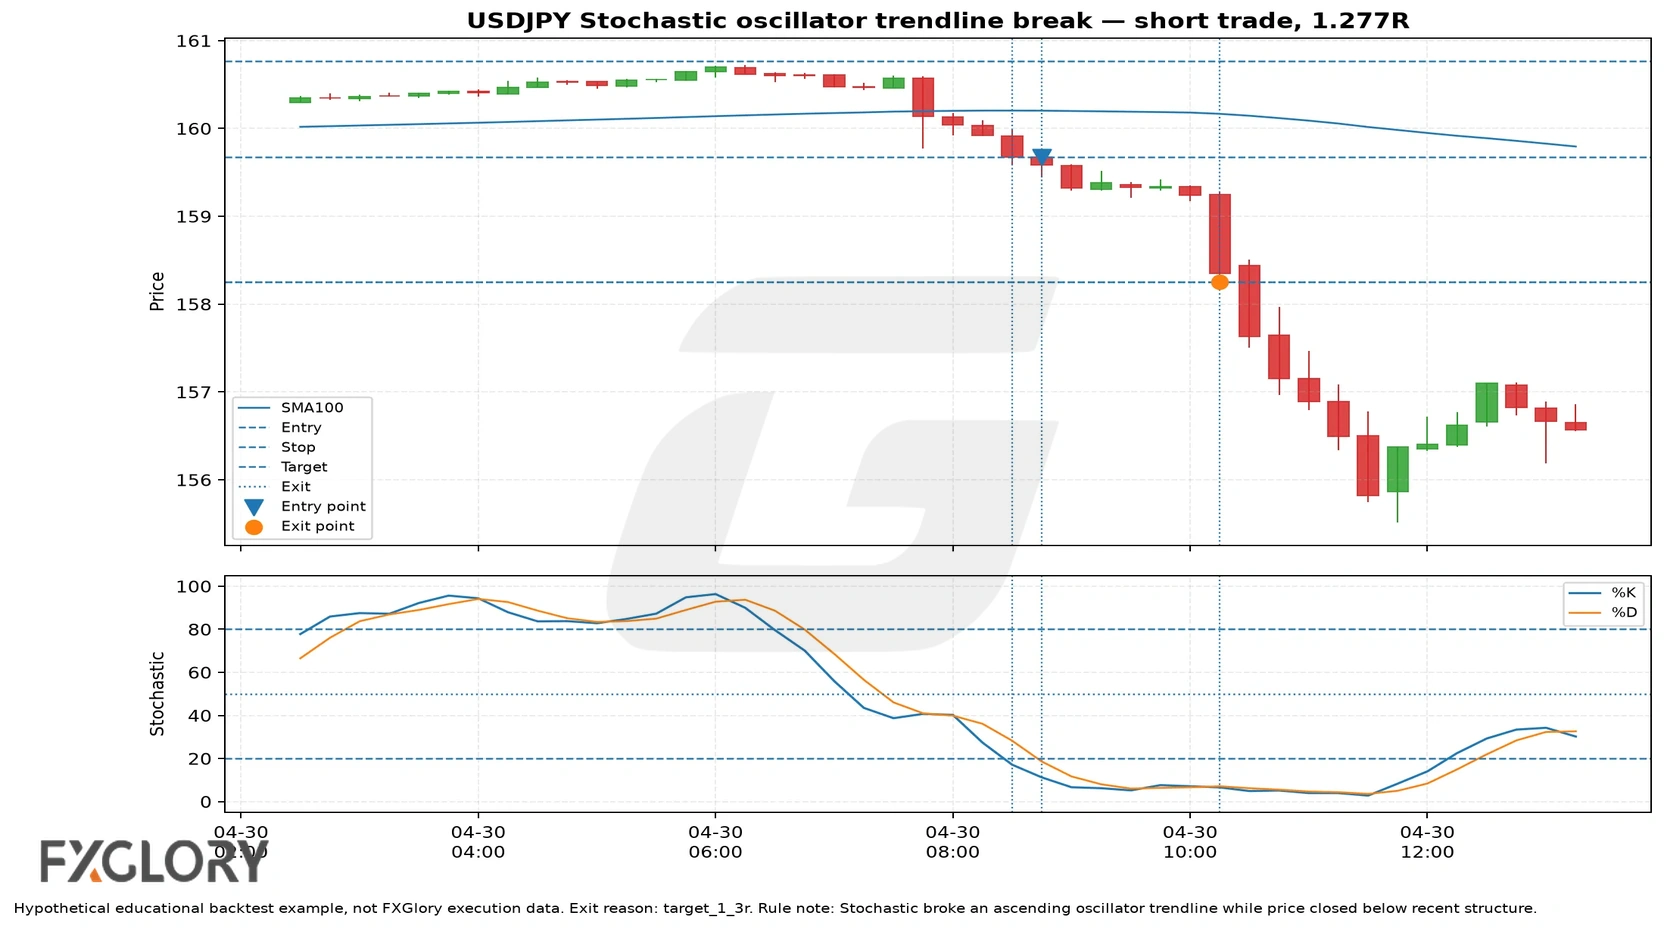
This setup produced the most accepted trades and the largest total baseline loss. The invalidation exit rate was also high, which suggests the tested oscillator trendline method was too noisy under the chosen 15M/1H framework.
What About Stochastic RSI?
Stochastic RSI is not the same as the classic Stochastic Oscillator. Classic Stochastic compares the close with the recent high-low range. Stochastic RSI applies a stochastic formula to RSI values. Because it is a different oscillator, it should not be mixed into the same backtest without a separate rule model.
This article mentions Stochastic RSI because users often compare it with the Stochastic Oscillator, but the baseline results use classic 14,3,3 Stochastic and the settings add-on tests only classic Stochastic variants, not Stochastic RSI.
Fast Vs Slow Stochastic Strategy And Settings
Fast Stochastic settings react earlier and usually create more signals. Slow Stochastic settings smooth the oscillator and usually create fewer signals, but later signals are not automatically better. For strategy work, the setting must be judged after entry rules, stop placement, target distance, trading costs, and invalidation rules are applied.
The indicator mechanics behind fast and slow Stochastic belong in the Stochastic Forex Indicator guide. The strategy question is different: did changing the setting improve the tested rule model?
Which Stochastic Settings Worked Best In FXGlory's Test?
FXGlory ran a separate settings-sensitivity add-on using the same educational rule framework as the baseline test: the same six major pairs, five setup families, 15M trigger and 1H context workflow, stop and target logic, operating window, overlap filter, and baseline cost assumption. The settings compared were 5,3,3; 9,3,3; 14,3,3; 14,5,5; and 21,5,5. Because this add-on was a separate rerun, its 14,3,3 case produced 1,208 accepted trades rather than the 1,207 trades in the original baseline run; the two studies should be read as separate result sets rather than forced into one trade count.
No tested setting turned the Stochastic strategy model positive. The faster 5,3,3 setting had the least negative expectancy at -0.1981R, but it also generated the most accepted trades. The slower 14,5,5 and 21,5,5 settings reduced trade count, but their expectancy worsened.
| Stochastic Setting | Accepted Trades | Win Rate | Expectancy | Profit Factor | Total Net R | Interpretation |
|---|---|---|---|---|---|---|
| 5,3,3 | 1,419 | 30.30% | -0.1981R | 0.5163 | -281.0675R | Least negative expectancy, but still negative. |
| 9,3,3 | 1,297 | 30.30% | -0.2135R | 0.5135 | -276.9334R | Second-best expectancy, also negative. |
| 14,3,3 | 1,208 | 28.48% | -0.2305R | 0.4950 | -278.4959R | Separate settings-sensitivity rerun of the 14,3,3 rules; one more accepted trade than the original baseline run. |
| 14,5,5 | 911 | 24.04% | -0.2754R | 0.3799 | -250.9241R | Fewer trades, weaker expectancy. |
| 21,5,5 | 864 | 24.42% | -0.2760R | 0.3758 | -238.4977R | Fewest trades and worst expectancy. |
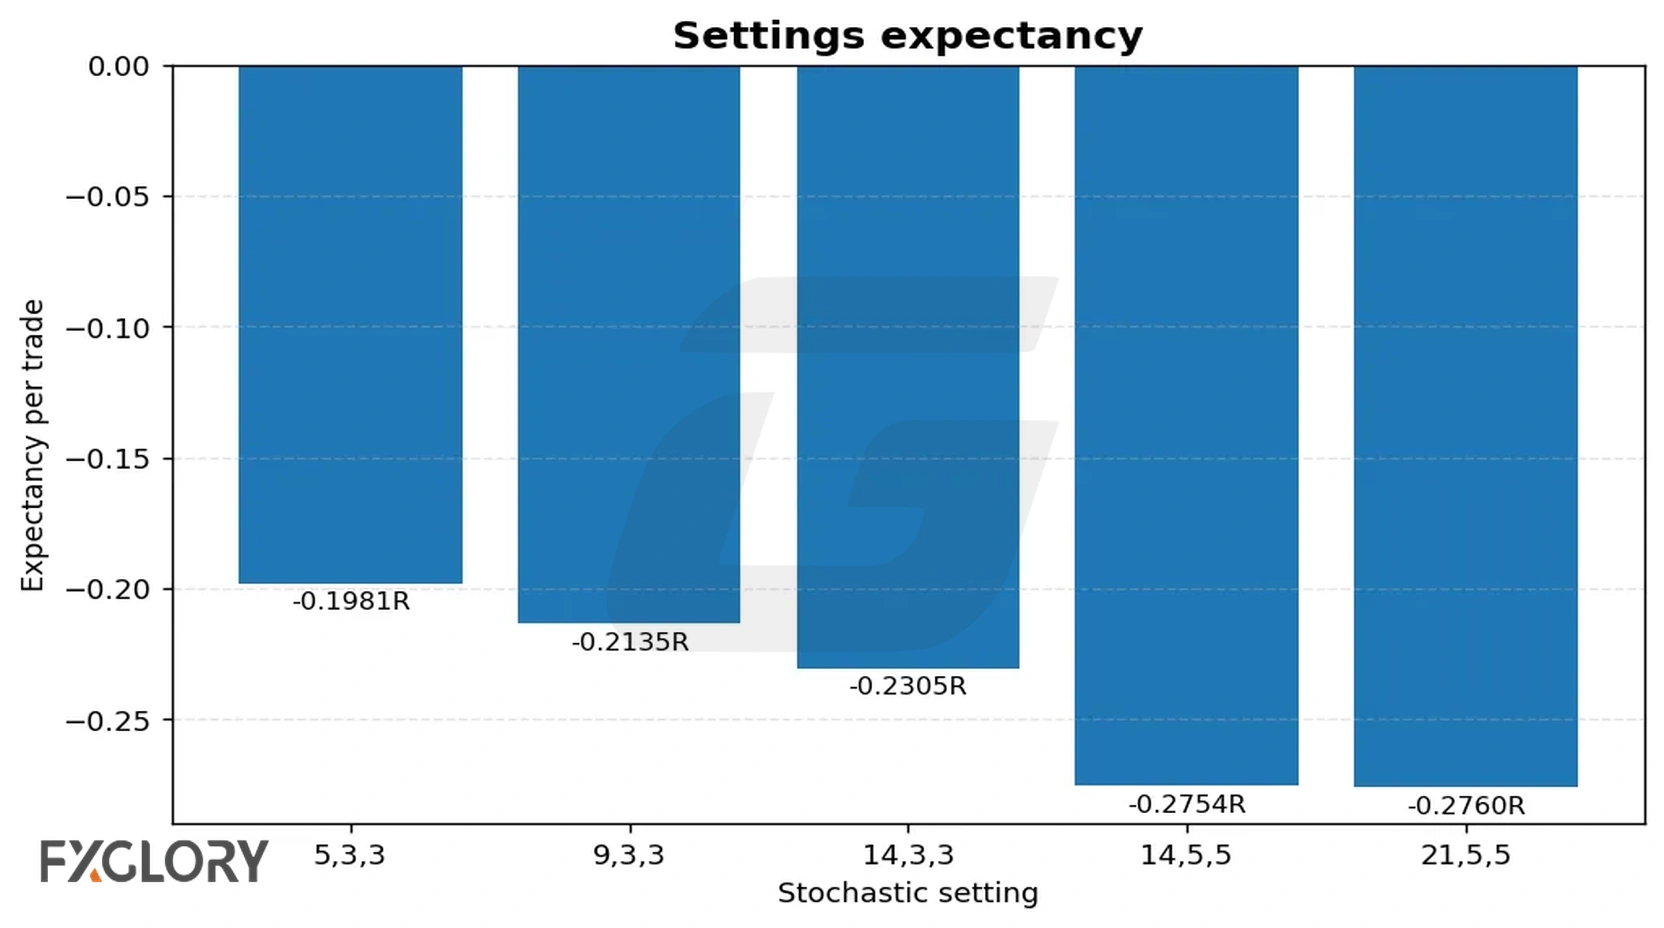
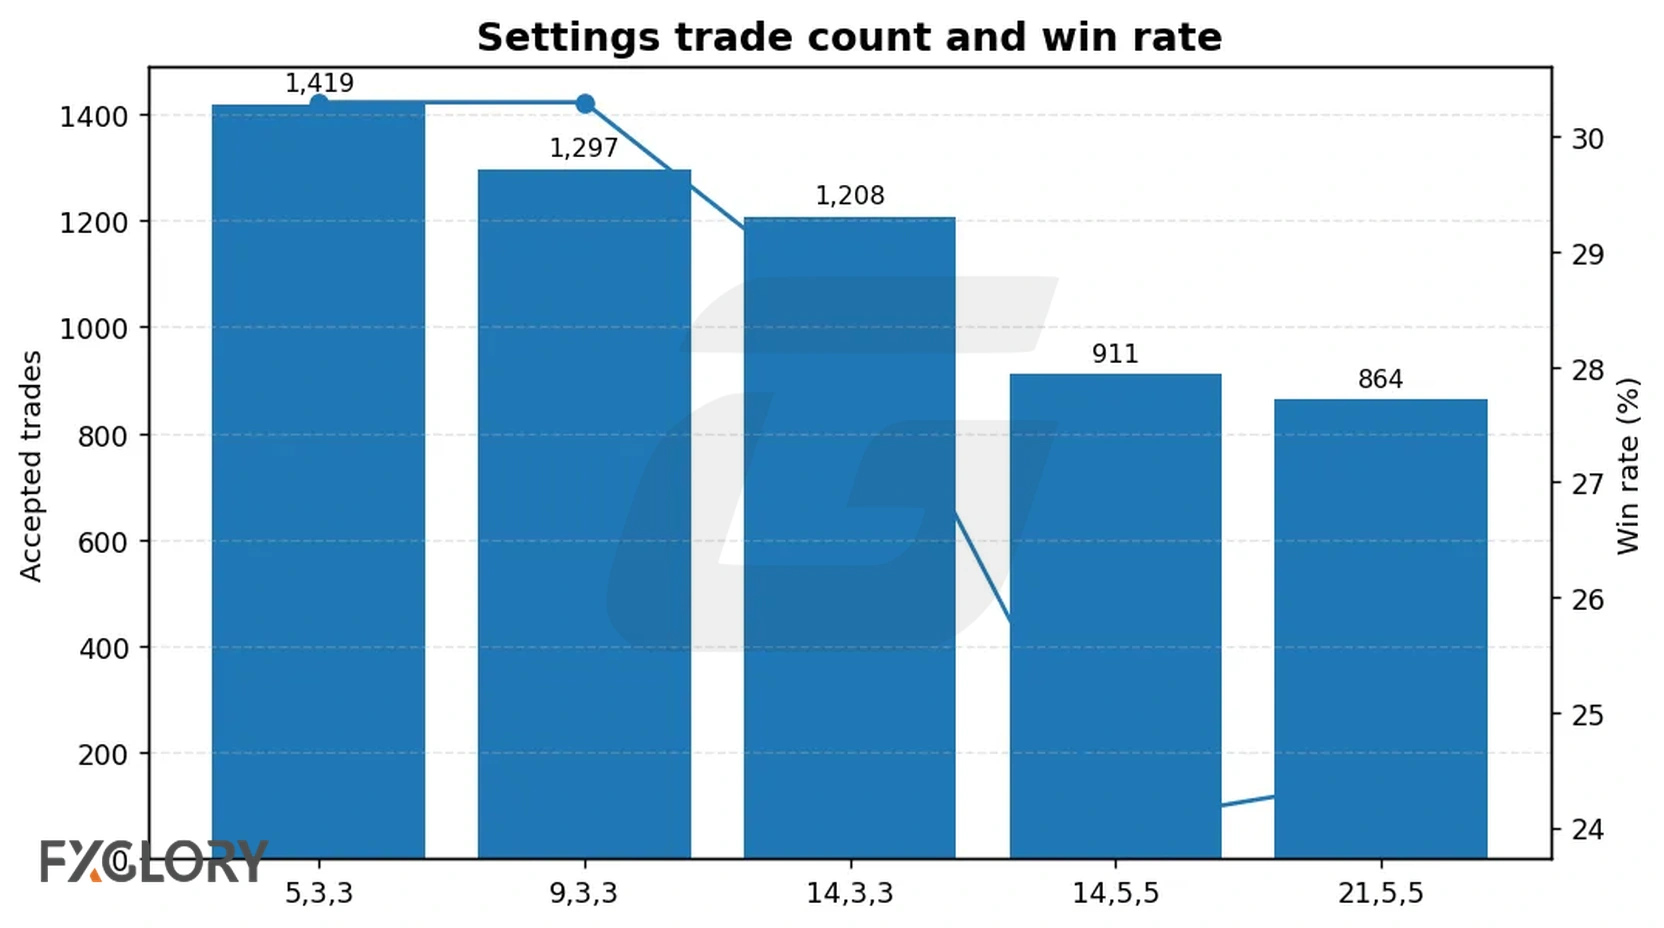
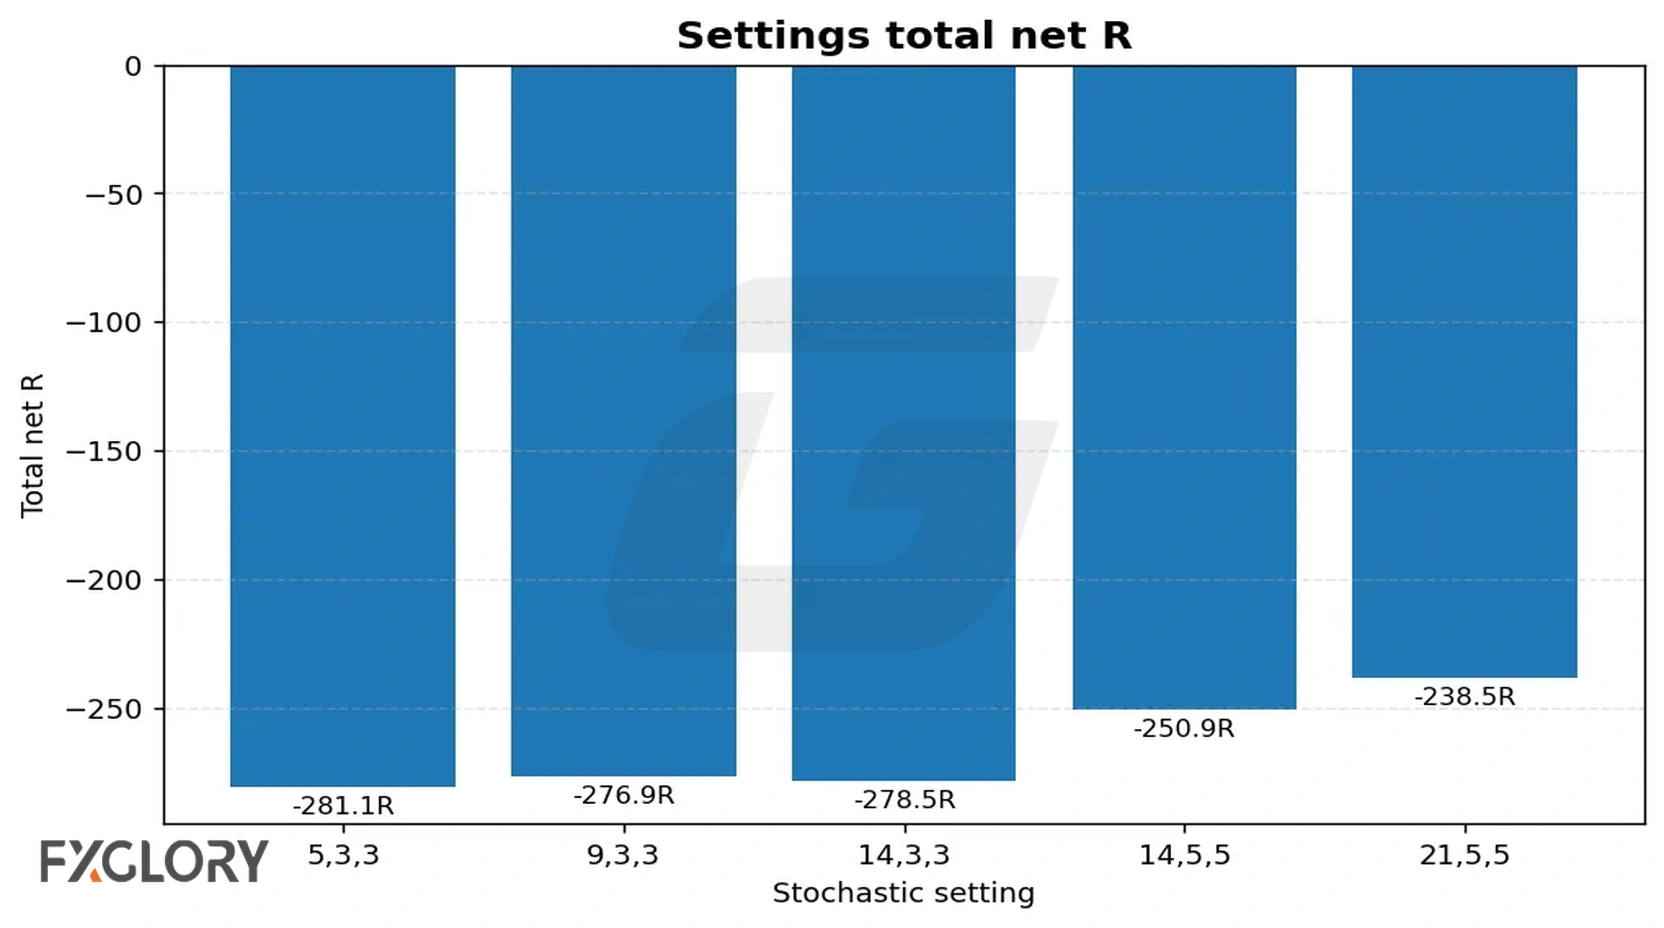
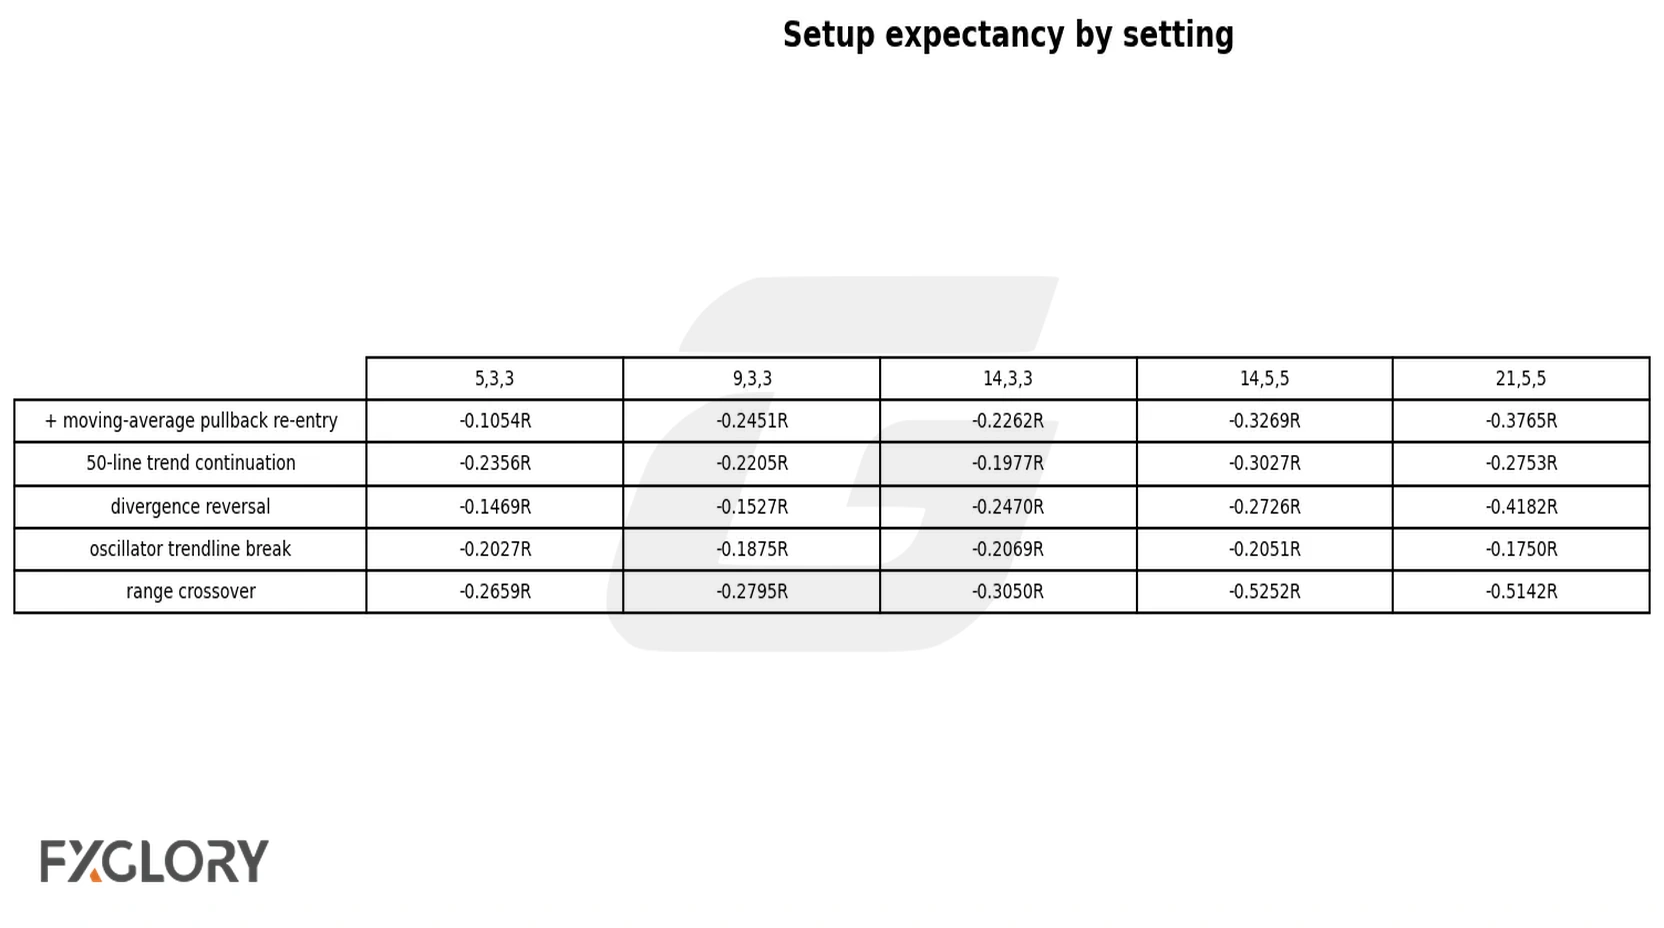
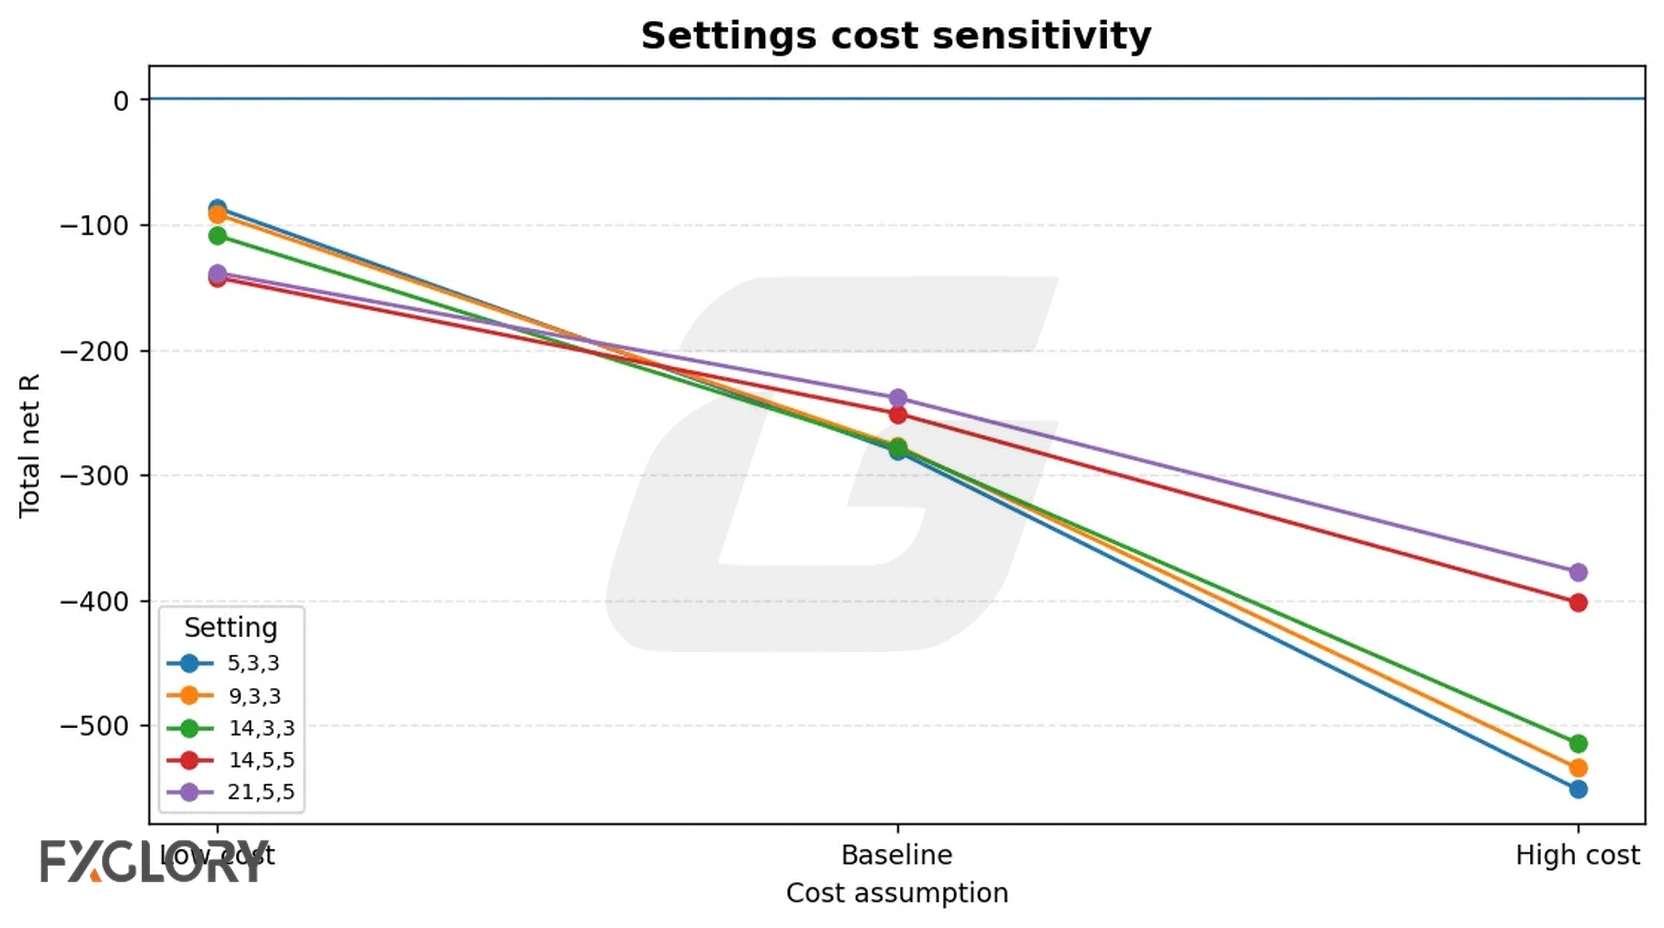
The settings result is important because it prevents a common mistake: blaming a failed Stochastic model only on the selected setting. In this test, changing the setting changed signal frequency and loss distribution, but it did not convert the rule framework into a positive model.
Stochastic Strategy Variations Not Included In The Baseline Test
The baseline and settings add-on focused on classic Stochastic setup families. The variations below are common research paths, but they were not proven by the results on this page. Each one needs a separate rule model and a separate test before it is treated as a strategy.
| Variation | How Traders Usually Use It | Why It Needs A Separate Test |
|---|---|---|
| Stochastic + MACD | Stochastic times the entry while MACD confirms momentum direction. | MACD confirmation can reduce signals but may delay entries; it changes both trade frequency and exit behavior. Review MACD Forex before testing it. |
| Stochastic + RSI | Both oscillators are used to avoid taking a Stochastic signal when RSI disagrees. | Two oscillators can create redundant confirmation instead of useful filtering. Compare with the RSI Forex Trading Strategy. |
| Stochastic + Bollinger Bands | Stochastic times entries near volatility-band extremes or range reactions. | Band width, squeeze, and outer-band behavior add volatility rules that are not part of this baseline. See the Bollinger Bands Forex Strategy. |
| Stochastic + Support/Resistance | 80/20 crosses are accepted only near defined support or resistance zones. | Zone selection must be objective; subjective levels can make results impossible to audit. Start with Support and Resistance in Forex. |
| Stochastic RSI | Stochastic logic is applied to RSI instead of price range closes. | It is a different oscillator and should not be mixed with classic Stochastic results. |
| Fast Stochastic scalping | Lower settings are used to trigger more frequent short-term entries. | More trades increase spread and slippage exposure; the 5,3,3 add-on was least negative, but still not positive. |
How FXGlory Tested The Forex Stochastic Strategy
The purpose of the backtest was not to prove that Stochastic is profitable. The purpose was to compare common Stochastic setup families under one controlled educational model.
| Backtest Item | Model Used |
|---|---|
| Pairs | EURUSD, GBPUSD, USDJPY, AUDUSD, USDCAD, USDCHF |
| Data | Public yfinance 15-minute OHLC data |
| Downloaded data window | 19 April 2026 23:00 UTC to 10 July 2026 06:00 UTC across the six pairs; EURUSD's last available 15-minute bar was 05:45 UTC on 10 July. |
| Context timeframe | 1H, resampled from 15M data |
| Setup timeframe | 15M |
| Baseline indicator | 14,3,3 slow Stochastic |
| Settings add-on | 5,3,3; 9,3,3; 14,3,3; 14,5,5; and 21,5,5 tested under the same educational framework |
| Trend filter | 100-period simple moving average when required by setup type |
| Stop logic | Setup candle, structure extreme, divergence pivot, or range reference plus 0.25 ATR(14) |
| Target | Fixed 1.3R target |
| Operating window | 07:00-18:59 UTC, with Friday setups after 16:00 UTC rejected |
| Baseline cost | 1.5-pip spread and 0.5-pip slippage per side |
| Position sizing | Measured in R; no account compounding or lot-size simulation |
Overall Backtest Results
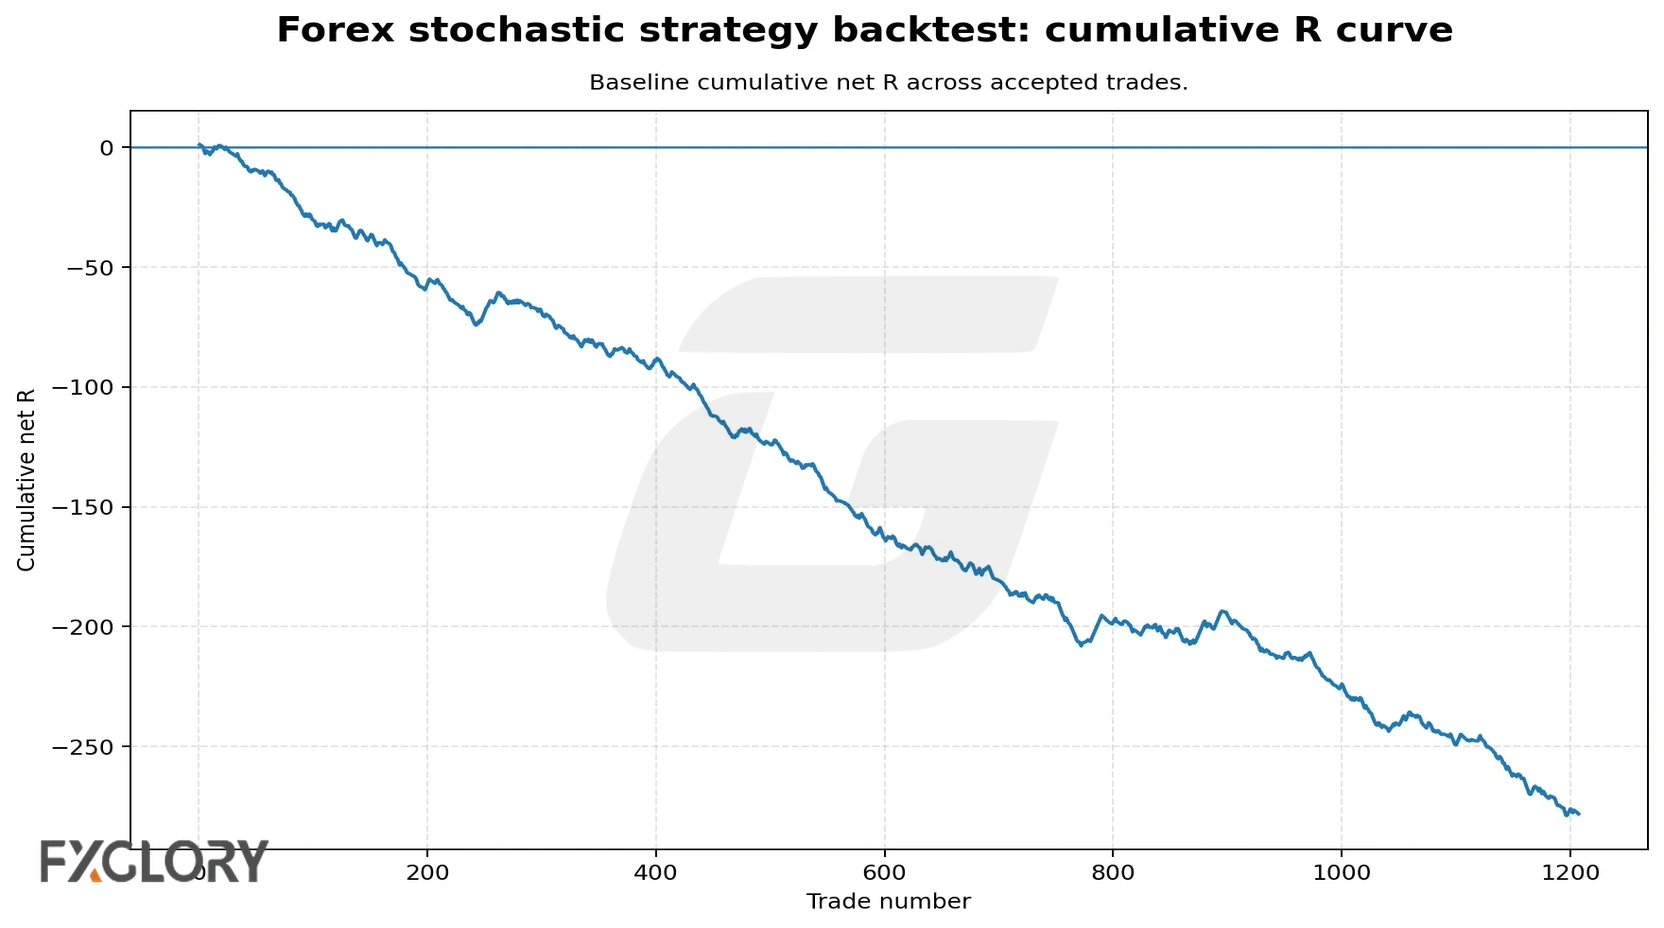
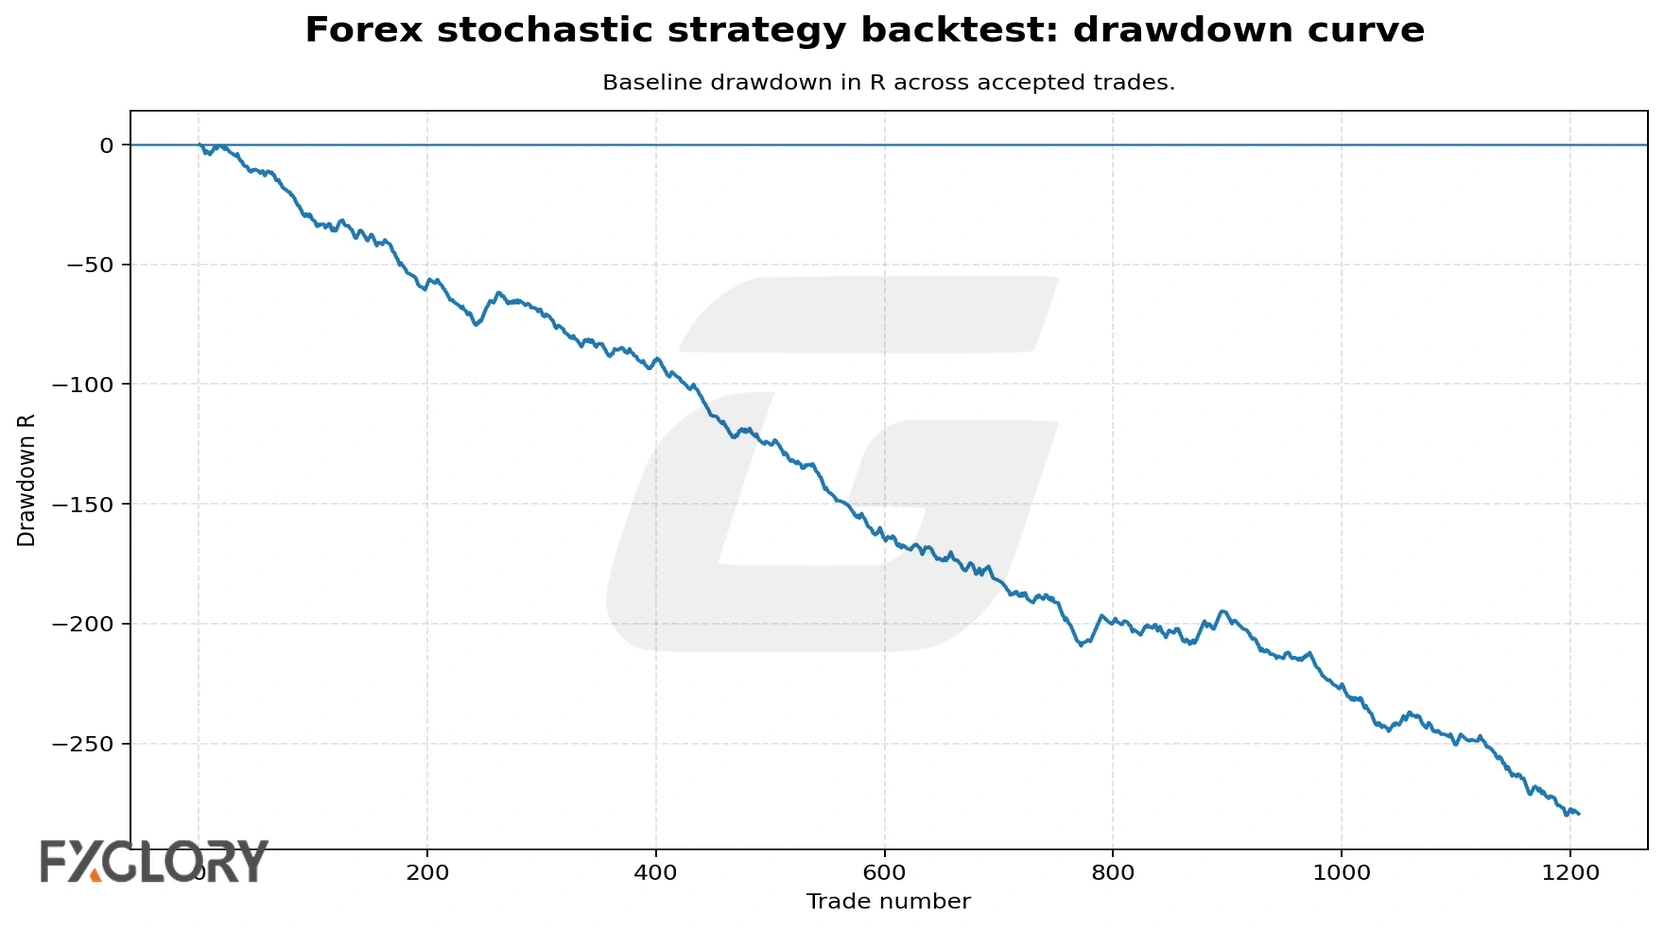
The tested Stochastic model did not pass the baseline test. Across 1207 accepted baseline trades, the strategy produced a 28.5% win rate, -0.2305R expectancy, 0.4952 profit factor, -280.0736R maximum drawdown, and -278.2249R total net result.
| Metric | Baseline Result |
|---|---|
| Accepted trades | 1207 |
| Win rate | 28.5% |
| Average win | 0.7935R |
| Average loss | -0.6387R |
| Expectancy | -0.2305R |
| Profit factor | 0.4952 |
| Total net result | -278.2249R |
| Maximum drawdown | -280.0736R |
| Worst losing streak | 21 trades |
| Invalidation exit rate | 53.6% |
Setup-Type Results
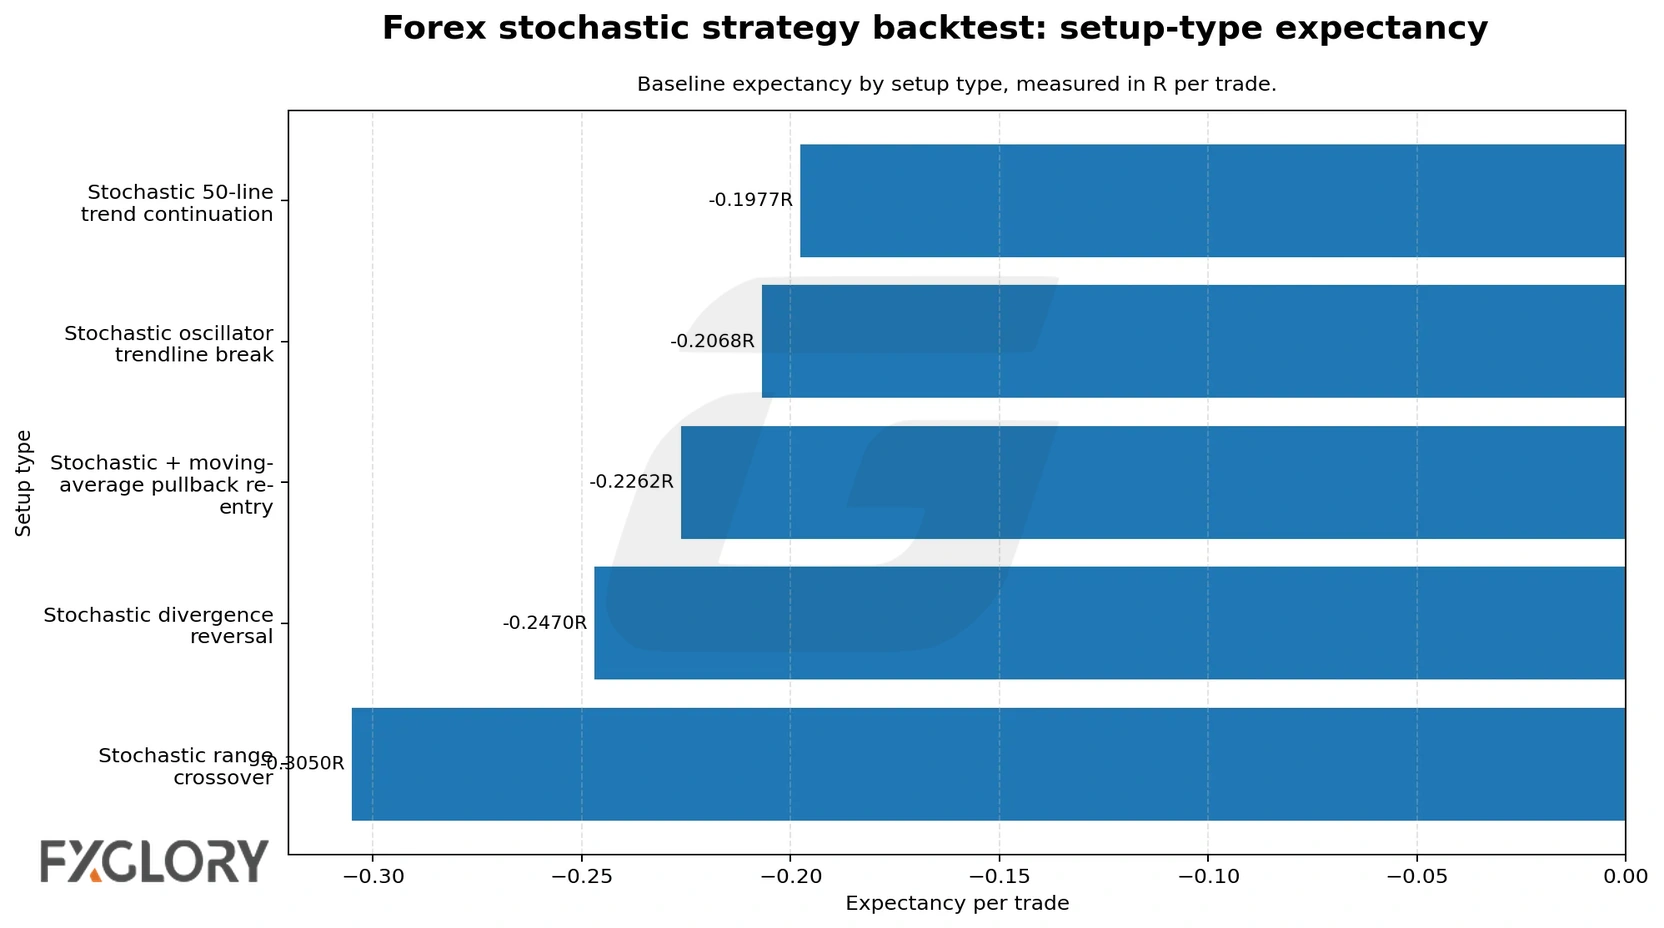
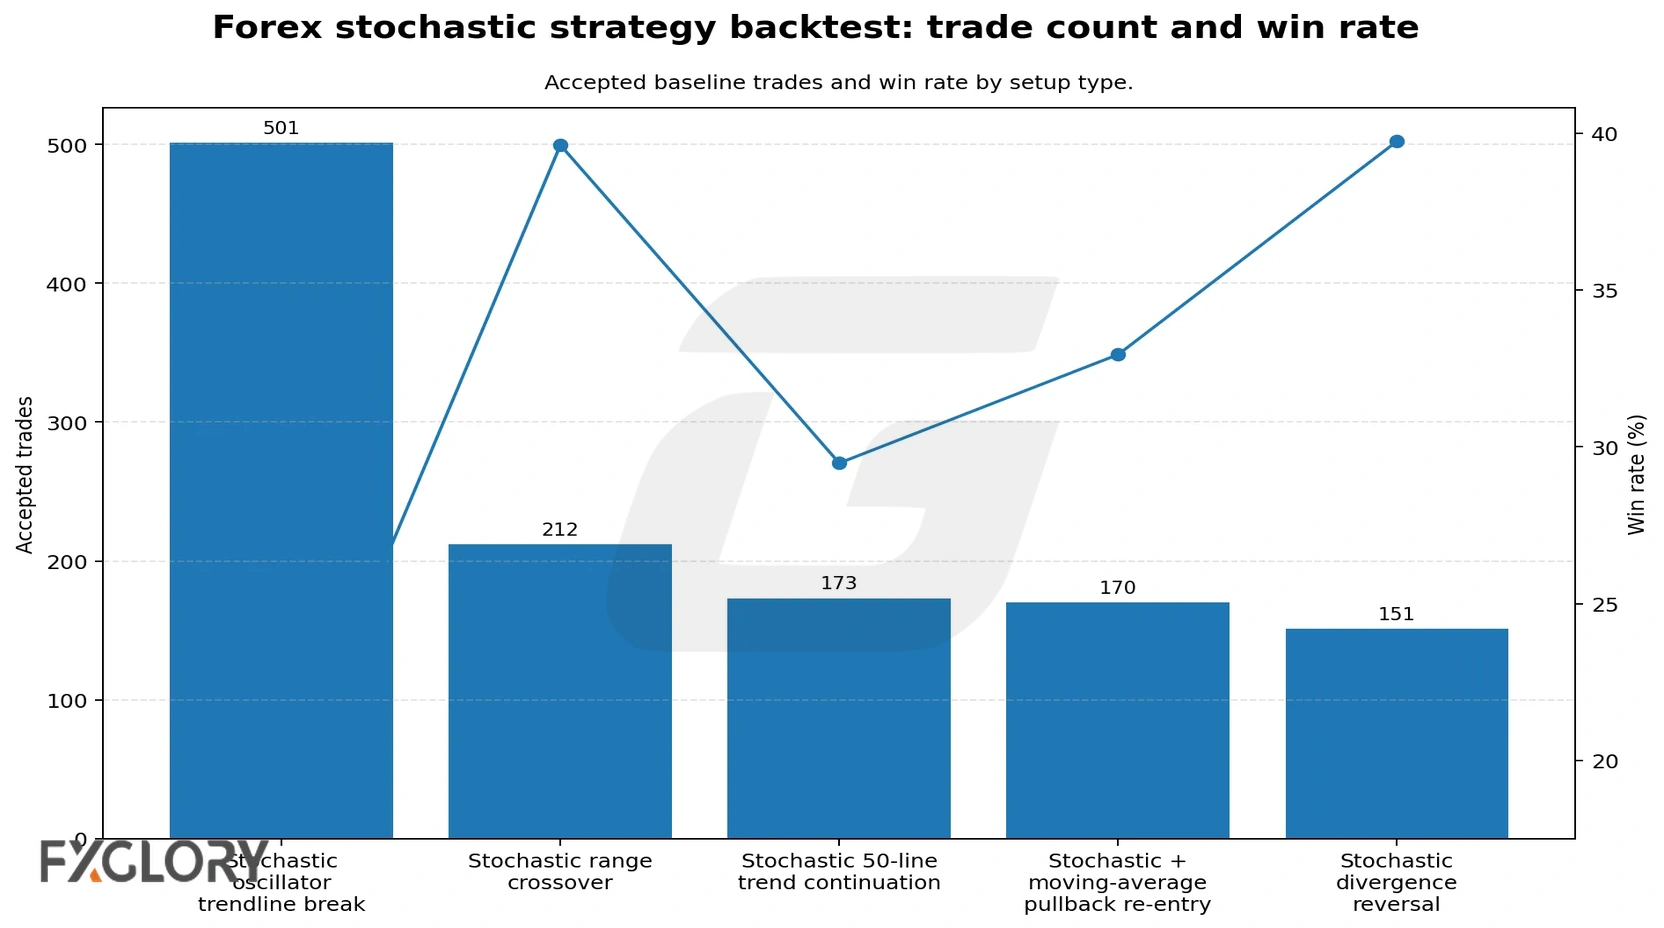
Setup-level results show how each Stochastic idea behaved under the same cost, stop, target, and session rules. The 50-line continuation setup was least negative by expectancy, divergence had the highest profit factor, and trendline break created the largest total loss.
| Setup Type | Trades | Win Rate | Expectancy | Profit Factor | Total Net R | Invalidation Exit Rate |
|---|---|---|---|---|---|---|
| Stochastic 50-line trend continuation | 173 | 29.48% | -0.1977R | 0.5242 | -34.1938R | 68.21% |
| Stochastic divergence reversal | 151 | 39.74% | -0.247R | 0.5739 | -37.3006R | 10.6% |
| Stochastic + moving-average pullback re-entry | 170 | 32.94% | -0.2262R | 0.5573 | -38.4623R | 50.0% |
| Stochastic range crossover | 212 | 39.62% | -0.305R | 0.535 | -64.6643R | 8.96% |
| Stochastic oscillator trendline break | 501 | 18.56% | -0.2068R | 0.3752 | -103.6039R | 81.64% |
Pair-Level Results
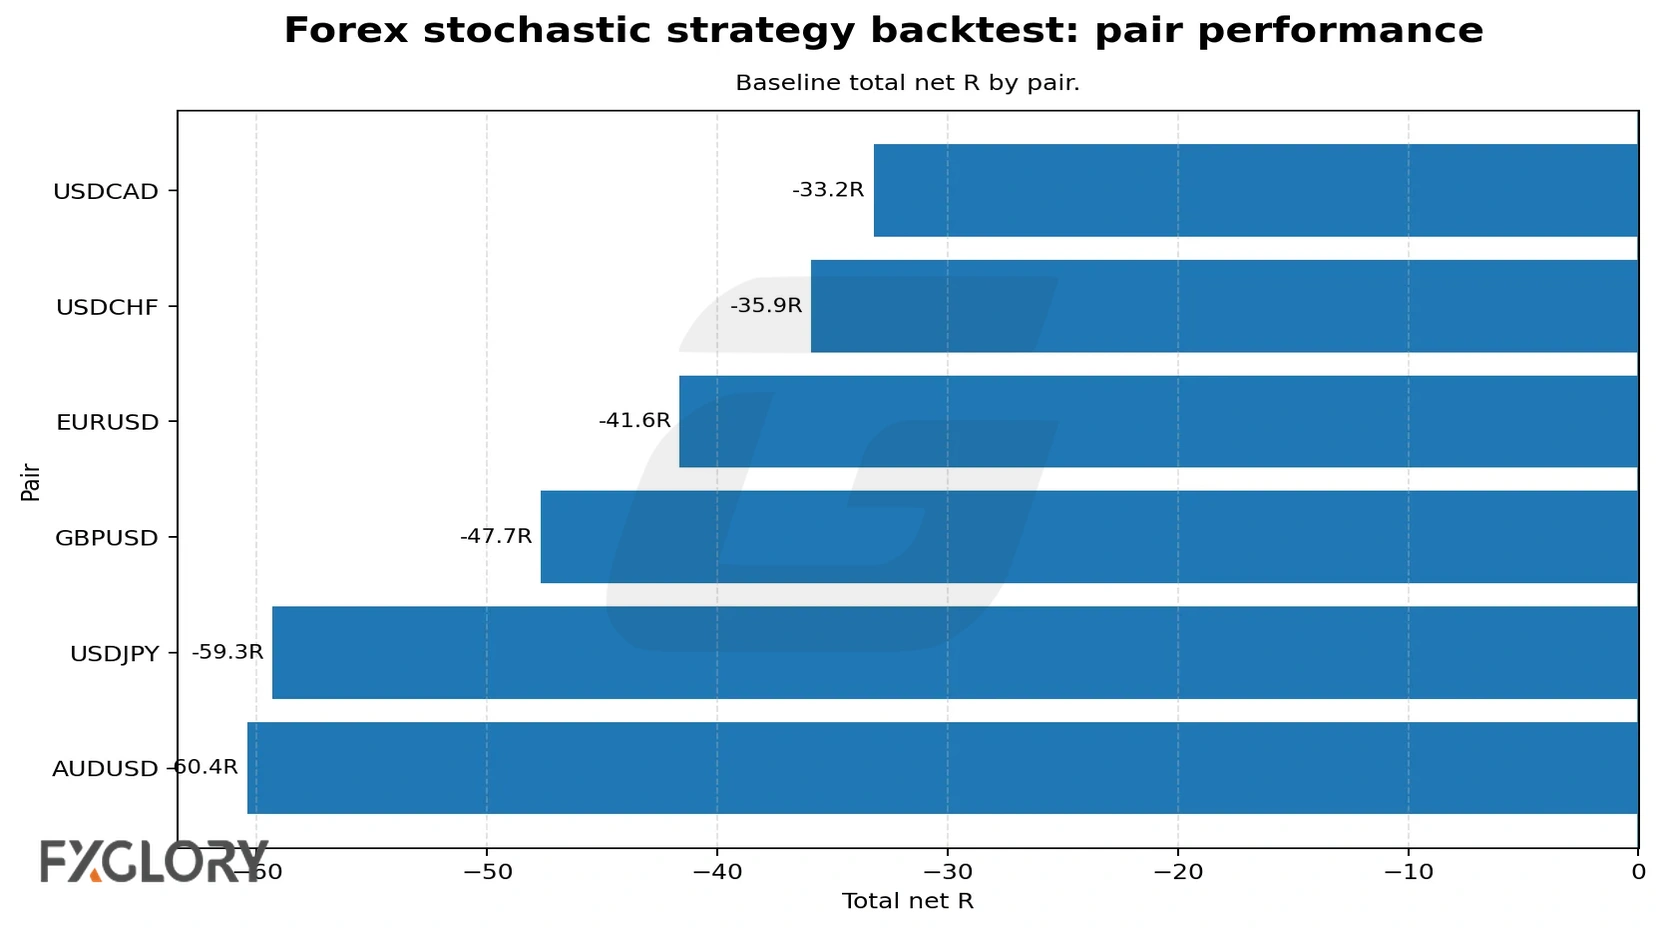
The same Stochastic rule model did not behave equally across currency pairs. USDCHF had the least negative expectancy at -0.1634R per trade, while AUDUSD and USDJPY were weaker by expectancy in this run. That difference matters because a trader should not assume that one oscillator setup transfers cleanly across all pairs.
| Pair | Trades | Win Rate | Expectancy | Profit Factor | Total Net R | Max Drawdown |
|---|---|---|---|---|---|---|
| AUDUSD | 192 | 25.52% | -0.3147R | 0.3735 | -60.4262R | -61.3787R |
| EURUSD | 184 | 32.07% | -0.2263R | 0.5221 | -41.6336R | -44.8677R |
| GBPUSD | 234 | 28.63% | -0.2037R | 0.5437 | -47.6657R | -49.6468R |
| USDCAD | 179 | 28.49% | -0.1856R | 0.5464 | -33.221R | -33.1024R |
| USDCHF | 220 | 29.09% | -0.1634R | 0.6011 | -35.9467R | -37.5768R |
| USDJPY | 198 | 27.27% | -0.2997R | 0.4055 | -59.3317R | -59.3689R |
Before applying the same method across many markets, review the available currency pairs and test whether spread, volatility, and session behavior change the setup.
Session Results
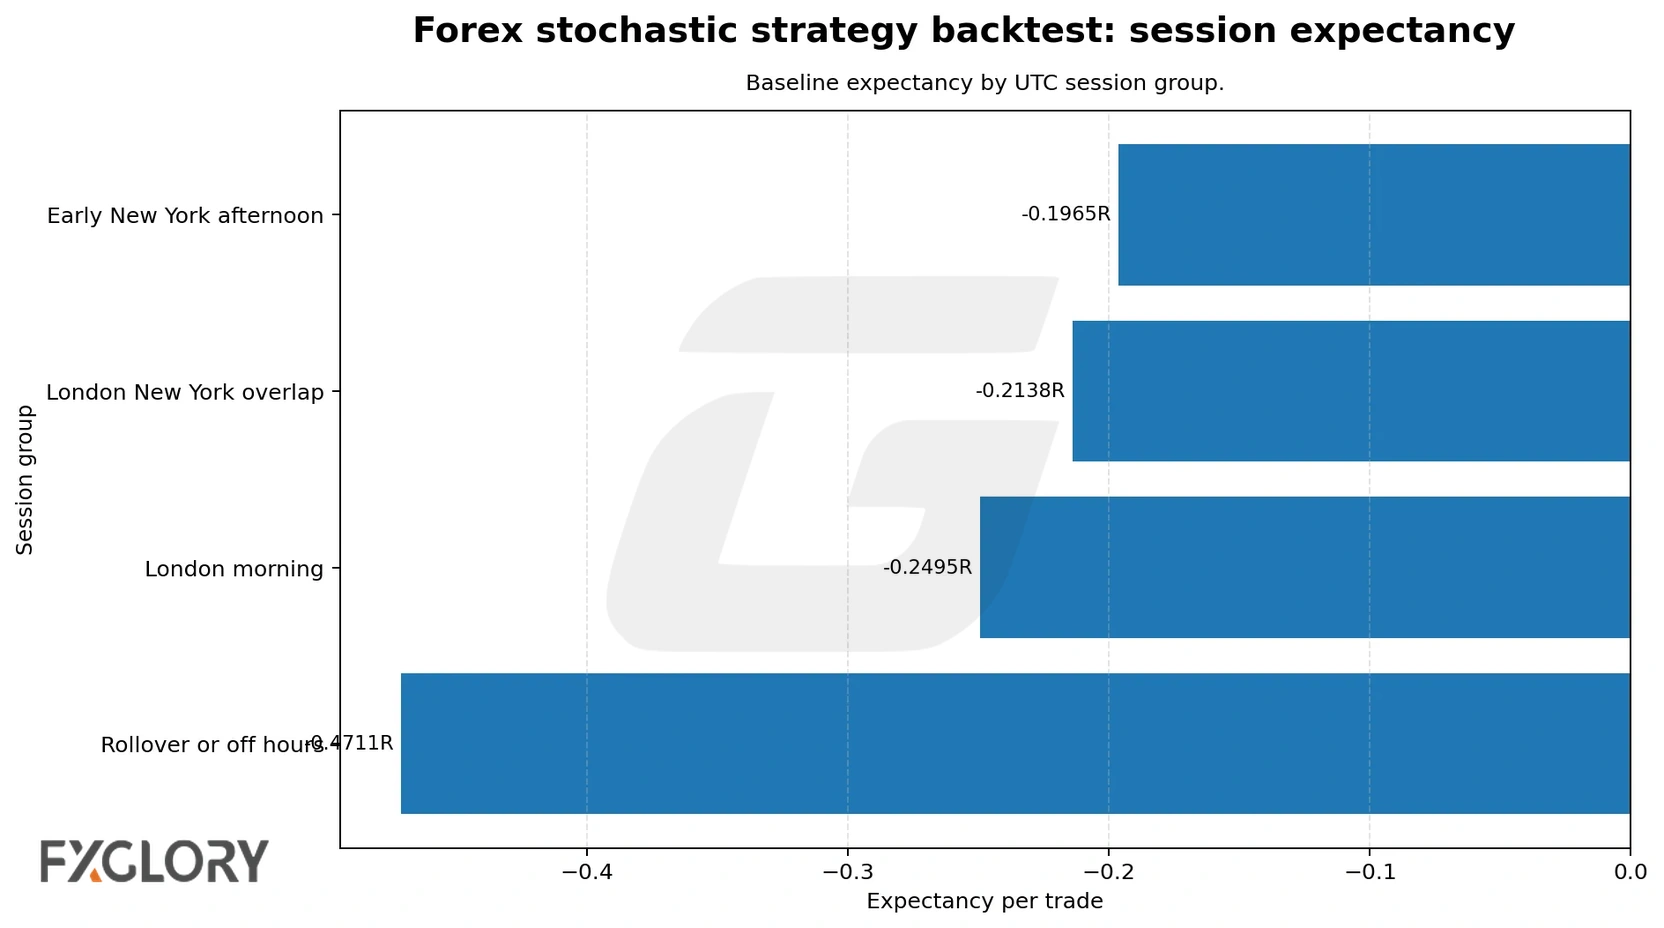
The session breakdown grouped entries by UTC time. The early New York afternoon group was least negative by expectancy, while rollover or off-hours performed worst. This does not mean one session is always better; it means Stochastic timing should be reviewed alongside liquidity, spread, volatility, and news-event timing.
| Session Group | Trades | Win Rate | Expectancy | Profit Factor | Total Net R |
|---|---|---|---|---|---|
| Early New York afternoon | 193 | 30.57% | -0.1965R | 0.4523 | -37.9292R |
| London New York overlap | 474 | 29.11% | -0.2138R | 0.5244 | -101.3325R |
| London morning | 521 | 27.64% | -0.2495R | 0.4961 | -130.0123R |
| Rollover or off hours | 19 | 15.79% | -0.4711R | 0.1776 | -8.9509R |
Spread And Slippage Sensitivity
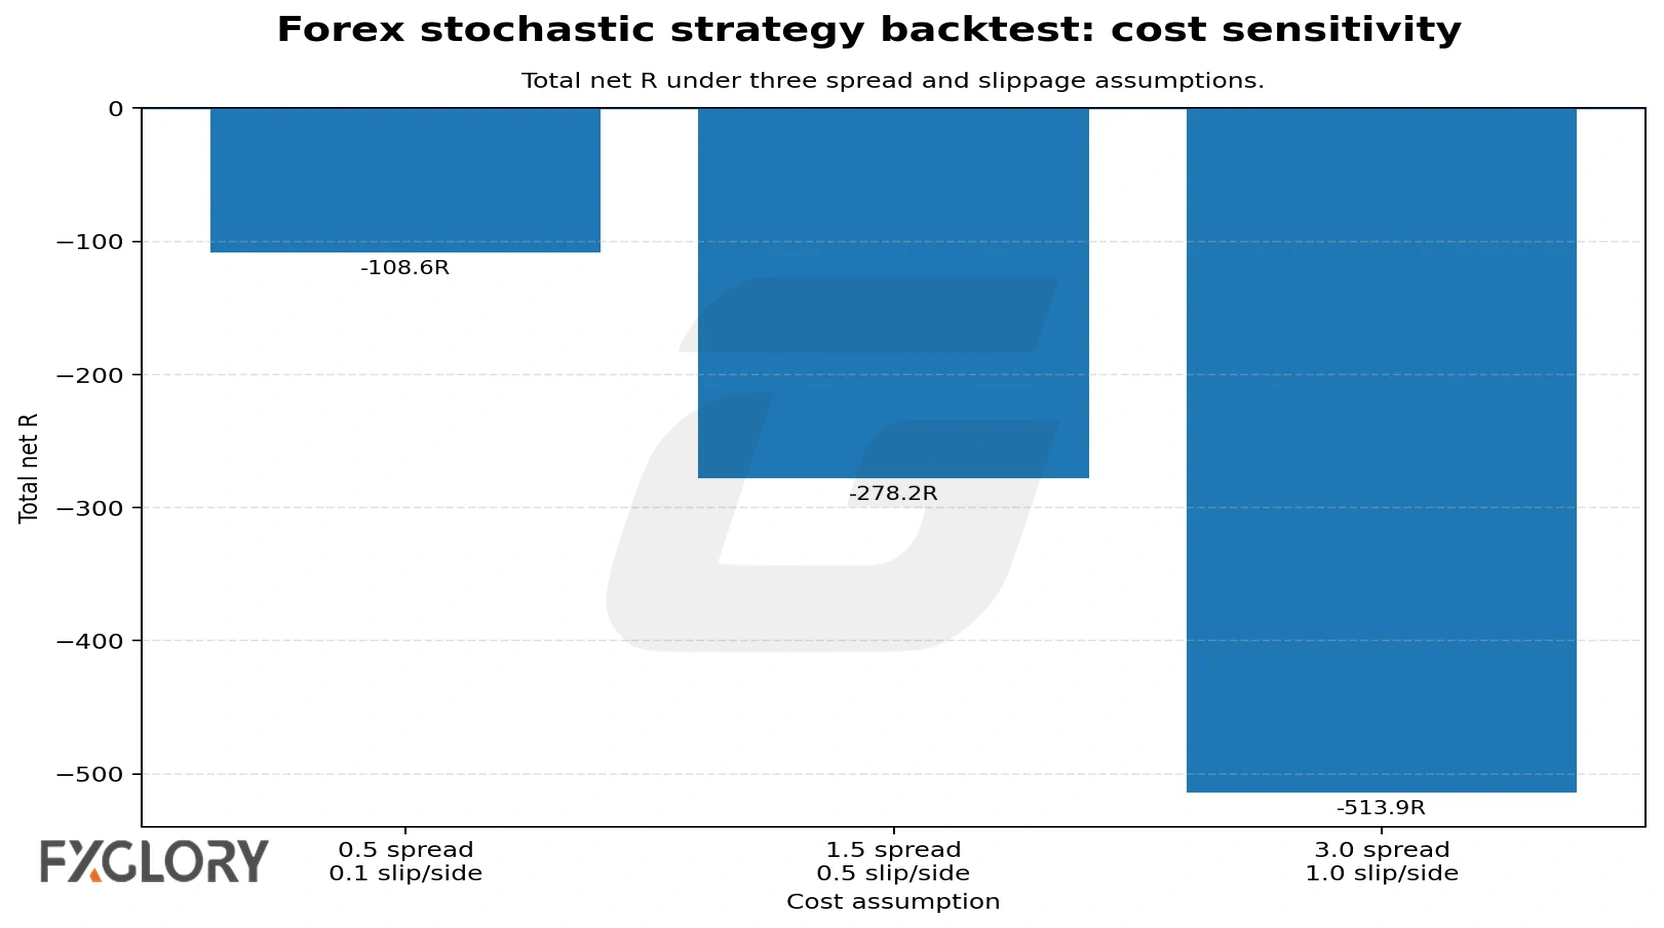
Short-term Stochastic strategies are sensitive to trading costs because many trades use relatively tight stops and short holding periods. In this test, the same strategy moved from -108.5631R under a low-cost assumption to -513.8662R under the high-cost assumption.
| Spread | Slippage | Trades | Win Rate | Expectancy | Profit Factor | Total Net R |
|---|---|---|---|---|---|---|
| 0.5 pips | 0.1 pips/side | 1207 | 30.9% | -0.0899R | 0.7515 | -108.5631R |
| 1.5 pips | 0.5 pips/side | 1207 | 28.5% | -0.2305R | 0.4952 | -278.2249R |
| 3.0 pips | 1.0 pips/side | 1207 | 25.1% | -0.4257R | 0.2837 | -513.8662R |
Use tools such as the FXGlory Margin Calculator before connecting stop distance, position size, leverage exposure, and account risk.
Practical Rules For Using Stochastic In Forex
- Do not sell only because Stochastic is above 80. In a strong uptrend, it can stay high while price keeps rising.
- Do not buy only because Stochastic is below 20. In a strong downtrend, it can stay low while price keeps falling.
- Separate trend setups from range setups. A crossover near a range boundary is different from a crossover against a trend.
- Use stop logic before entry. If the stop is too wide or too close, skip the setup instead of forcing it.
- Test costs. A Stochastic strategy that looks acceptable before spread and slippage may fail after realistic cost assumptions.
- Do not assume a setting change fixes a weak model. In the settings add-on, 5,3,3 was least negative, but no tested setting produced positive expectancy.
Final Takeaway
The tested baseline and every setting in the separate sensitivity add-on remained negative under their stated assumptions. The practical lesson is not that Stochastic universally works or fails, but that a Stochastic reading needs market context, a defined invalidation level, a pre-set stop and exit, and realistic trading costs before it can be evaluated as part of a strategy.