
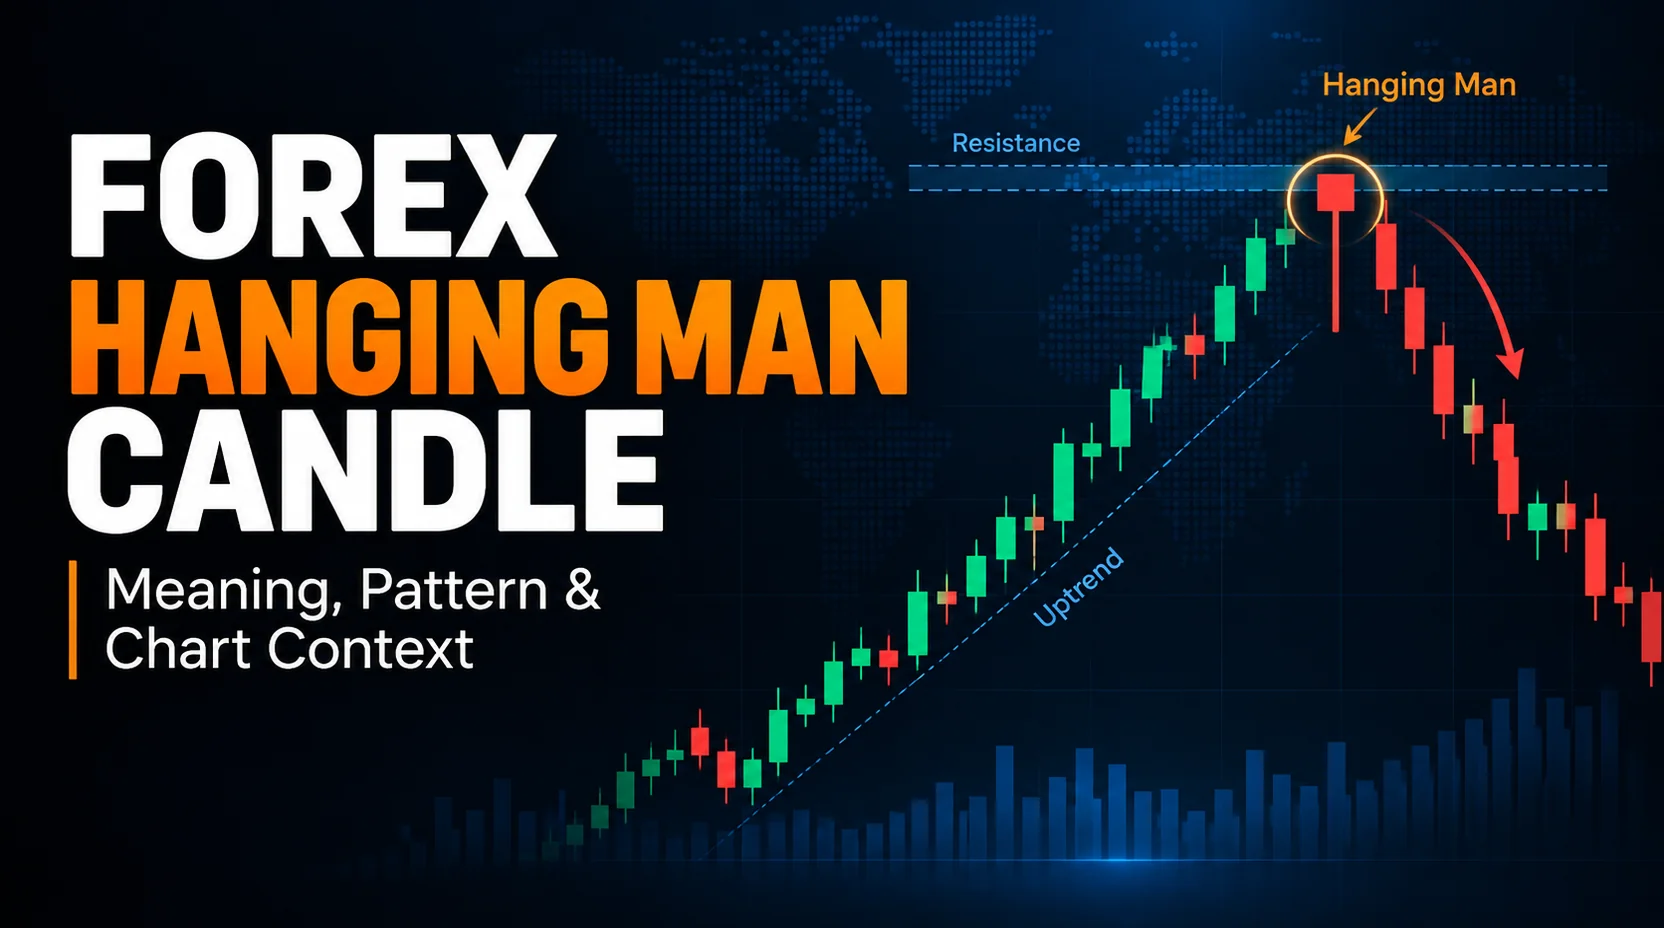
What Is A Hanging Man Forex Candle?
A hanging man forex candle is a candlestick with a small body near the upper part of the candle range and a long lower wick. It usually has little or no upper wick and is conventionally identified after an advance.
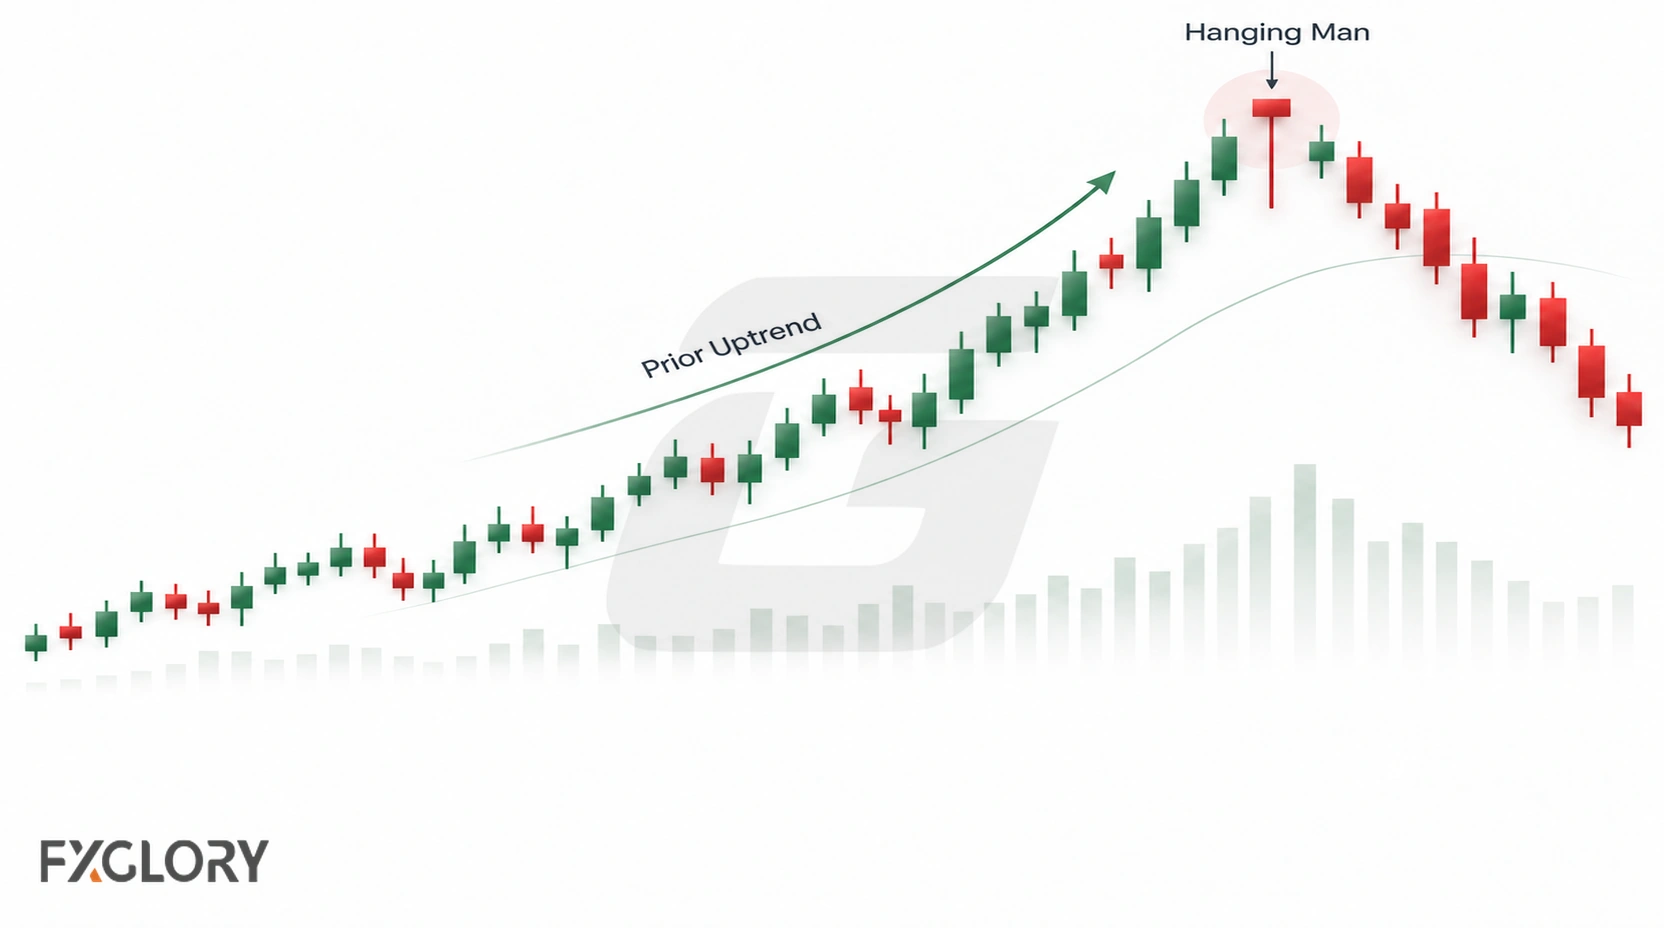
A hanging man candlestick in forex should be judged by its small upper-positioned body, long lower wick, prior buying pressure, chart location, and completed candle close.
The completed candle shows a move below the body and a close back near the upper end of its range. That observation alone neither identifies who initiated the move nor confirms a bearish reversal.
A hanging man does not confirm that price will reverse. It is a possible warning candle after a rise. The useful question is whether the prior move, chart location, candle structure, and follow-up movement make the formation worth reviewing.
If you need the basic candle parts first, review the open, close, body, and wick relationship. A hanging man uses those same parts, but its message depends mainly on the small body near the top, the long lower wick, and the prior buying context.
Hanging Man Candle Anatomy
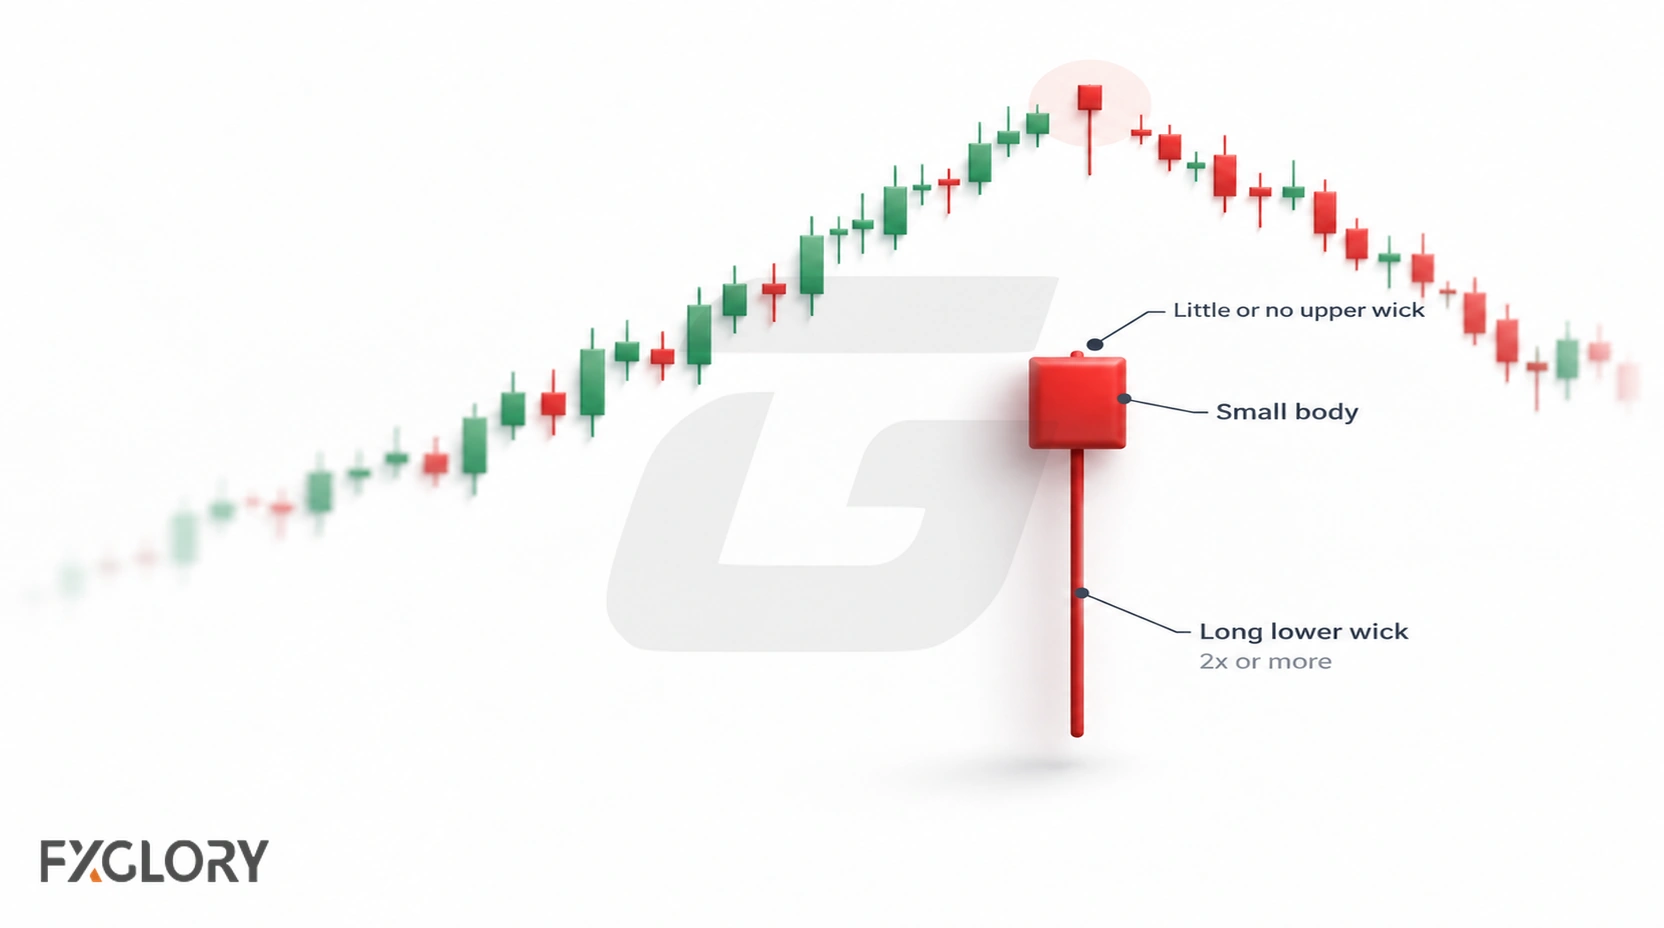
The anatomy of a hanging man has three main parts: a small body near the upper part of the candle, a long lower wick, and little or no upper wick. The body can close bullish or bearish, but body color is usually less important than structure and context.
| Hanging Man Part | What It Shows | Reading Caution |
|---|---|---|
| Small body near the top | The candle opened and closed near the upper part of its range. | A small body alone does not make a hanging man. |
| Long lower wick | Price moved lower during the candle but did not close near the low. | The wick should be clearly longer than the body. |
| Little or no upper wick | Price did not spend much range above the body. | A large upper wick can weaken the hanging man shape. |
| Close location | Price finished near the upper part of the candle range. | The close should be reviewed with what price does afterward. |
| Full candle range | The distance between the candle high and low. | A very wide candle may reflect news or unstable volatility. |
A clean hanging man usually has a lower wick that is much longer than the body. A common visual guideline is a lower shadow at least twice the real-body height, but this is not a universal cutoff or evidence of forecasting accuracy.
Why the Prior Rise Matters
The same lower-wick shape has a different conventional name depending on what precedes it. After an established advance it may be called a Hanging Man; after a decline, a similar candle may be called a Hammer. A single higher-price test without a meaningful preceding advance is less decisive context for this classification.
A recent swing high, resistance zone, or upper range boundary can make the candle more relevant to a potential bearish scenario, but location does not confirm that scenario.
What the Lower Wick Shows
The lower shadow records the distance from the candle low to the lower of its open and close. Price traded below the body during the candle and finished nearer the upper end of the range. The completed OHLC candle cannot establish the intrabar sequence or which participants caused each price movement.
After an advance, some traders interpret the excursion lower as evidence that selling pressure may be emerging. That is a hypothesis rather than confirmed seller control: the close itself is well above the low. Subsequent price action is needed to assess a bearish scenario.
Bullish and Bearish Hanging Man Bodies
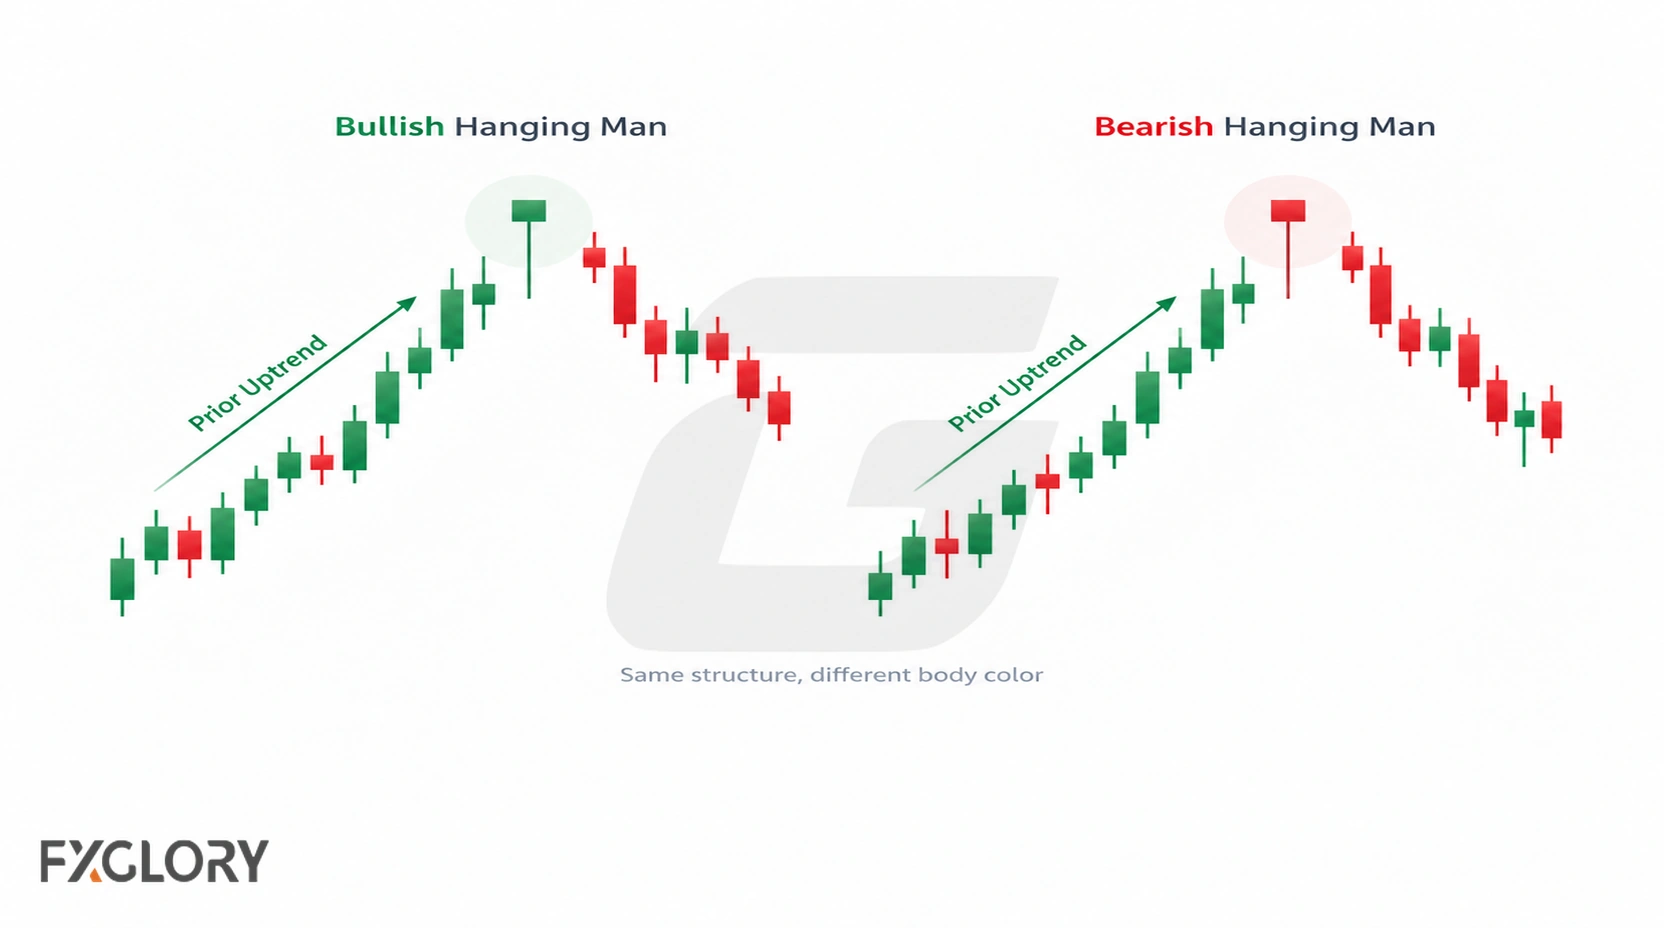
A Hanging Man can close slightly above its open (bullish body) or below it (bearish body). Either colour can fit if the real body remains small, near the upper range, with a pronounced lower shadow. A near-zero body may overlap with a Dragonfly Doji description. Candle colour does not itself confirm or rule out a reversal.
Hanging Man vs Hammer
The hanging man and hammer are easy to confuse because they can look almost identical. Both can have a small body near the upper part of the candle range, a long lower wick, and little or no upper wick.
The main difference is prior chart context. A hanging man is usually reviewed after buying pressure or a rise. A hammer is usually reviewed after selling pressure or a decline. The same shape can therefore carry a different reading depending on what happened before it.
| Candle | Main Shape | Usually Reviewed After | Main Reading Difference |
|---|---|---|---|
| Hanging man | Small body near top with long lower wick. | Buying pressure, rise, or higher-price test. | Lower-price test after buying pressure. |
| Hammer | Small body near top with long lower wick. | Selling pressure, decline, or lower-price test. | Lower-wick rejection after selling pressure. |
For the lower-wick candle that appears after selling pressure, use the hammer candle guide. The shape may look similar, but the location changes the reading.
Hanging Man vs Shooting Star
The hanging man and shooting star are both often reviewed after buying pressure, but they do not have the same wick structure.
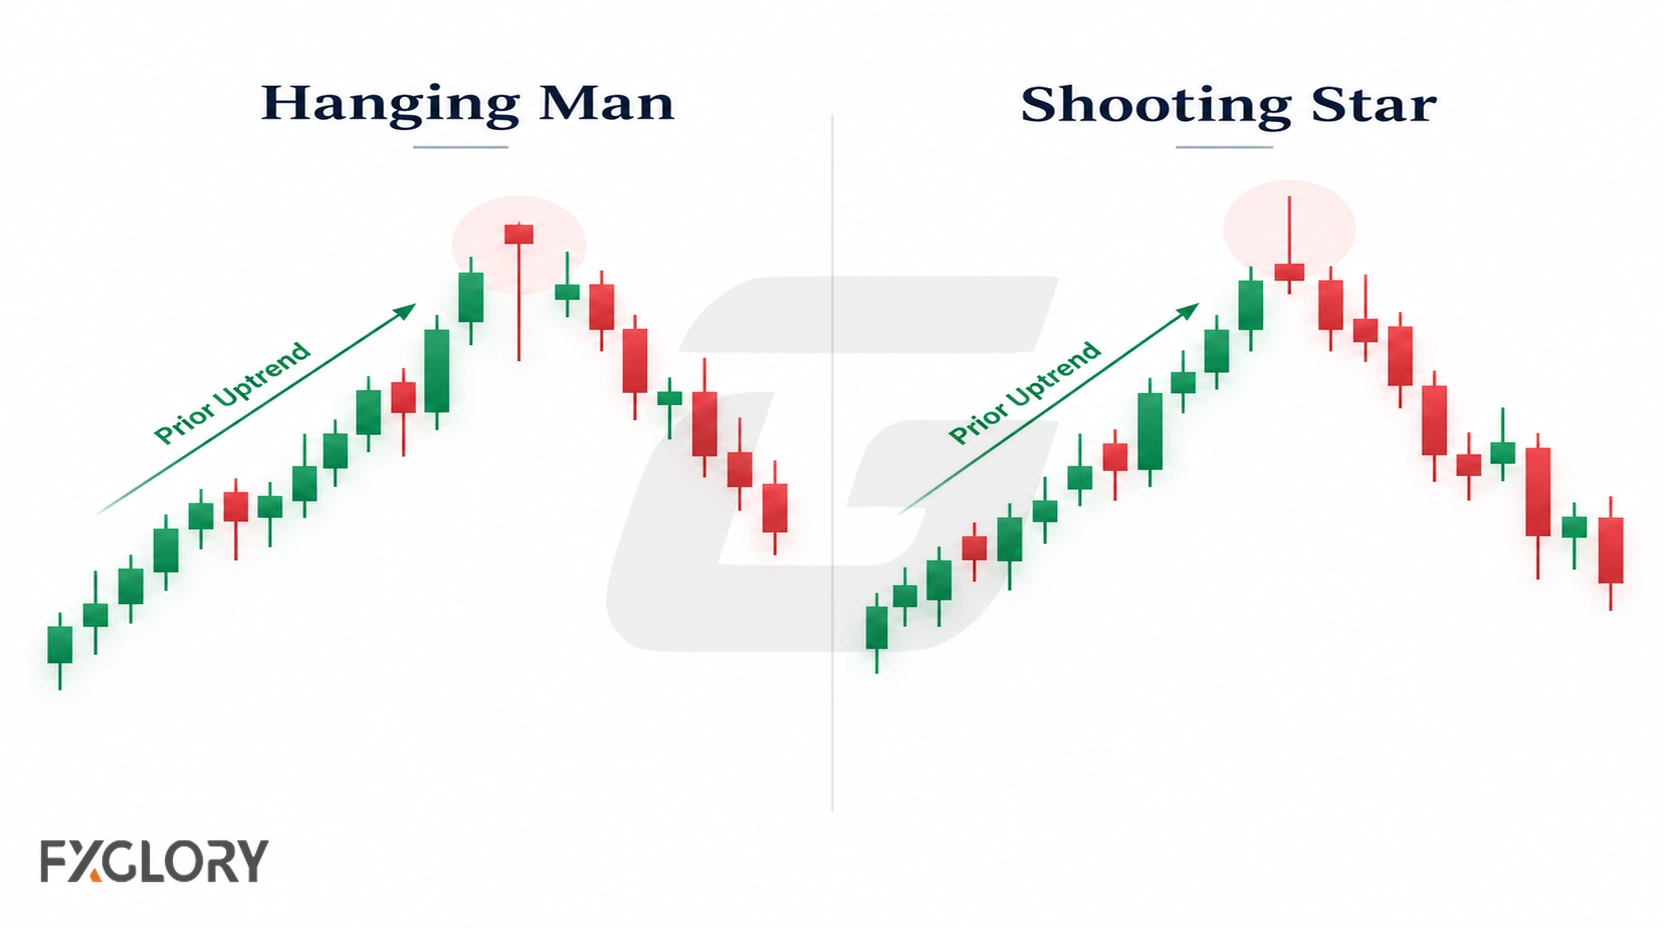
A hanging man has a long lower wick and a small body near the upper part of the candle range. A shooting star has a long upper wick and a small body near the lower part of the range. The hanging man shows a lower-price test that recovered before the close. The shooting star shows a higher-price test that did not hold into the close.
| Candle | Main Shape | Usually Reviewed After | Main Reading Difference |
|---|---|---|---|
| Hanging man | Small body near top with long lower wick. | Buying pressure or rise. | Price tested lower levels but recovered near the close. |
| Shooting star | Small body near bottom with long upper wick. | Buying pressure or rise. | Price tested higher levels but closed away from the high. |
For the upper-wick candle usually reviewed after buying pressure, use the shooting star guide.
Hanging Man vs Similar Forex Candles
A hanging man can overlap visually with several candles. Comparing them helps avoid forcing the wrong label onto the chart.
| Candle | Main Structure | Main Difference From Hanging Man |
|---|---|---|
| Pin bar | Long dominant wick and smaller body. | Pin bar is a broader long-wick rejection idea, not only this specific context. |
| Doji | Open and close are equal or almost equal. | Doji focuses on open-close balance, not specifically a lower-wick test after buying pressure. |
| Spinning top | Small visible body with upper and lower wicks. | Spinning top shows two-sided hesitation rather than a cleaner lower-wick structure. |
For deeper comparison, review the lower-wick hammer structure, upper-wick shooting star structure, long-wick rejection candles, open-close balance candles, and two-sided hesitation candles.
Chart Location and Interpretation
A Hanging Man is most relevant after a discernible advance. Resistance, a previous swing high, or the upper edge of a trading range can provide a level against which to assess later movement. In the middle of an overlapping range, the same candle may have little interpretive value.
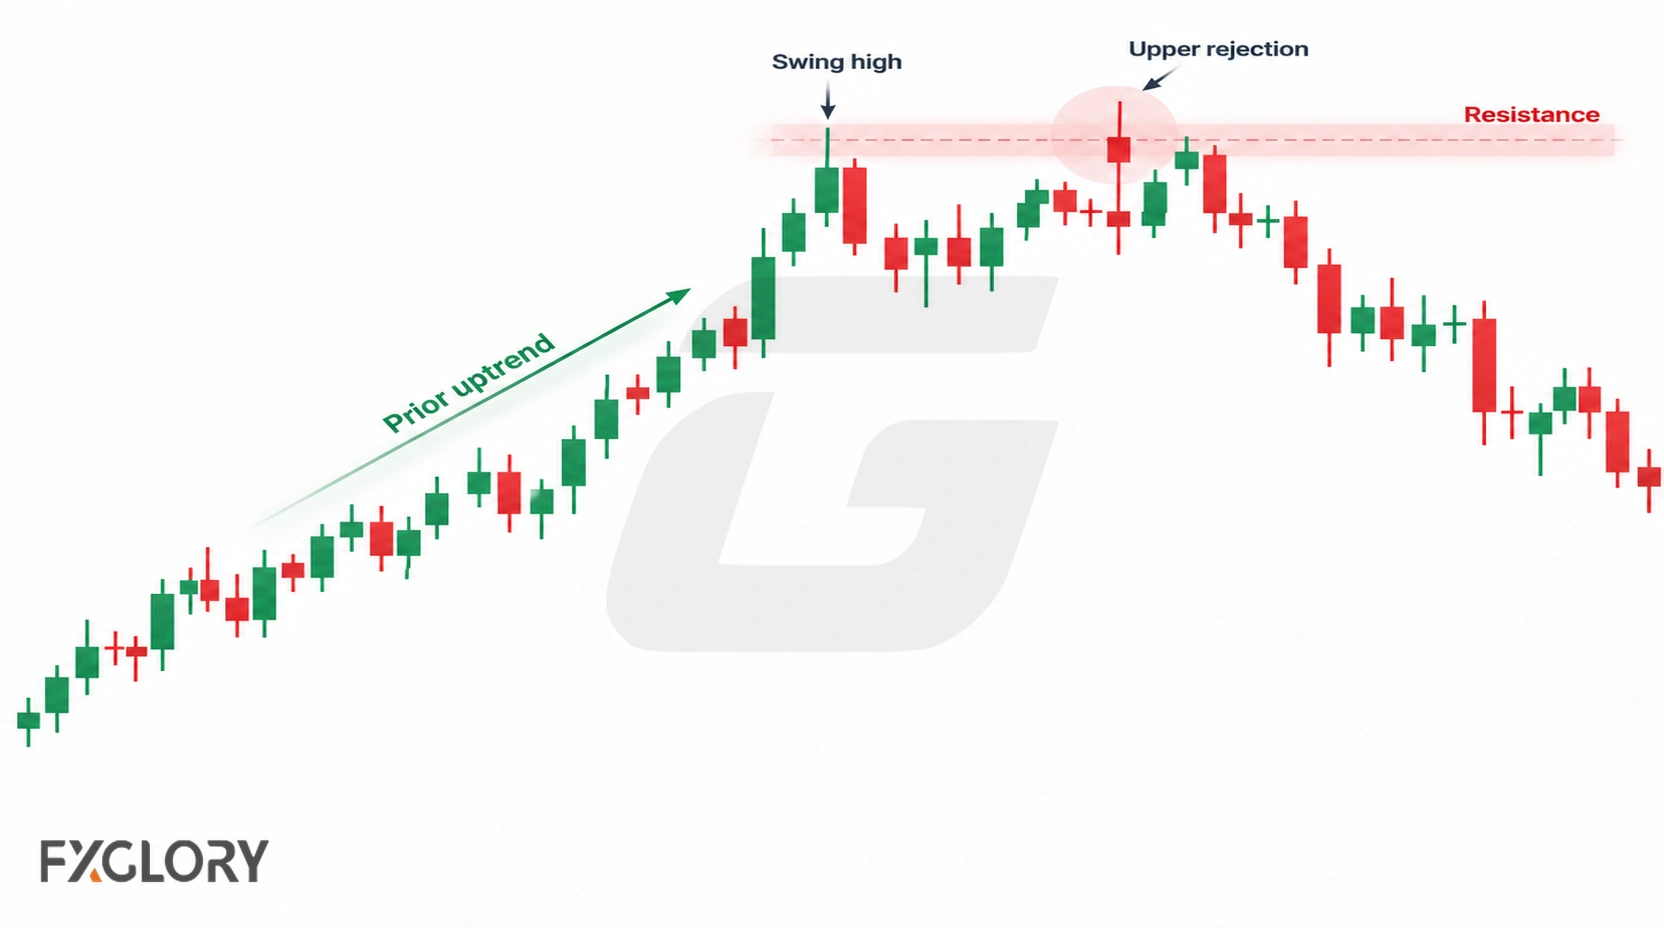
Contexts to compare
- After a clear rise: Assess whether the advance remains intact after the candle.
- Near resistance or a swing high: Review later closes relative to the level, without assuming it will hold.
- Near the top of a range: Compare price response with the upper range boundary.
- After volatile news or during thin liquidity: Interpret the wick cautiously; pricing and execution conditions may differ from normal sessions.
For chart observation, compare GBP/USD around visible swing highs or gold during wider candle ranges. These pages are not trading signals.
How to Identify and Interpret a Hanging Man
Use a completed candle to identify the shape first. Evaluate possible bearish confirmation and any trade plan separately.
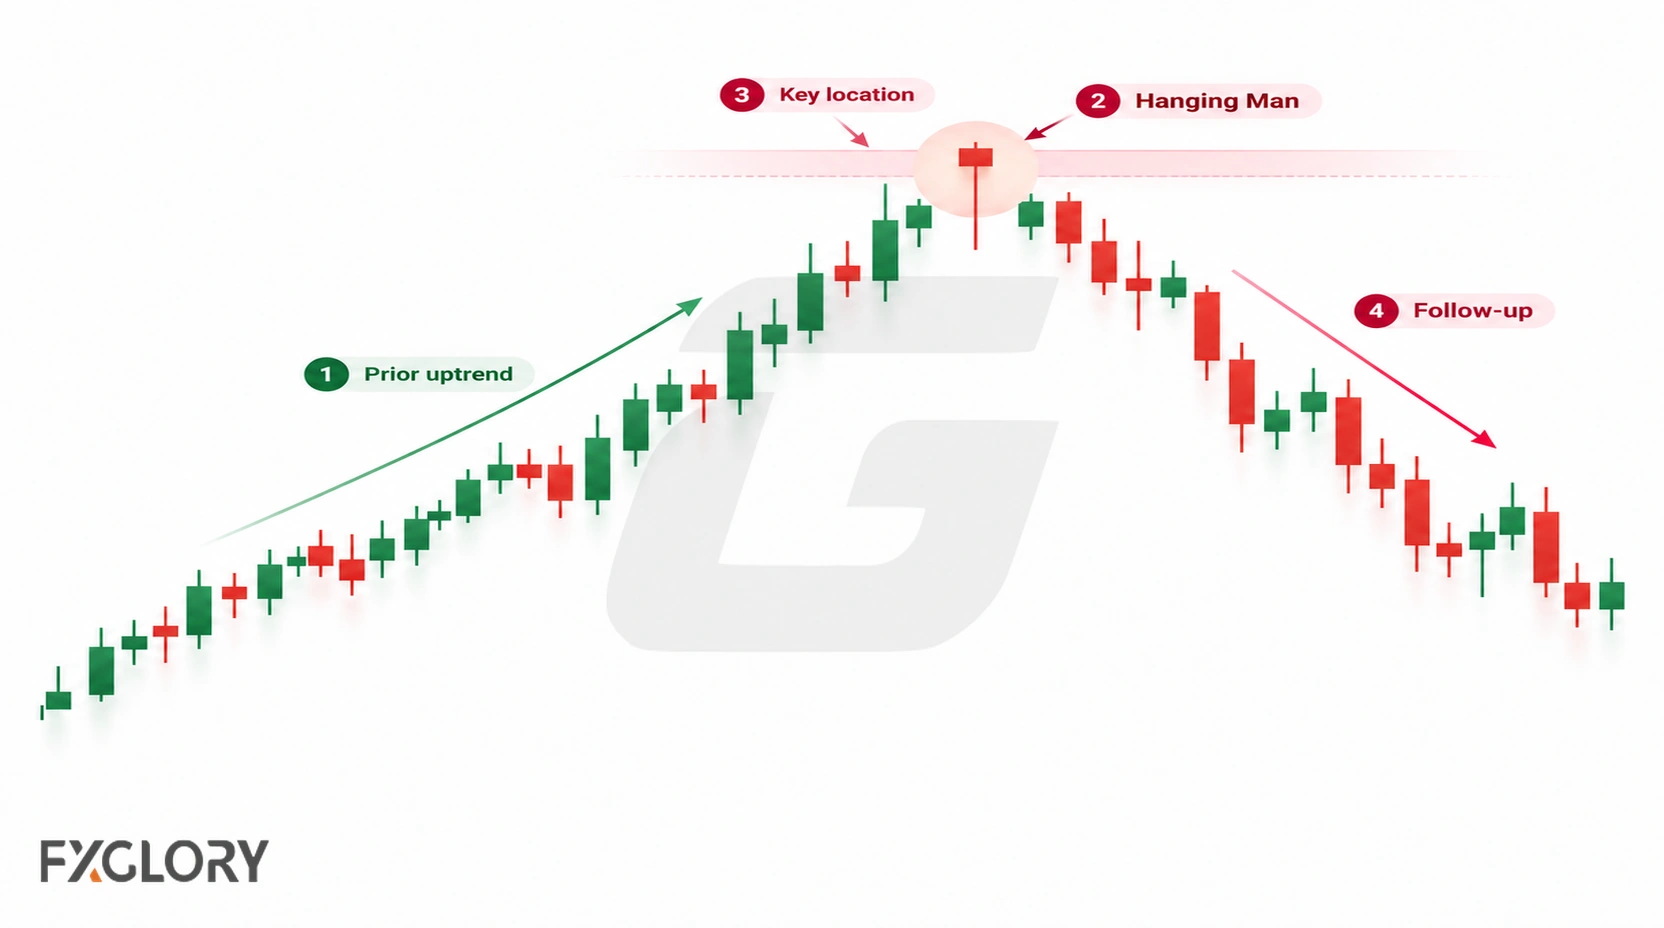
- Identify the prior move: Look for a meaningful rise before the candle, not merely a similar wick shape.
- Check the completed structure: Small upper-positioned body, pronounced lower shadow and little upper shadow; note that the twice-the-body rule is only a guideline.
- Locate the candle: Mark nearby resistance, swing highs or range boundaries and review spread, liquidity and news conditions.
- Define what bearish confirmation would mean: For example, a subsequent completed close below a specified nearby low is different from a temporary intrabar dip. A break, close, retest and follow-through are not interchangeable.
- Assess a trade separately: Entry, stop logic, invalidation conditions, position sizing and transaction costs belong to a trade plan, not the candlestick definition.
Some traders compare hanging man candles with technical indicators for additional context. For example, RSI can add momentum context, ATR can add volatility context, and Bollinger Bands can help review range and expansion conditions. These tools can support candle review, but they do not remove trading risk.
Spot forex volume is generally venue- or broker-specific. Activity measures or indicators can add context but do not independently confirm a reversal.
Invalid Candidates vs Failed Bearish Readings
A candle that only resembles a Hanging Man is different from a properly identified Hanging Man that is not followed by falling prices.
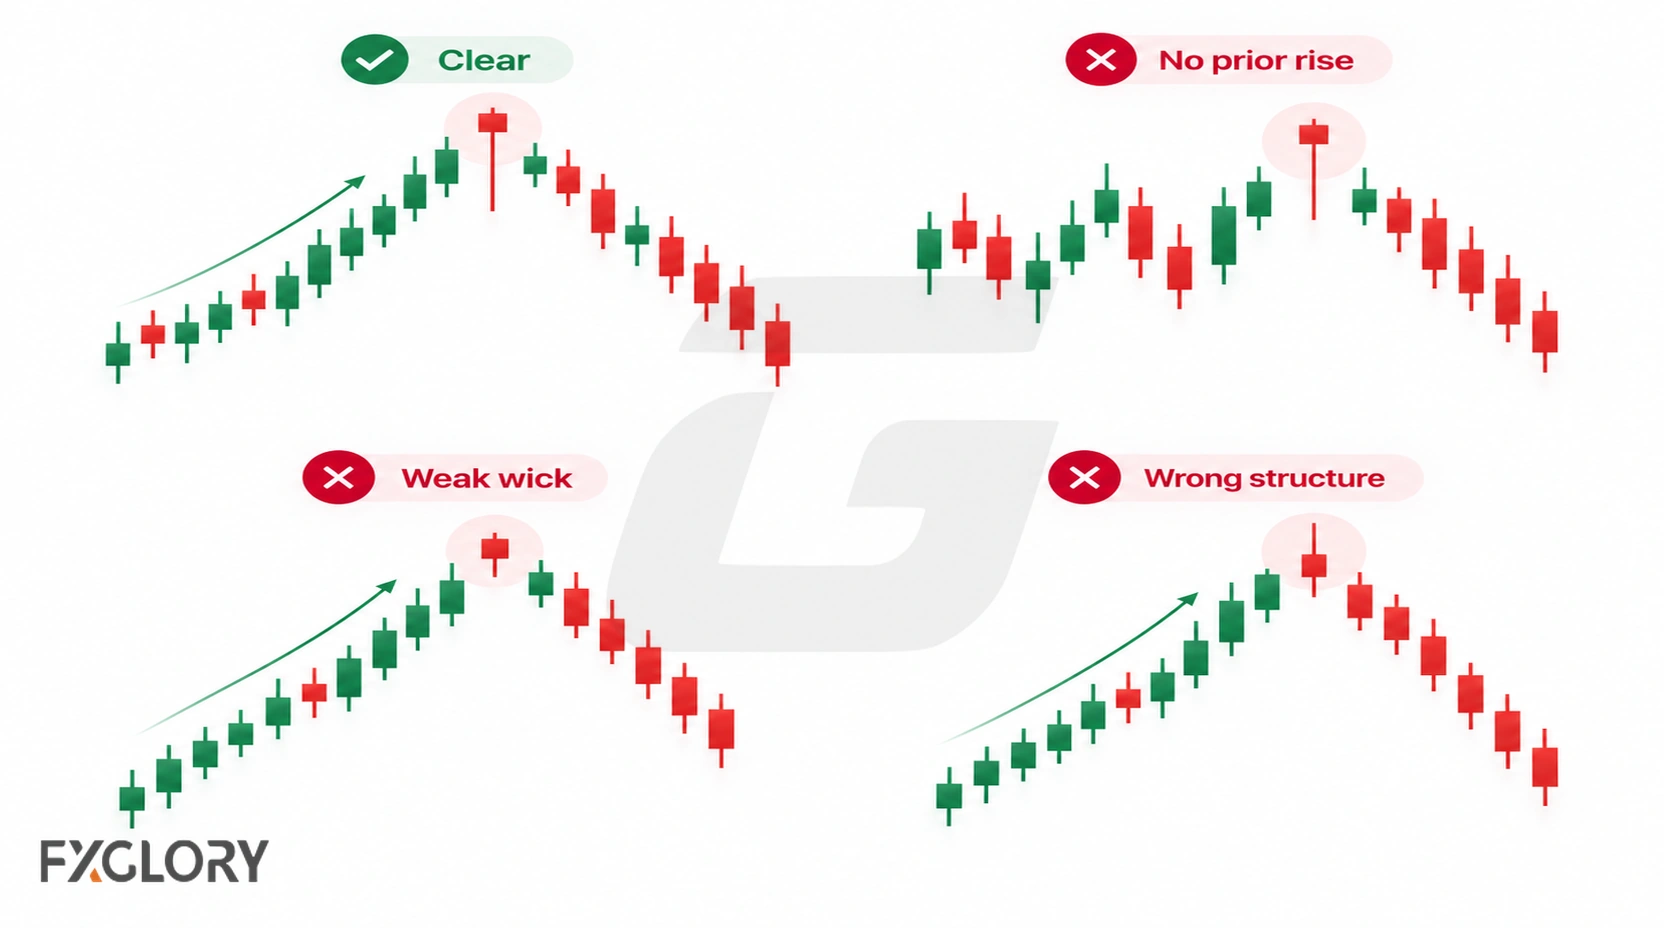
- Not a completed candidate: The candle is still forming, so its final proportions are unknown.
- Shape mismatch: The lower shadow is too short, the body sits around the middle, or the upper shadow is too prominent for a conventional Hanging Man.
- Context mismatch: Without a preceding advance, a similar shape might be classed as a Hammer or another lower-shadow candle.
- Valid pattern, unconfirmed reversal: The completed Hanging Man exists, but subsequent candles do not satisfy a predefined bearish condition.
- Confirmed bearish scenario that fails: A specified confirmation occurs, then price reverses against that scenario. This is different from a malformed candle.
News, thin liquidity and spread changes may reduce the reliability of an interpretation without changing the completed OHLC shape. A trader's inability to choose an acceptable stop or position size means the setup is not trade-ready; it does not make the candle structurally incomplete.
Common Mistakes With Hanging Man Candles
These errors concern how the candle is used, rather than merely whether its shape matches the definition.
- Equating a red body with reversal confirmation: The colour reports the relationship between open and close, not the outcome of the next candles.
- Confusing a bearish interpretation with a trade entry: Even when a subsequent candle meets a chosen confirmation rule, entry and risk decisions still require a separate plan.
- Treating the wick low as an automatic stop: A stop belongs to the selected strategy and its invalidation logic; consider the stop distance, pip value and account-risk allowance when sizing a position.
- Overreading an unusually long wick: Compare the candle with its timeframe and market conditions, including spreads, thin liquidity and scheduled news, before attributing special significance.
- Calling every unsuccessful bearish reading a false pattern: A valid completed Hanging Man can be followed by rising prices without its original candle structure changing.
What to Study After Hanging Man Candles
Comparing related formations can help distinguish a Hanging Man from similar single-candle structures and broader reversal patterns.
You can compare the hanging man with the similar-looking hammer candle, the upper-wick shooting star, or the broader long-wick rejection guide. For a wider map of candle formations, return to forex candlestick pattern groups or reversal candles in forex.