

What are lines studies in MetaTrader 4?
Line studies are lines and various geometrical shapes that can be imposed on a price or indicator chart. They include support/resistance lines and trend lines, as well as Fibonacci’s, Gann’s, and Andrews’ tools, etc. The Lines menu of the terminal is located under the program heading and represents a set of sub-menus.
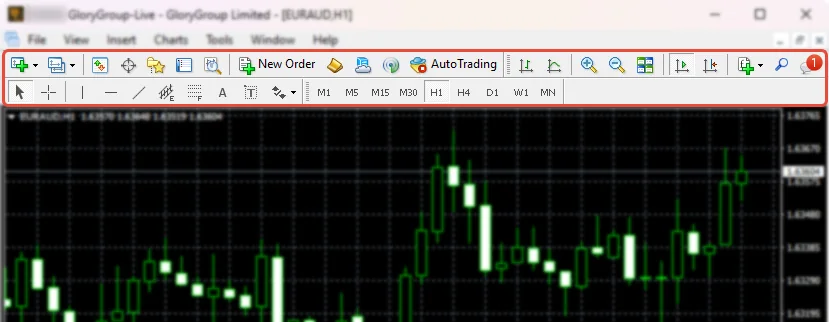
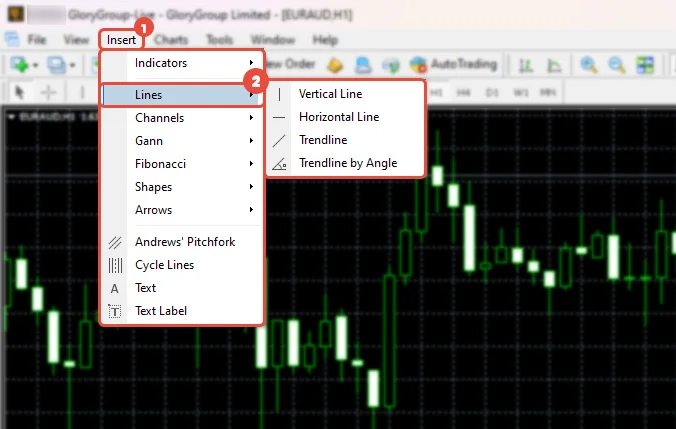
You can find line studies in the “Insert” menu and the “Line Studies” toolbar.
You can drag and drop these toolbars by clicking and holding the left side, which resembles a stack of coins. Click, hold, drag the toolbar to your desired location, and release to drop it.
The “Line Studies” toolbar contains various objects (lines, channels, Gann tools, Fibonacci tools, etc.) that can be added to a chart. All commands in this toolbar, except for “Crosshair” and “Cursor”, are also available in the “Insert” menu.
| Icon | Menu Command | Description |
|---|---|---|
|
|
Horizontal line |
It can be used to mark various levels, particularly those of support and resistance. One point must be set for this object to be imposed. |
|
|
Vertical Line |
Vertical lines can be used to mark various borders in the time axis and to compare signals of indicators to price changes. One point must be set for this object to be imposed. |
|
|
Trend Line |
Trendlines help to explore trends in price changes. Two points must be set through which a trendline will be drawn. |
|
|
Trendline By Angle |
Trendlines help to explore trends in price changes. Two points must be set through which a trendline will be drawn |
|
|
Linear Regression Channel |
It is a statistical tool used for forecasting future values on the basis of available data. If the trend is ascending, one can logically suppose that the next bar will be a bit higher than the preceding one. The linear regression method allows for a statistical demonstration of such logical conclusions. Two points must be set for this tool to be drawn. |
|
|
Equidistant Channel |
The lines of the equidistant channel are always parallel. Two points must be set for this tool to be drawn. |
|
|
Standard Deviation Channel |
Standard deviation is the way of measuring volatility based on statistical methods. The standard deviation influences the width of this channel. Two points must be set for this tool to be drawn. |
|
|
Gann Line |
The Gann Line represents a trendline drawn at an angle of 45 degrees. Two points must be set for this tool to be drawn. |
|
|
Gann Fan |
Gann Fan represents a set of trendlines drawn from one point at different angles. Gann considered the trendline of 1x1 (45 degrees) to be a very important one. If the price curve is above this line, the market should be considered a bull market; if it is below, it is a bear market. Gann supposed the ray of 1x1 to be a powerful supporting line at an ascending trend, and the breaking of this line was to be an important turn signal. One point must be set for Gann Fan to be drawn. |
|
|
Gan Grid |
The lines of the Gann Grid are drawn at an angle of 45 degrees. Two points must be set for this tool to be drawn. |
|
|
Fibonacci Retracement |
Leonardo Fibonacci is considered to have discovered a number sequence where each successive number represents a sum of two preceding ones: 1, 1, 2, 3, 5, 8, 13, 21, 34, 55, 89, 144, etc. Each number is approximately 1.618 times more than the preceding one, and each number makes approximately 0.618 of the next one. The tool can be drawn on two points that determine the trendline. At that, horizontal lines that meet the trendline at Fibonacci levels (retracement) as 0.0%, 23.6%, 38.2%, 50%, 61.8%, 100%, 161.8%, 261.8%, and 423.6% are drawn automatically. |
|
|
Fibonacci Channel |
To draw this tool, a channel is used, the width of which is taken as one. Then, at the distances defined by the Fibonacci sequence, parallels are drawn starting with the distance of 0.618 of the channel width, rather than 1.000, 1.618, 2.618, 4.236, etc. Two points and the basic channel width must be set for this tool to be drawn. |
|
|
Fibonacci Time Zones |
Fibonacci Time Zones represent a row of vertical lines placed at Fibonacci intervals from each other: 1, 2, 3, 5, 8, 13, 21, 34, etc. It is considered that significant price changes should be expected near these lines. The tool can be drawn at two points that define the unit interval. |
|
|
Fibonacci Fan |
Fibonacci Fan is drawn on two points that define the trendline. Then an "invisible" vertical line is drawn through the second point. Then three trend lines are drawn from the first point; these trend lines meet the invisible vertical line at Fibonacci levels of 38.2%, 50%, and 61.8%. It is considered that significant price changes should be expected near these lines. |
|
|
Fibonacci Arcs |
The tool named Fibonacci Arcs is drawn on two points that define the trendline. Then three arcs with centers in the second point are drawn, with these arcs meeting the trendline at Fibonacci levels of 38.2%, 50%, and 61.8%. It is considered that significant price changes should be expected near these arcs. |
|
|
Fibonacci Expansion |
Fibonacci Expansion is drawn on three points that circumscribe two waves. Then three lines meeting the third, "presumptive" wave at Fibonacci levels of 61.8%, 100%, and 161.8% are drawn. It is considered that significant price changes should be expected near these lines. |
|
|
Andrews' Pitchfork |
This tool is drawn on three points and represents the parallel trendlines. The first trendline starts at the selected leftmost point (it is an important peak or trough) and is drawn precisely between two rightmost points. This line is the pitchfork "helve." Then, the second and third trend lines outgoing from the above-mentioned rightmost points (significant peak and trough) are drawn in parallel to the first trendline. These lines are the pitchfork "teeth." Andrews' Pitchfork is interpreted as support/resistance lines are normally interpreted. |
|
|
Cycle Lines |
This tool represents a row of vertical lines placed at equal intervals. Normally, a unit interval corresponds with one cycle. At that point, completed lines are considered to describe future cycles. The tool is drawn on two points that define the unit interval. |
