Chart section on MT4 iPhone platform
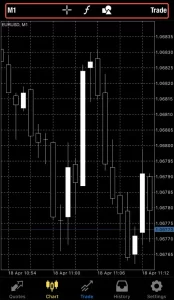
This article explains the different icons in the “Chart” section.
The first icon on the left indicates the time frame where you can choose your desired one.
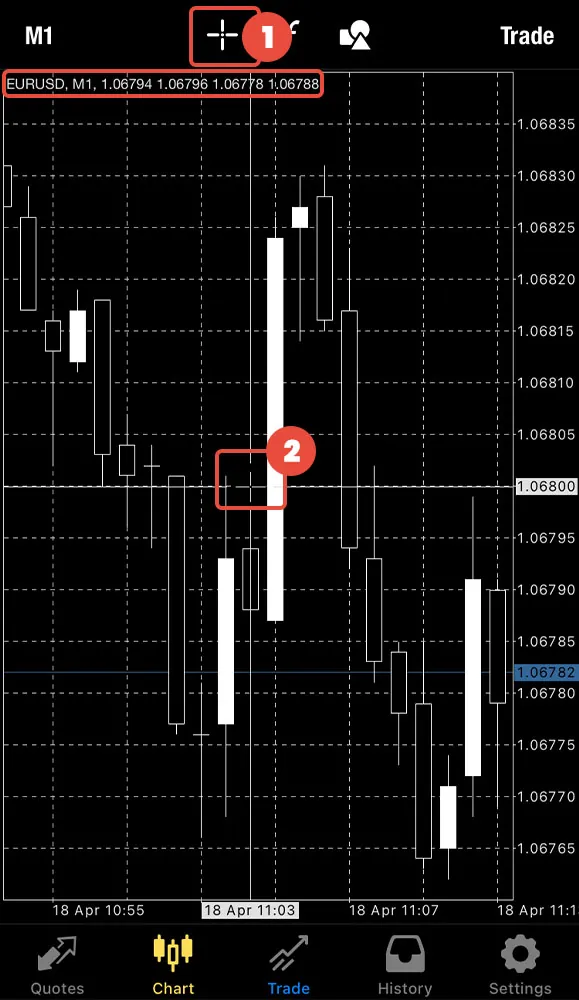
![]() This icon enables the clients to see more details on the targeted spot on the chart.
This icon enables the clients to see more details on the targeted spot on the chart.
![]() By tapping on this icon, you enter the “Indicators” section. Tap on the “Main Window” and select the indicator. After applying your changes, tap “Done“.
By tapping on this icon, you enter the “Indicators” section. Tap on the “Main Window” and select the indicator. After applying your changes, tap “Done“.
![]() Line studies are lines and various geometrical shapes that can be imposed on a price or indicator chart. They include support/resistance lines and trend lines, as well as Fibonacci’s, Gann’s, and Andrews’ tools, etc.
Line studies are lines and various geometrical shapes that can be imposed on a price or indicator chart. They include support/resistance lines and trend lines, as well as Fibonacci’s, Gann’s, and Andrews’ tools, etc.
The icon shown represents objects. Select the icon, and on the next page, you can choose “Add Object” for more options.
Then you can select your desired option.
You can also open positions on the same page using the![]() icon on the top right-hand corner of the application.
icon on the top right-hand corner of the application.
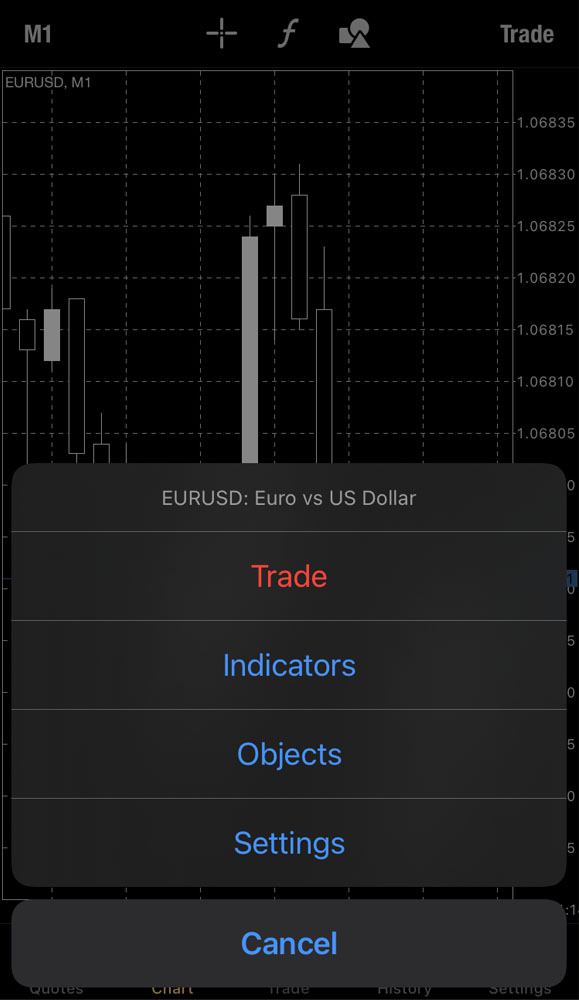
You may access all these features with a single tap on the chart page:
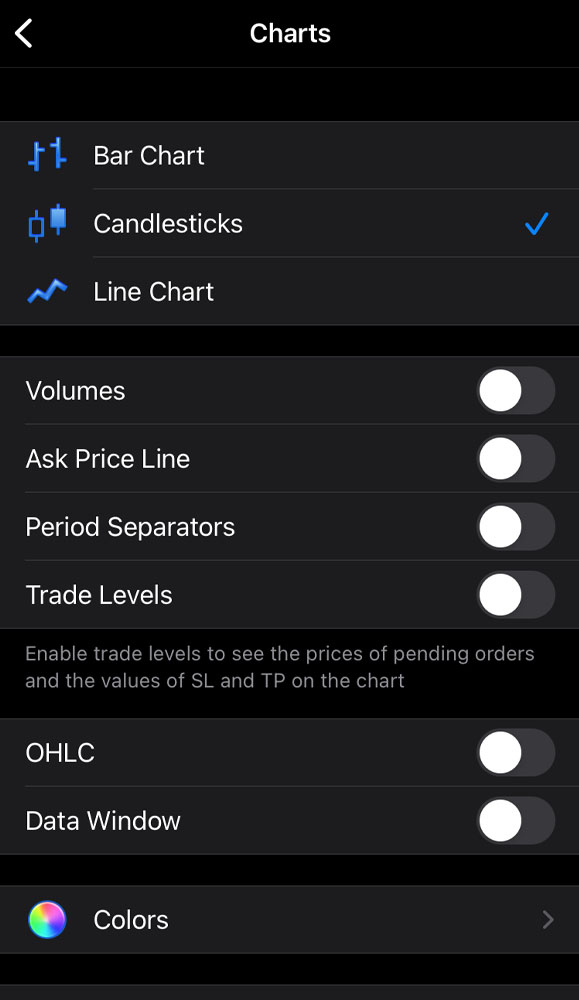
“Settings” allows you to choose your chart type and other features.

