


How to Use the Strategy Tester in MetaTrader 4?
MetaTrader 4 is one of the most popular trading platforms that allows a trader to perform trading operations and technical analysis for the Forex markets, CFDs, and futures. It includes the integrated MQL4 (MetaQuotes Language 4), allowing traders to create custom indicators, expert advisors, and strategy testers. This enables traders to test their strategies on historical data.
Click on the “View” tab from the top menu, then select the “Strategy Tester” option. Alternatively, you can use the shortcut keys <Ctrl+R> to execute this command.
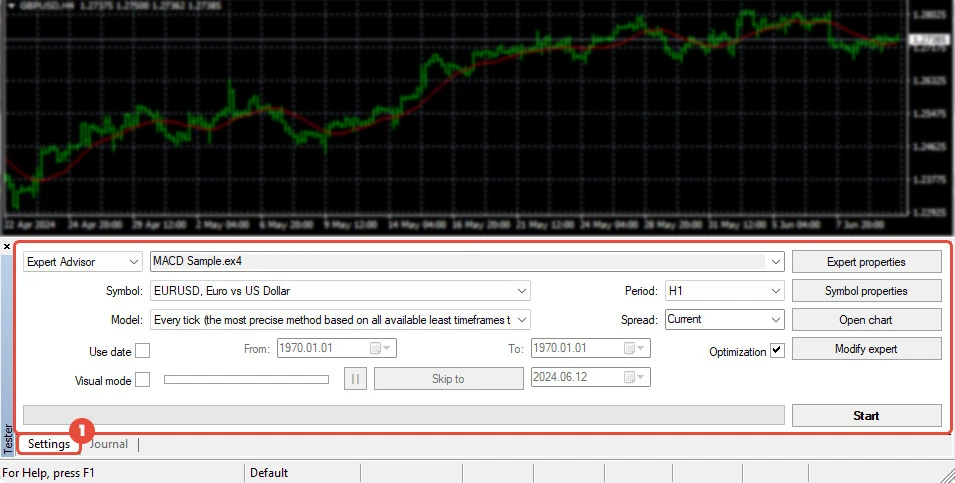
To test and optimize experts, a special “Tester” window is used in the terminal. You can set all parameters in the “Settings” tab of this window.
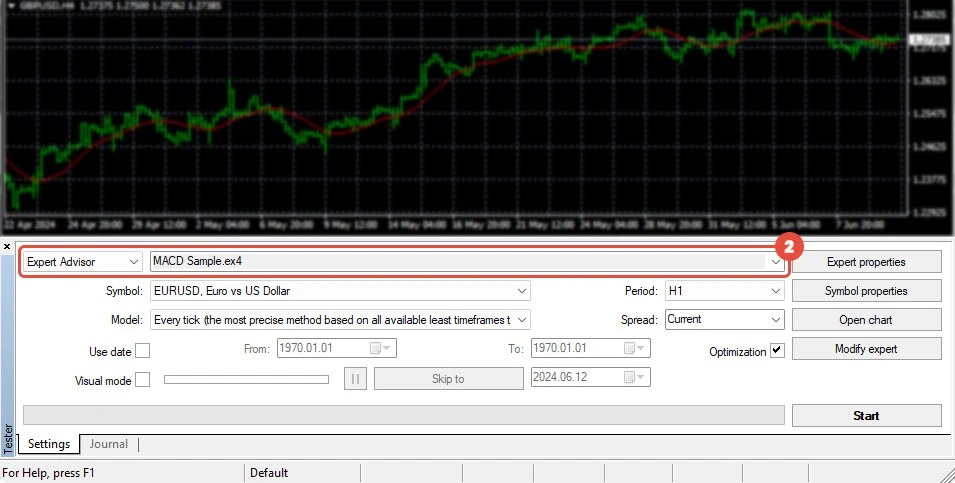
In the “Expert Advisor” section, select the “Expert Advisor” that you want to test from the list.
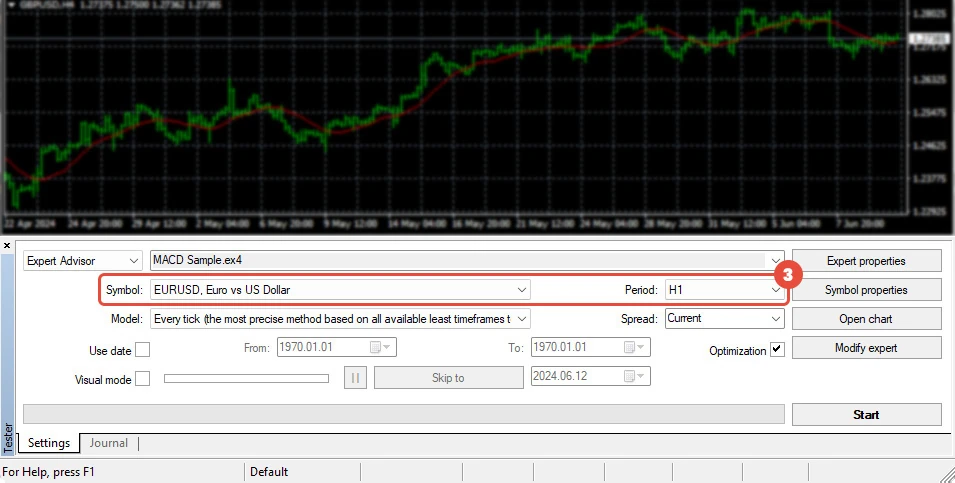
Then, choose your preferred currency pair in the “Symbol” option.
Finally, in the “Model” part, select your desired method of bar modeling.
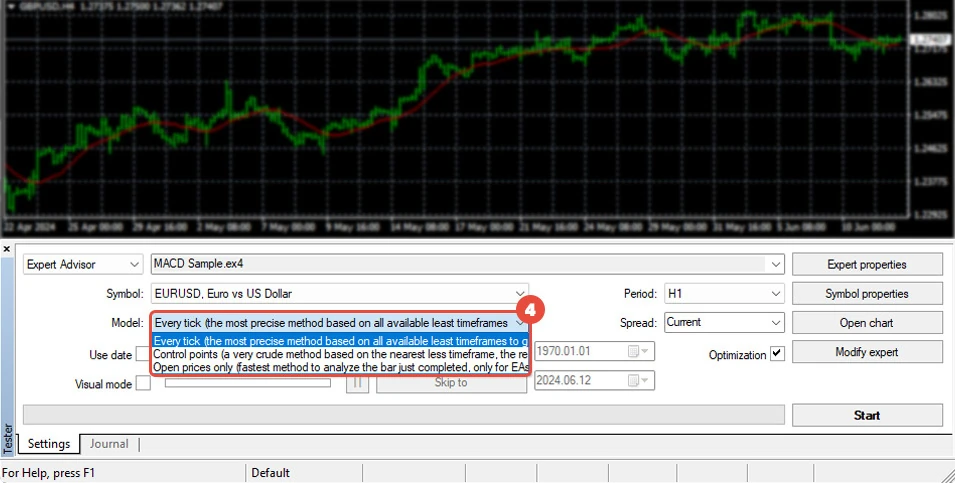
Here are different methods of bar modeling in MetaTrader 4 Strategy Tester:
- Every tick (based on all available least timeframes with fractal interpolation of every tick).
- Control points (based on the nearest less timeframe with fractal interpolation of 12 control points).
- Open prices only (fastest method to analyze the bar just completed).
Also, when setting up the Strategy Tester in MetaTrader 4, you can configure various parameters to tailor the testing process to your needs:
Spread: The price history stored in the client terminal includes only bid prices. By default, the strategy tester uses the current spread of a symbol at the beginning of testing to model Ask prices. However, you can set a custom spread for testing in the “Spread” field.
Use date: Use a range of dates when testing. If this option is enabled, only the data from the specified range will be used. Otherwise, all available data for the given symbol and period will be used.
Visual mode: Enable the visual display of the test process on a graph. Adjust the speed of the testing visualization using the lever on the right. You can also specify a date in the “Skip to” field to skip visualizing the test until that date.
Optimization: Enable the expert parameter optimization mode. More details about expert parameter optimization can be found in the corresponding section.
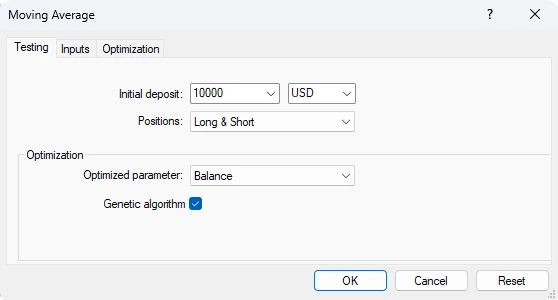
Expert properties: Open the “Expert Properties” window with the tabs “Testing”, “Inputs”, and “Optimization”. This allows you to manage the expert parameters while testing and optimizing, as shown in the picture.
Symbol properties: View the symbol parameters. These data are provided in the *.FXT file heading and are used to emulate server operations.
Open chart: Create a new chart window for the symbol selected for testing. During testing, the expert works with a virtual chart. Signs of opening and closing positions, objects, and indicators used by the expert are applied to this chart. This chart can only be opened after the expert has been tested. The TESTER.TPL template is used for opening a virtual chart. If this template is not available, the default settings are used. You can also name a template the same as the Expert Advisor, and this exact template will be used when opening the chart of the Expert Advisor.
Start: Start testing or optimization. After pressing this button, you can estimate the speed of testing or optimization in the progress bar at the lower part of the window. Once testing begins, the “Start” button will be replaced with the “Stop” button. Pressing this button during testing/optimization stops the process.
Additionally, there are several tabs in that window, too:
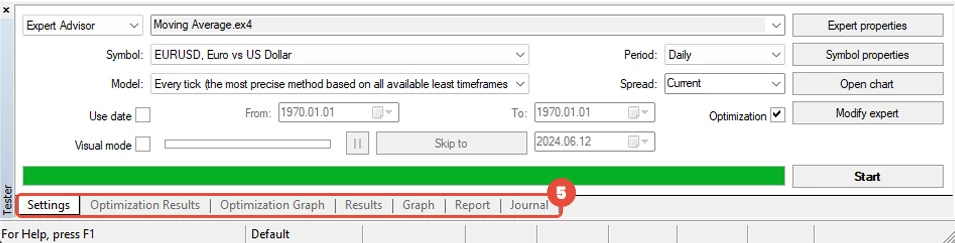
Settings: Configure settings for testing and optimization. This tab allows you to set parameters for expert advisors, the period to be tested, the method of bars modeling, and various other options.
Optimization Results: View detailed information about each pass, including inputs, profitability, drawdowns, and other relevant data.
Optimization Graph: Display the results of expert optimization as a graph. It shows each pass’s profitability, as well as the number of profit and loss trades.
Results: View the results of trade operations performed by the expert, along with the direction of balance changes.
Graph: Display testing results in a graph format.
Report: Access a detailed testing report. This report includes various indicators of testing and expert effectiveness, such as the number of bars modeled, total profit, most profitable and unprofitable positions, and the number of profit and loss trades.
Journal: A log where all actions and internal messages of the expert are recorded.
