
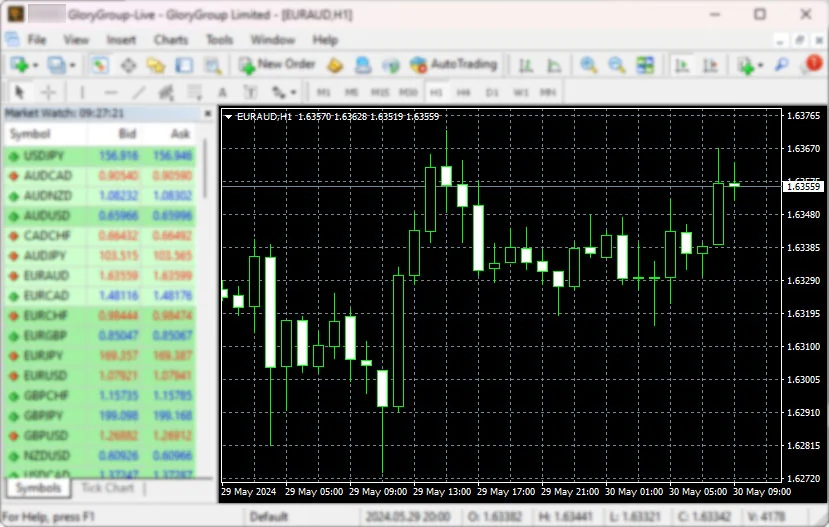
How can I read charts in MetaTrader4?
To become a successful Forex trader and make a profit, you must know how to read charts, which are essential for traders. Charts in MetaTrader 4 can be categorized into three main types:
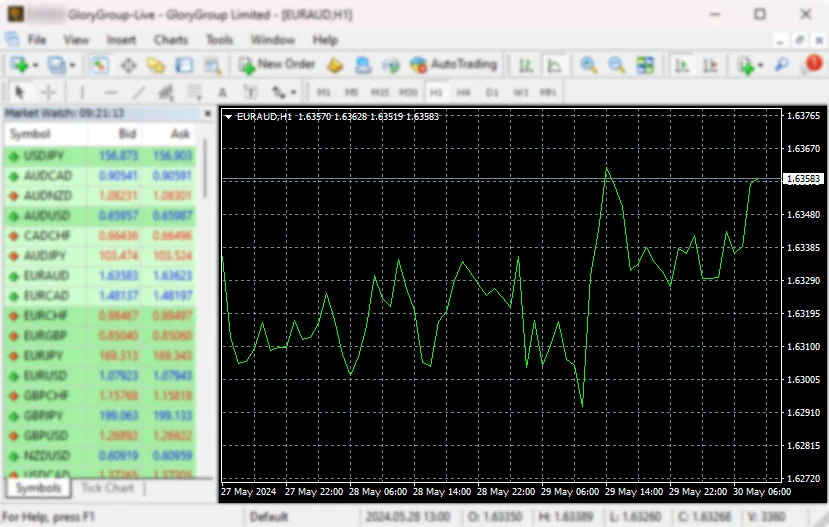
Line Bar Chart:
Using the line bar chart is the easiest way to read charts. It simply shows a line graph of time vs. price.
A basic price chart is one in which there are no ticks, just a line indicating the last price for that chart period.
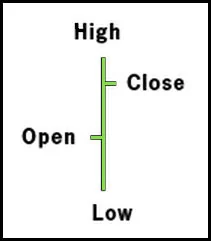
Bar chart
It shows the entry price per period, the exit price at the end of the period, and the highs and lows of that period.
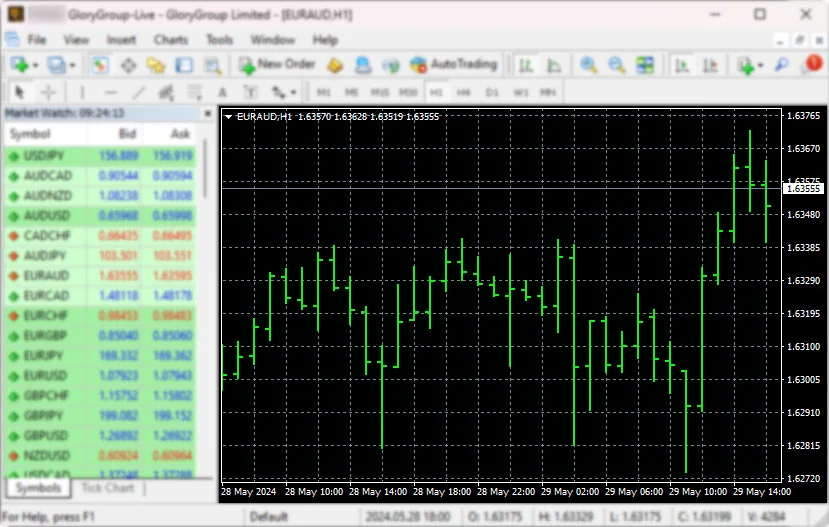
Each bar provides the open price, highest price, lowest price, and last or close price for a given period.
Here are the components of a bar chart:
- High: The top point of the vertical bar.
- Low: the bottom point of the vertical bar.
- Opening price: a small horizontal line to the left of the vertical bar.
- Closing price: a small horizontal line to the right of the vertical bar.
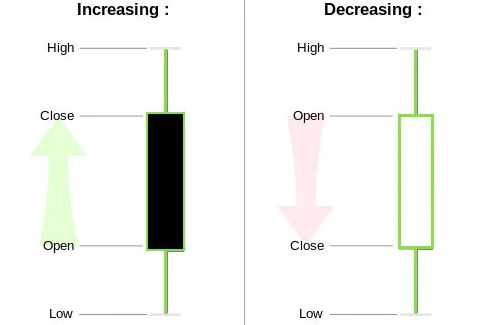
Candlesticks
Candlesticks are graphical representations of price fluctuations for currency pairs.
They combine the features of both line charts and bar charts. Also, each candlestick represents the range of price movement over a given time interval. It is most often used in the technical analysis of equity and currency price patterns. As shown below, the hollow (black) bars are the bars that have moved up. While colored or filled (white) bars represent prices that have moved down, The lines above each bar represent the high and low shadows.