Chart properties in MetaTrader4
To change the properties of a chart in MetaTrader 4, follow one of these steps:
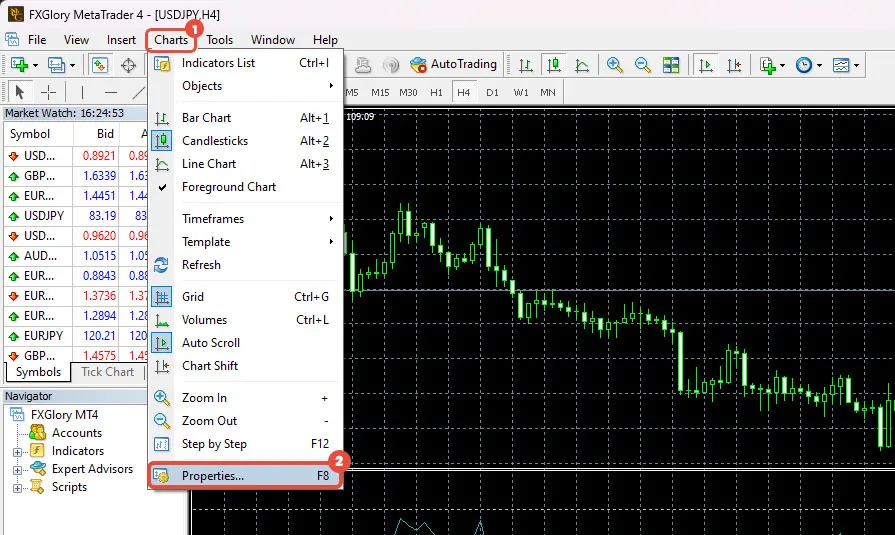
1. Using the Charts menu:
Go to the “Charts” menu.
Select the “Properties” button from the drop-down list.
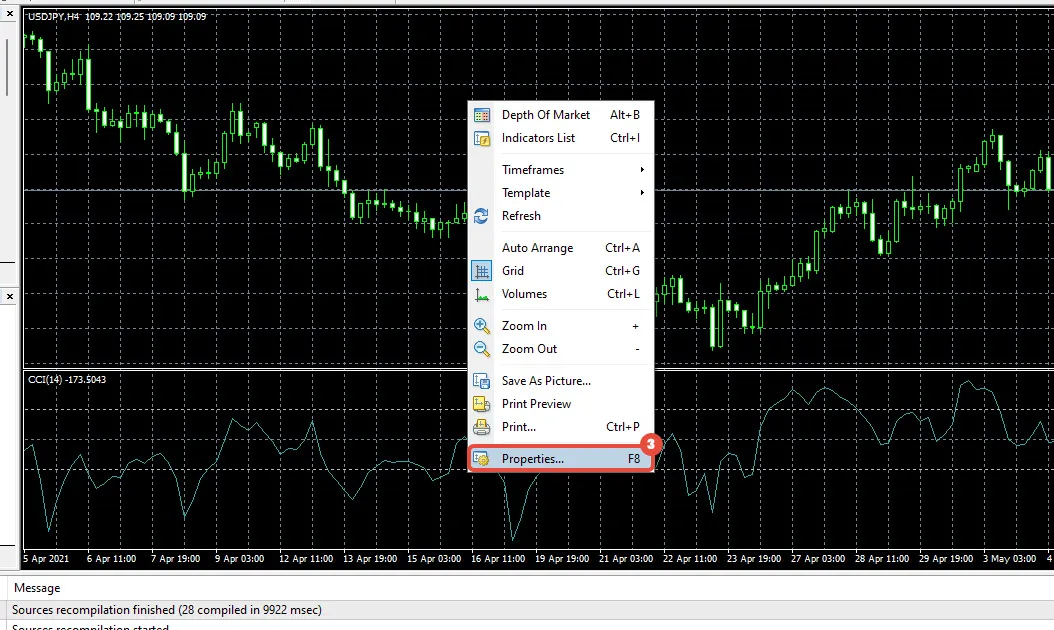
2. Right-Click Method:
Right-click on the chart.
Choose the “Properties” button from the drop-down list.
3. Shortcut Method:
Press < F8 > for the fastest way to open the “Properties” window.
In the “Properties” window, you will find two tabs: “Colors” and “Common”.
Colors Tab
This menu allows you to change the settings of the chart using the following commands:
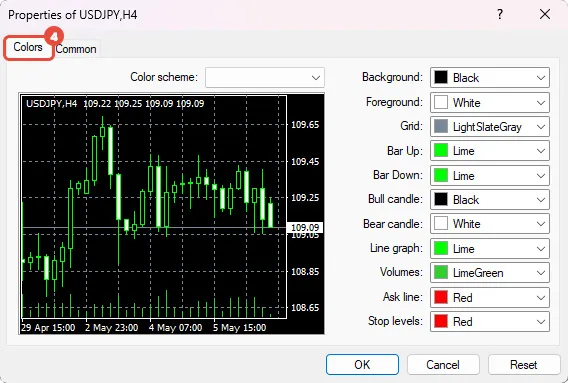
Background: Change the background color.
Foreground: Change the foreground color and the color properties of objects in the foreground.
Grid: Change the color of the grid.
Bar Up: Color of bar charts for bullish bars.
Bar Down: Color of bar charts for bearish bars.
Bull Candle: Color of candlestick charts for bullish candles.
Bear Candle: Color of candlestick charts for bearish candles.
Line Graph: Color of the line chart.
Volumes: color of volumes.
Ask Line: The color of the ask line.
Stop Levels: The color of the stop level line.
Common Tab
This tab contains common chart settings for MetaTrader 4 charts: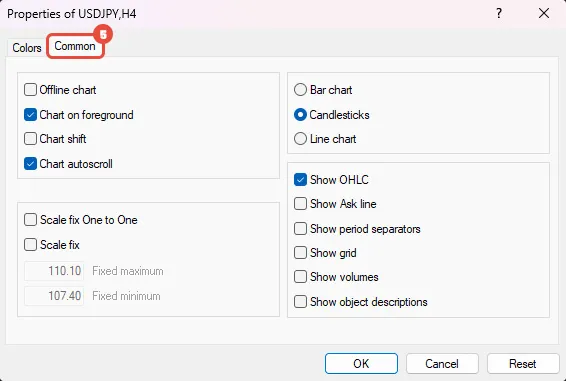
Bar Chart: Displays the chart as a bar chart.
Candlesticks: Displays the chart as candlestick charts.
Line Chart: Displays the chart as a line graph. It also shows the pening, maximum, minimum, and closing prices of the current candle in the upper-left corner.
Show Ask Line: Displays the ask price line.
Show Period Separators: Displays a vertical line at the start of each day.
Show Grid: Displays the grid on the screen.
Show Object Descriptions: Displays descriptions of each object drawn on the chart, including indicators, trend lines, and shapes like rectangles and ellipses.

