

What Is the Double Top Pattern in Forex?
A double top is a potential bearish reversal chart pattern that develops after an upward move. Price reaches a resistance area twice, with a pullback between the peaks. The intervening low defines the neckline, so the structure resembles the letter M.
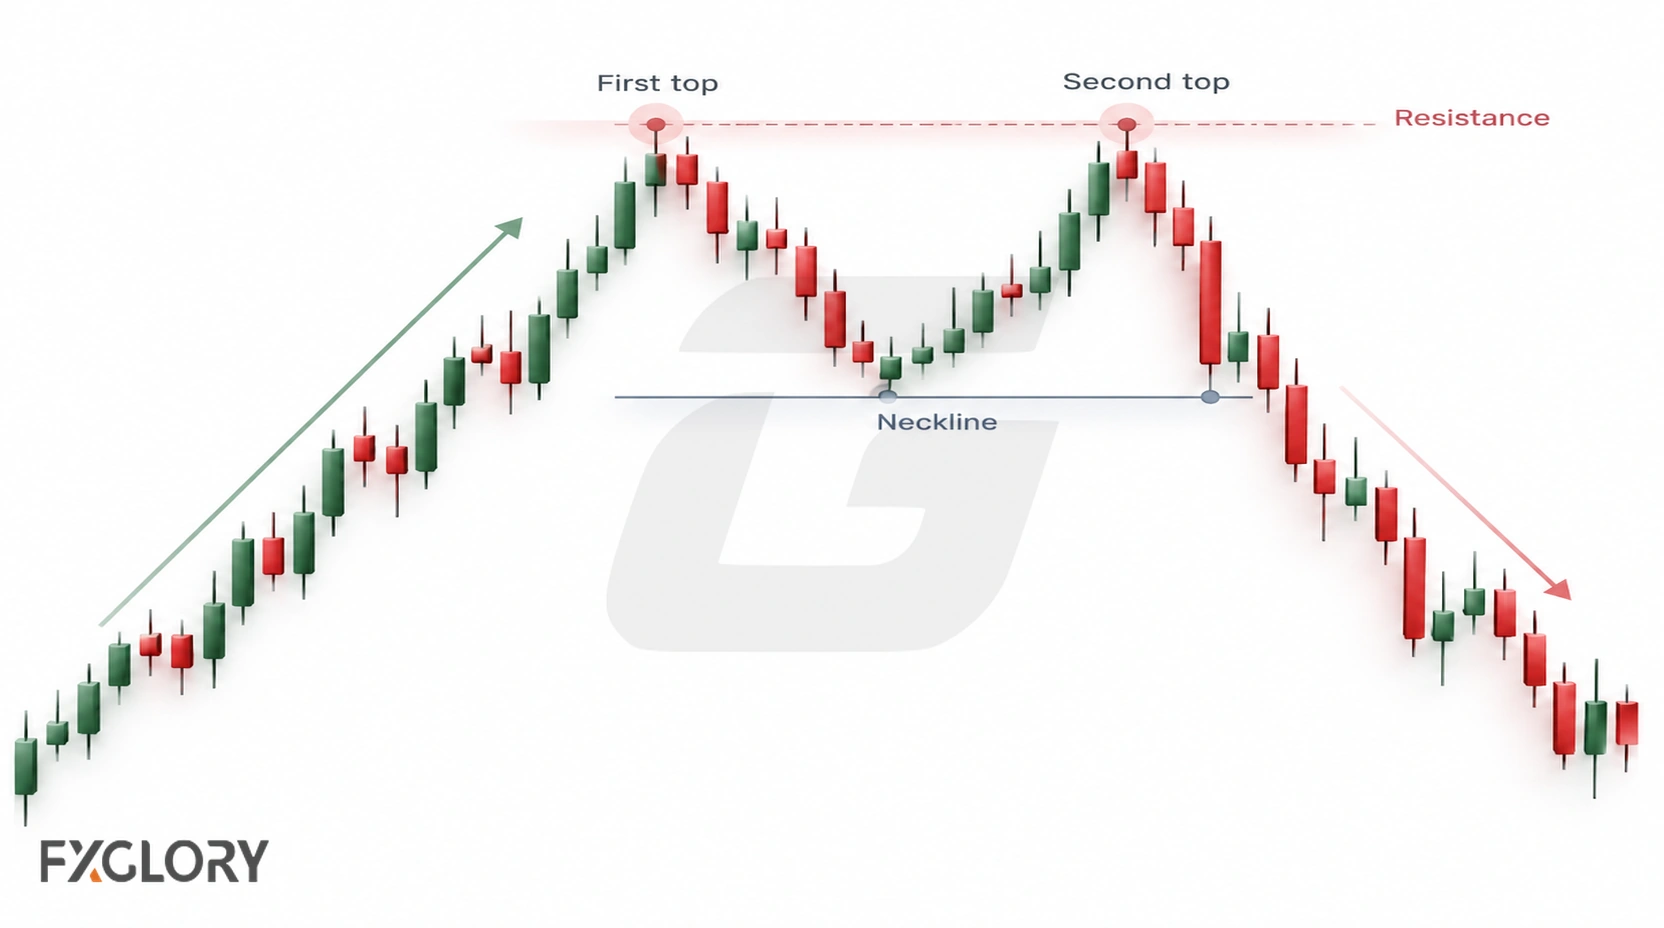
The two peaks identify a candidate double top. A break below the neckline, under a specified rule, confirms the pattern; confirmation does not guarantee a continuing decline. If support holds, the M shape remains unconfirmed and may develop into a range or another structure.
For broader context on reversal structures, see the trend-exhaustion guide.
How a Forex Double Top Pattern Forms
The sequence begins with a rise, a first rejection at resistance, a decline to an intervening support area, and a second reaction near the first high. The next neckline test determines whether the candidate develops into a confirmed pattern.
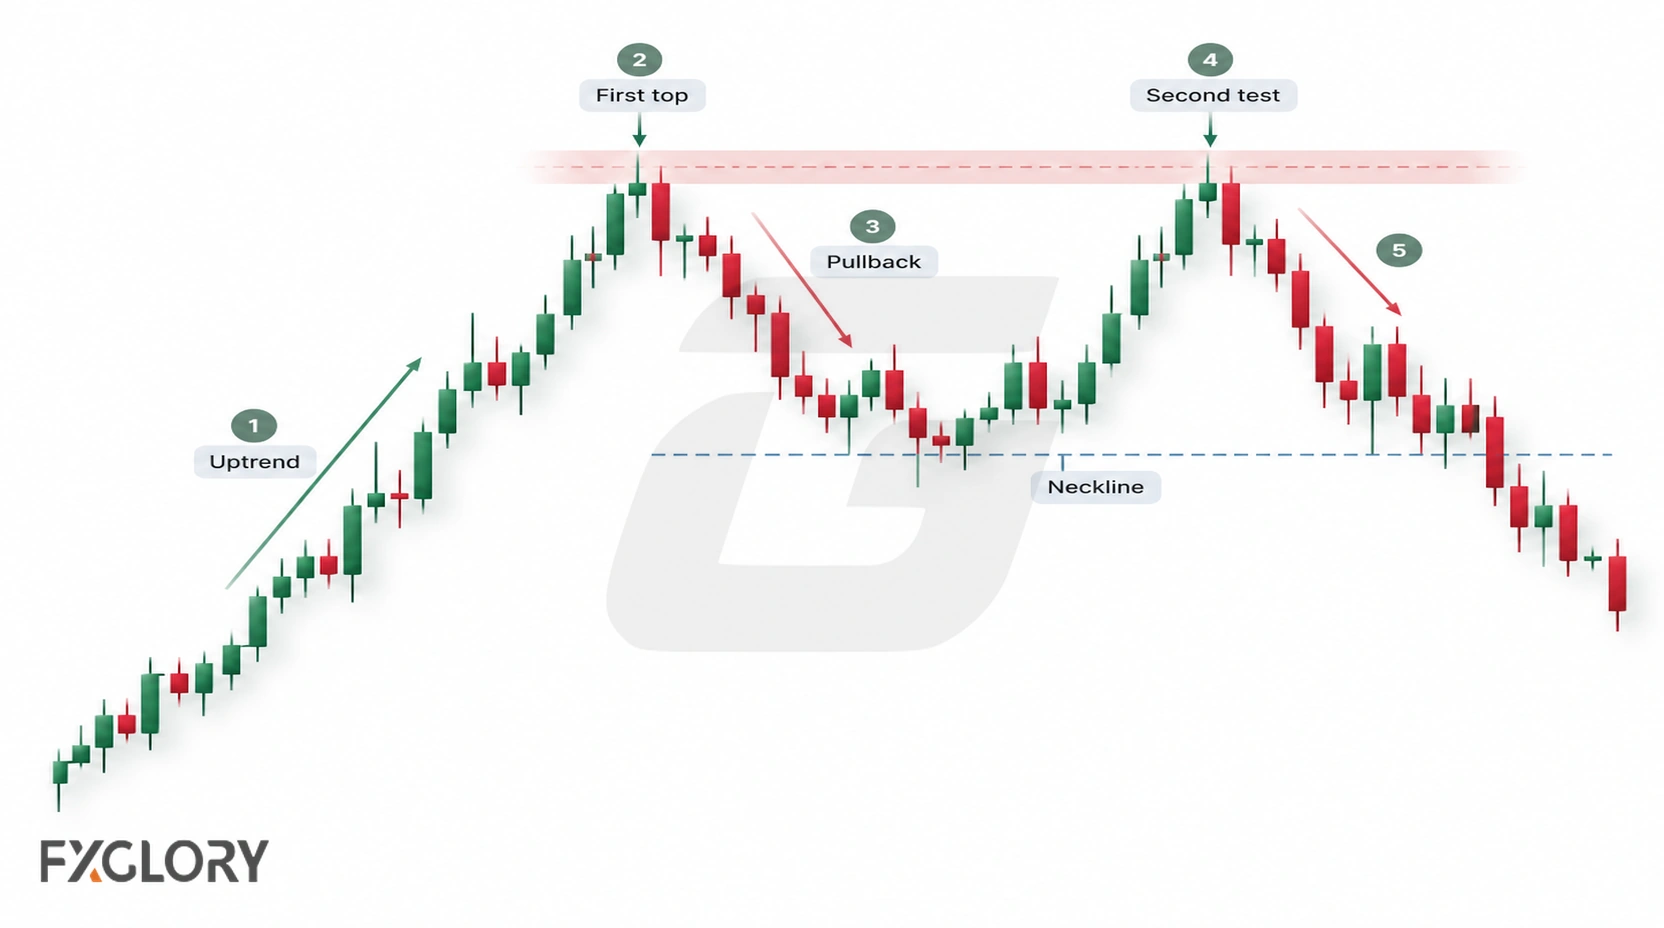
- Prior rise: Identify the upward move that might reverse.
- First peak: Mark the initial resistance reaction.
- Pullback: Locate the intervening swing low, which establishes neckline support.
- Second peak: Look for another reaction within the same general resistance zone; the peaks need not be identical.
- Neckline decision: Check whether price breaks support under your chosen confirmation rule. Until then, the structure is a candidate.
Double Top Pattern Anatomy
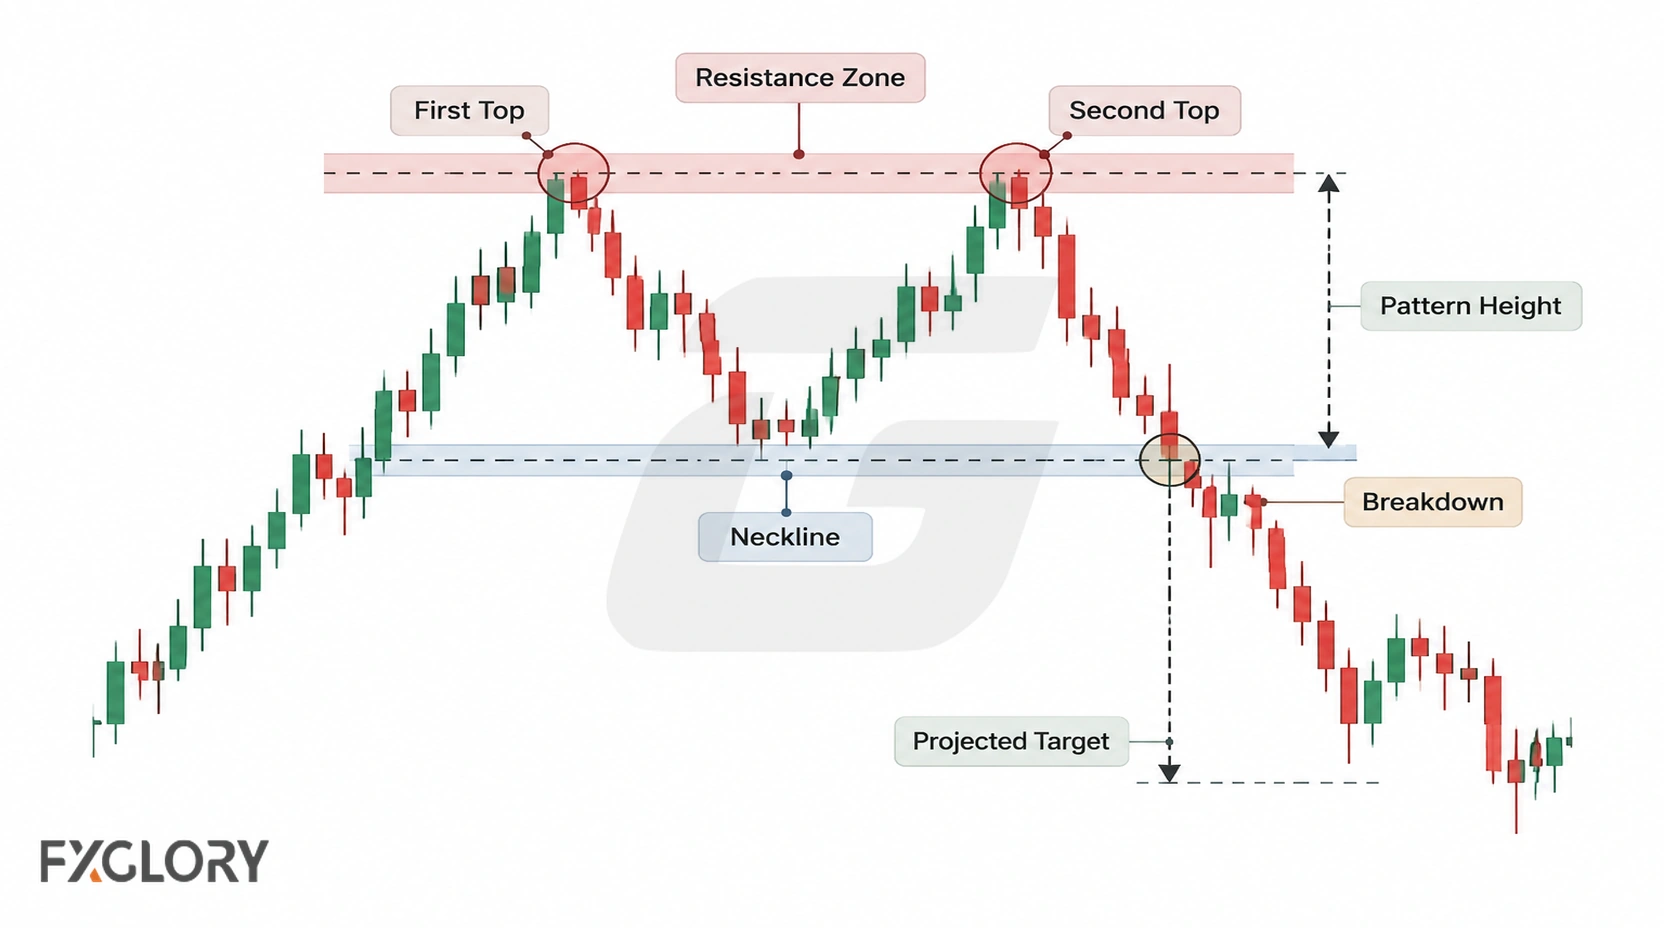
Mark the two upper reactions as a resistance zone, not necessarily a single exact price. For the neckline, start with the intervening swing low and inspect nearby candle bodies and wicks. Where those prices differ, define the support boundary you will use before assessing the break; a wick below a zone and a candle closing below its lower edge are not equivalent evidence.
| Element | Role | Reading |
|---|---|---|
| Prior rise | Provides reversal context | Without an earlier rise, repeated highs may be part of a range |
| Two peaks | Test a common resistance zone | Similar, not necessarily identical, highs are sufficient |
| Intervening low | Defines neckline support | Use a consistently marked level or zone |
| Neckline break | Confirms the pattern under the selected rule | A temporary breach can still fail |
| Optional retest | Tests the broken support area from below | It may occur, but is not required for pattern confirmation |
M Pattern vs W Pattern in Forex
An M-shaped double top develops after a rise and is assessed for a downside neckline break. A W-shaped double bottom develops after a decline and is assessed for an upside break through its intervening resistance.
| Pattern | Prior move | Confirmation reference |
|---|---|---|
| Double top (M) | Upward | Break below intervening support |
| Double bottom (W) | Downward | Break above intervening resistance |
See the W-shaped support reaction for the opposite structure.
Strong vs Weak Double Top Patterns
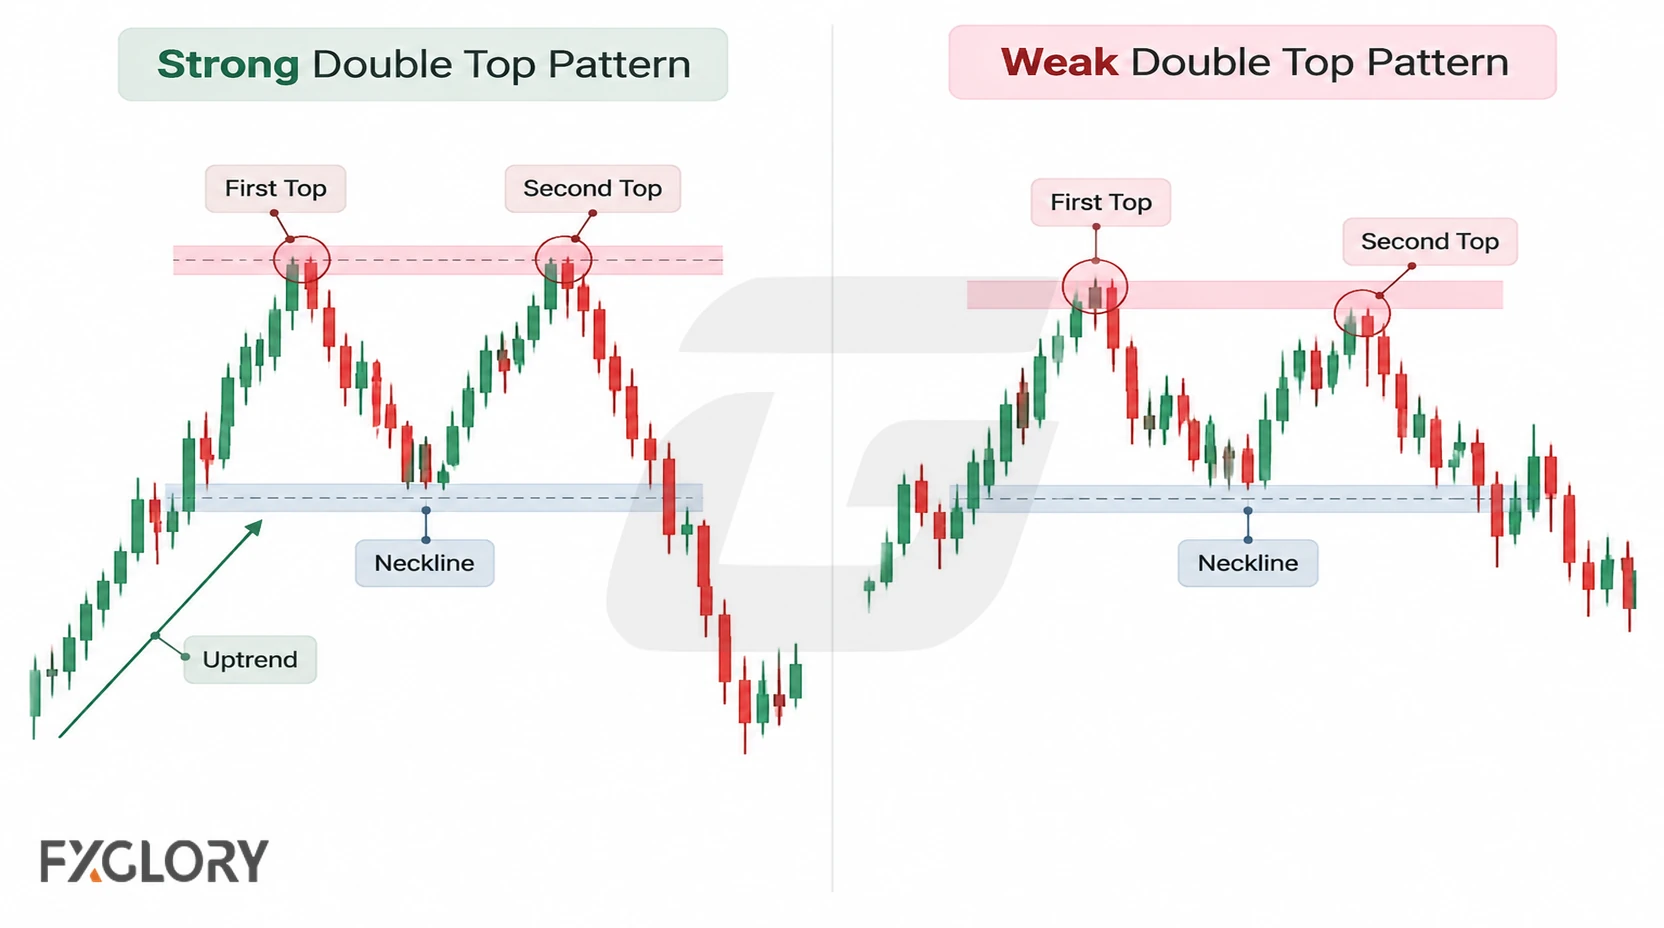
Here, stronger and weaker describe how clearly the chart supports the pattern classification—not the probability of profit or the quality of a trader’s risk plan.
| Chart factor | Clearer candidate | Less clear candidate |
|---|---|---|
| Prior move | Recognizable rise | Extended sideways movement |
| Peaks | Two distinct reactions in one resistance zone | Scattered highs without a coherent zone |
| Pullback | Intervening swing low is visible | No distinguishable middle low |
| Neckline | Support boundary can be marked consistently | Confirmation depends on moving the boundary after the fact |
| Confirmation status | Defined neckline-break condition occurs | Price has not met that condition |
A clear confirmed pattern can still be a poor trade if execution costs, the broader trend or the required risk are unfavorable. Those are separate assessments.
How to Confirm a Forex Double Top Pattern
Confirmation concerns the neckline, not whether a trader has planned an entry or stop. Choose a boundary and rule consistently. A commonly used stricter rule is a completed candle close below the lower edge of the marked neckline support area on the timeframe being analyzed. An intrabar dip below support is a less stringent breach and may reverse before the candle closes.
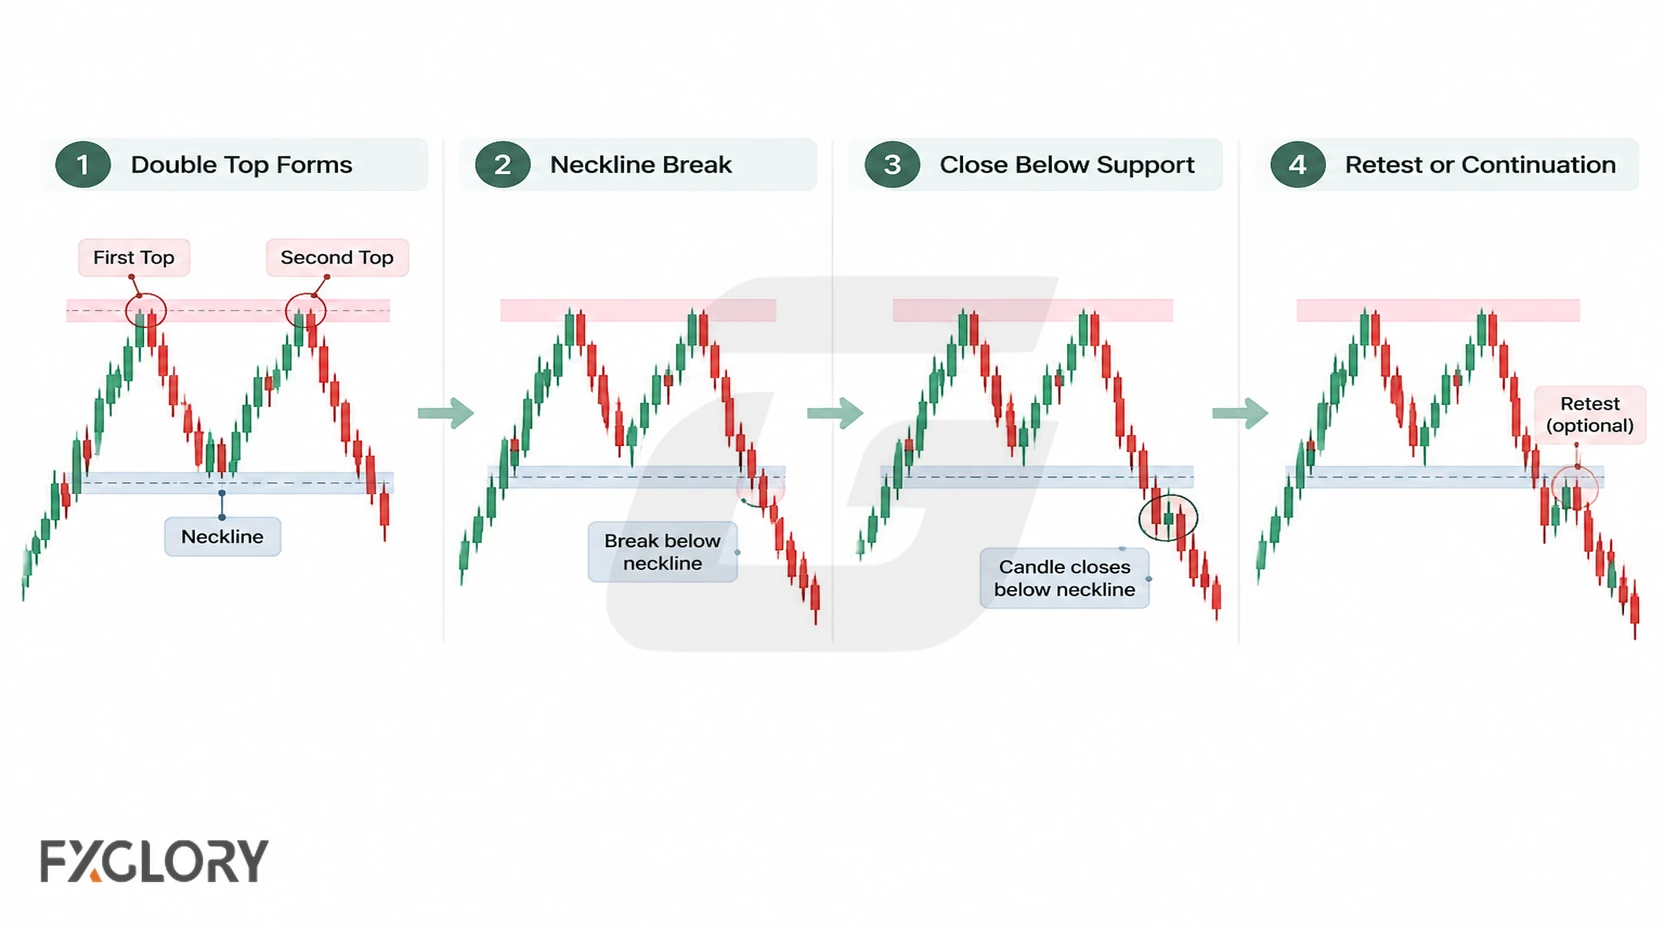
- Identify the candidate: Verify the prior rise, two resistance reactions, and intervening low.
- Mark the neckline: Specify the support boundary and timeframe before price reaches it.
- Apply the break rule: Check whether a completed candle closes below that boundary if using close-based confirmation.
- Monitor what follows: Price may continue lower, retest the underside of the neckline, or quickly reclaim it.
A retest or sustained hold below the neckline can add context but is not part of every confirmation rule. Different rules identify different events and should not be mixed retrospectively. For more detail on entry methods after level breaks, see the forex breakout strategy.
Invalidation: When the Double Top Idea Fails
Distinguish an unconfirmed candidate, failure of the chart interpretation, and invalidation of a particular trade. These are not interchangeable.
- Neckline holds: The candidate remains unconfirmed; it has not necessarily failed.
- Resistance breaks upward: A sustained move above the peaks undermines the candidate bearish reversal interpretation.
- Neckline is reclaimed after confirmation: The downside break may have failed. This does not erase the fact that the break occurred.
- Broader trend or news conflicts: These can affect reliability and execution, but do not automatically change the pattern’s structural classification.
A trader must separately decide what price behavior would invalidate their trade idea, where any stop belongs, and how much account risk to accept. The chosen stop may differ from the chart level used to classify the pattern. Without those decisions, the trade plan is incomplete—not the confirmed chart pattern.
False Double Tops in Forex
Two resistance tests without a neckline break are an unconfirmed candidate, not evidence that a confirmed reversal failed. A failed confirmed double top occurs when the specified neckline break happens but downside follow-through does not persist, such as when price promptly reclaims support.
Additional upper tests can develop into a range or a triple top pattern. The labels depend on the evolving swing structure, not on the trader’s preferred direction.
| Price behavior | Interpretation |
|---|---|
| Two highs, neckline intact | Candidate remains unconfirmed |
| Intrabar dip below neckline, close above | No close-based confirmation; possible false breach |
| Confirmed break followed by reclaim | Possible failed breakdown |
| Price rises decisively above both peaks | Bearish candidate is undermined |
Double Top vs Range
Both structures can feature repeated resistance tests. The prior rise and the intervening low establish a double-top candidate; a neckline break distinguishes the confirmed bearish reversal pattern from price that continues circulating within support and resistance.
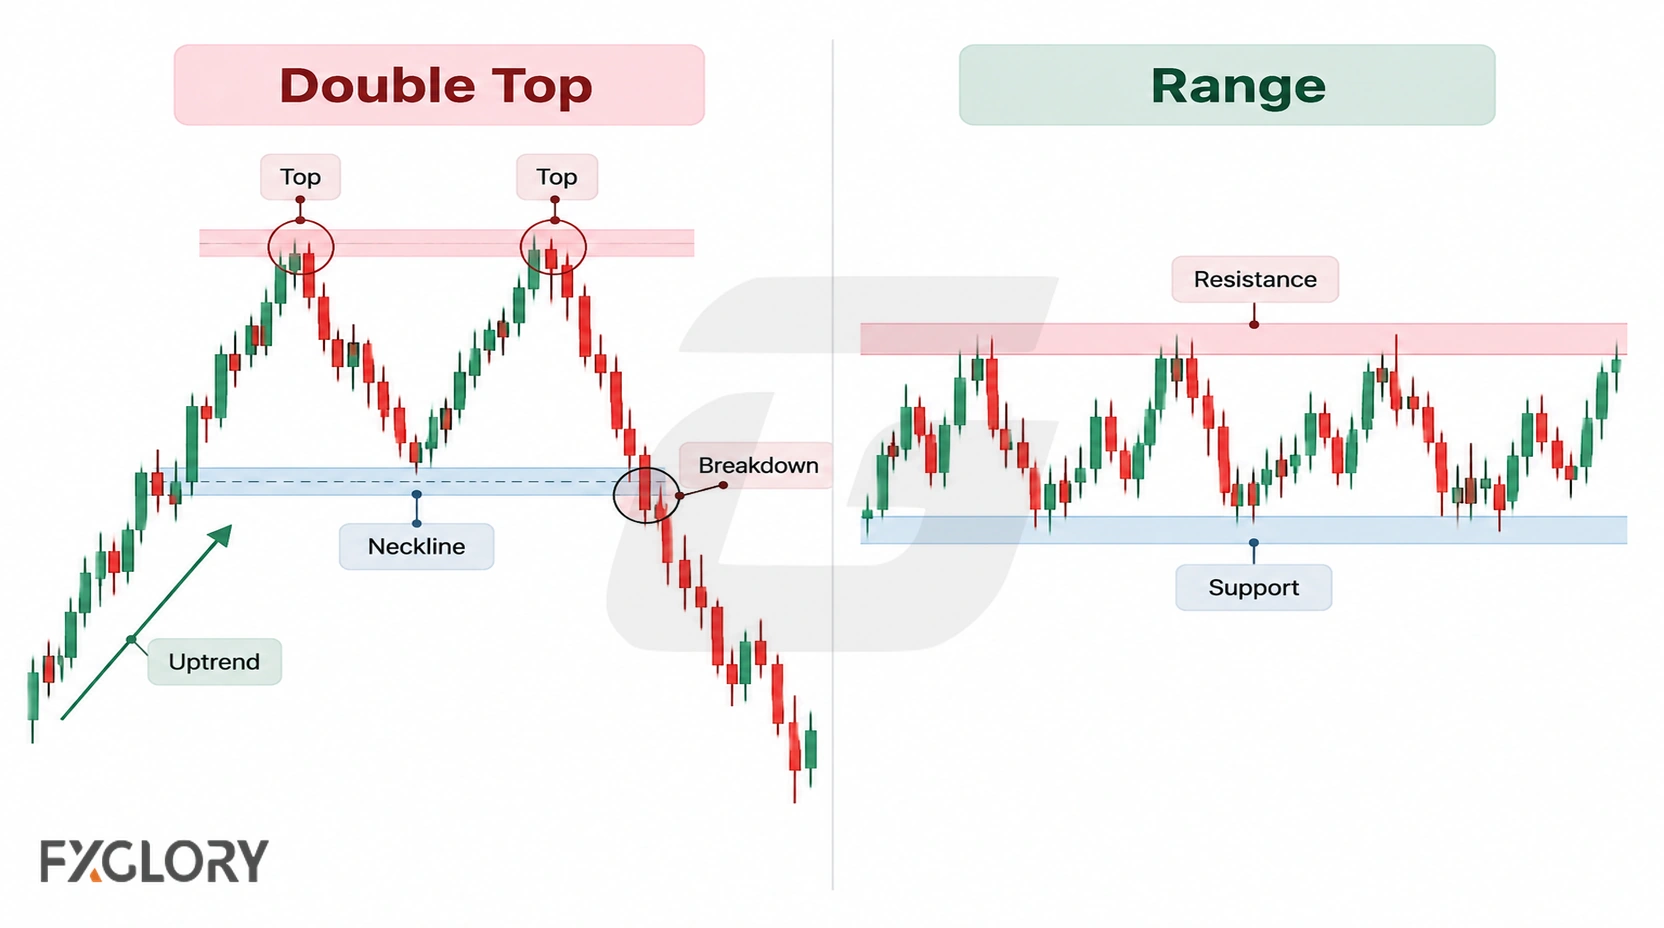
| Question | Double-top interpretation | Range interpretation |
|---|---|---|
| What preceded the highs? | Distinct upward move | Sideways rotation already underway |
| Where is the critical lower area? | Intervening pullback low creates neckline | Repeated range floor |
| What confirms the bearish break? | Chosen neckline rule is met | Until support breaks, the range can persist |
Forex Context: Sessions, News, Spread, Slippage, and Volume
Forex market conditions affect how a double top trades, even when its chart structure is clear. Sessions and economic announcements can change liquidity, volatility and the cost of executing around a neckline.
- Sessions and news: A neckline breach during thin conditions or a major release can behave differently from one in more orderly trading.
- Spread and slippage: Entry and exit prices may differ from the level drawn on the chart, particularly during fast moves.
- Timeframe: A lower-timeframe reversal may sit within a higher-timeframe uptrend.
- Tick volume: Spot forex lacks a single centralized market-volume feed; broker tick counts are not consolidated volume.
For the volume distinction, see tick-volume reading in forex.
Using Indicators and Candles With Double Tops
Indicators can describe conditions around a candidate pattern, but none replaces the neckline confirmation rule. Use them to answer a specific question, rather than collecting overlapping signals.
| Tool | Useful question | Limitation |
|---|---|---|
| Momentum (MACD, RSI) | Is momentum changing between peaks? | Divergence and overbought readings do not establish a reversal |
| ADX | How strong is the measured trend? | Trend strength is not directional confirmation of a double top |
| Volatility measures | How large are recent price moves? | Volatility does not select a stop or predict a breakout |
| Candlestick reactions | How did price respond at resistance or support? | A single candle is not the full pattern |
Read more about MACD momentum context, RSI pressure readings, ADX trend-strength context, and candlestick behavior around key areas.
Example: Reading a Double Top on GBP/USD
Hypothetical illustration, not observed market data: Suppose GBP/USD rises and then forms two peaks near 1.2700, separated by a pullback to 1.2600. If the trader has marked 1.2600 as the neckline boundary and requires a completed-candle close below it, a close at 1.2595 would satisfy that example rule. A wick below 1.2600 followed by a close above it would not.
The conventional measured-move calculation is the approximate peak-to-neckline distance: 1.2700 − 1.2600 = 0.0100, or 100 pips for GBP/USD. Projecting that distance below the 1.2600 neckline gives 1.2500 as an illustrative target reference. It is not a forecast, a guaranteed destination, or a stop-placement rule.
If price instead climbs above the peak zone, the bearish candidate weakens; if price closes below support and then reclaims it, the confirmed breakdown may fail. A separate trade plan must address execution costs, the selected stop distance and position size.
Common Mistakes With Forex Double Top Patterns
Common errors arise from confusing the chart shape, confirmation, and trade execution.
- Calling two highs confirmed: An M shape can remain a candidate while neckline support holds.
- Moving the neckline: Redrawing support after a candle breaks it makes the rule impossible to assess consistently.
- Requiring exact symmetry: Slightly different peaks can still define one resistance zone.
- Mistaking range highs for a reversal: Check whether a prior upward move exists.
- Assuming a break cannot fail: Price can reclaim support after meeting a confirmation rule.
- Confusing chart identification with risk planning: A confirmed pattern is not automatically an acceptable trade.
Beginner Workflow for the Double Top Pattern
- Identify: Find the prior rise, two resistance reactions, and intervening swing low.
- Mark: Set the resistance zone and neckline boundary on your chosen timeframe.
- Classify: Record whether the pattern is a candidate or has met a preselected neckline-break rule.
- Evaluate: Check higher-timeframe structure, news, spreads, slippage and possible false breaks.
- Plan separately: If considering a trade, define entry, trade invalidation, stop distance, position size and acceptable loss.
- Review: Compare the chart outcome with the rule you actually used, without relabeling the past.
A Safer Way to Read the Forex Double Top Pattern
The double top describes a possible bearish reversal after an upward move. Two peaks near resistance and an intervening neckline identify a candidate; a break under a clearly defined neckline rule confirms the pattern, not its eventual success.
Forex sessions, news and execution conditions can change how a confirmed structure behaves. Trade invalidation and position-risk decisions belong to a separate plan rather than to the definition of the M pattern.