Reversal Pattern Forex: Beginner Guide to Trend Exhaustion

Learn how forex reversal patterns may form after a trend weakens, how bullish and bearish reversal scenarios are read, and why confirmation, invalidation, retracement risk, timeframe, and risk control matter before assuming a trend has changed.
 
Written byHenry Green
Published
Last updated

Key Takeaways

  • A reversal pattern in forex is a chart structure that may suggest a prior trend is weakening, but it does not prove that the trend has changed.
  • Reversal patterns need a clear prior trend, visible exhaustion clues, a structure or level, confirmation behavior, and a defined invalidation point.
  • Bullish reversal patterns may appear after downward movement, while bearish reversal patterns may appear after upward movement.
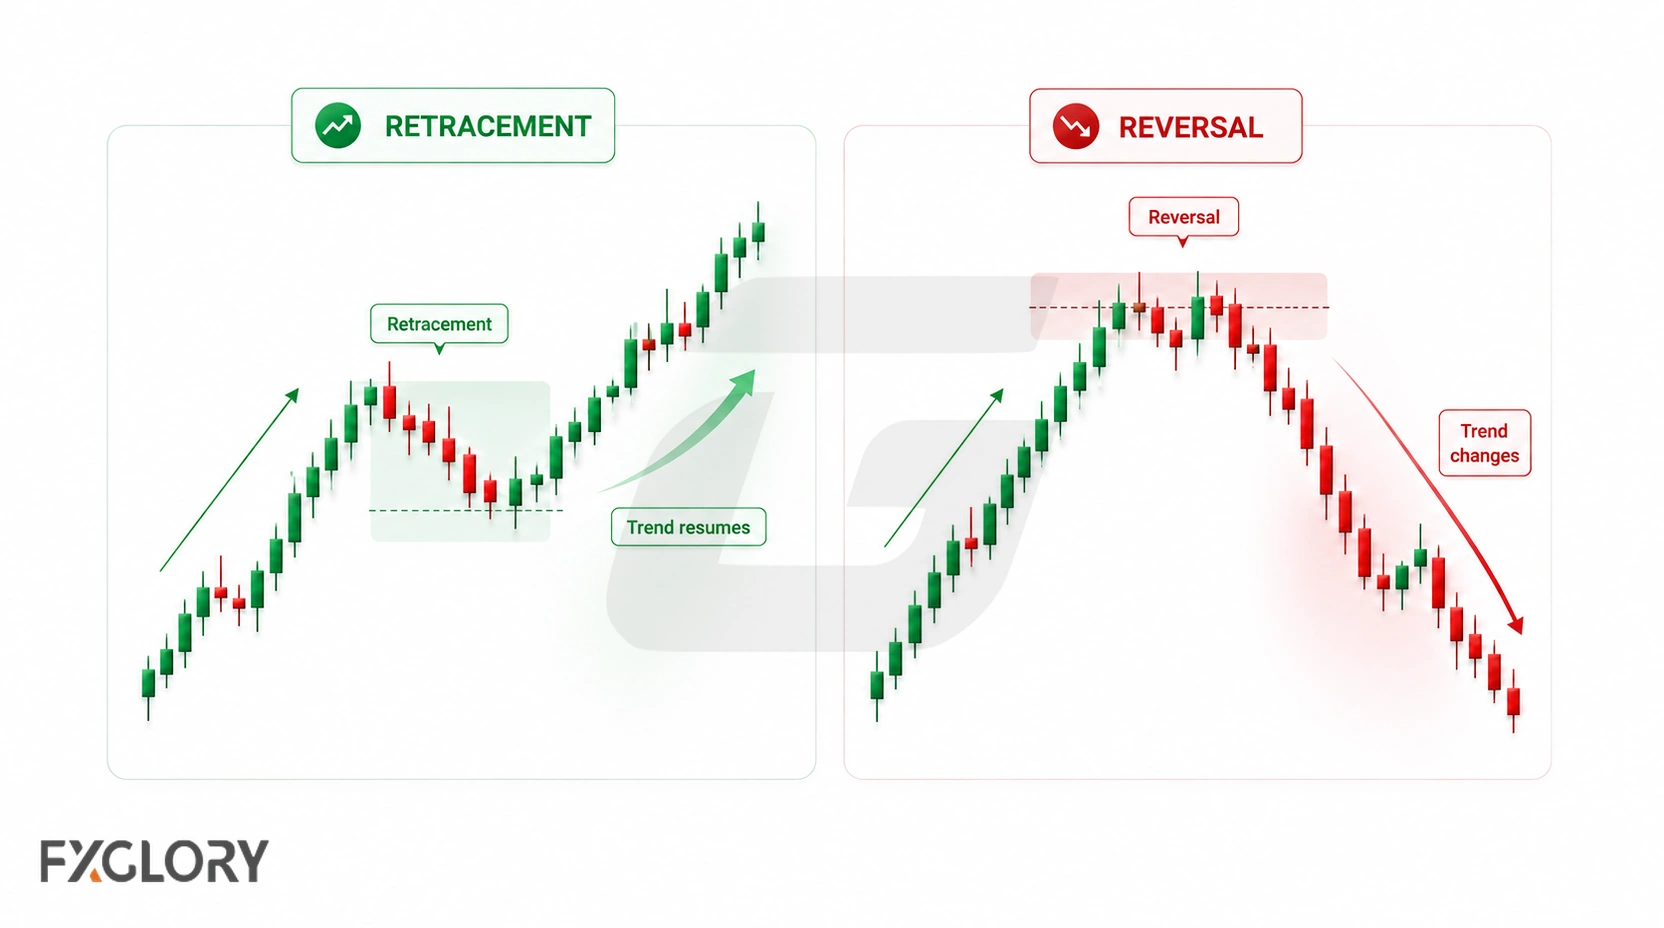
  • A retracement is not the same as a reversal; a temporary pullback can occur without changing the larger trend.
  • False reversals, news volatility, spread, slippage, timeframe conflict, weak structure, and forced pattern recognition can make reversal patterns fail.
Risk note: Forex trading involves risk of loss. Reversal patterns can help organize possible trend-change scenarios, but they do not guarantee that price will reverse, continue in a new direction, or reach a target.

What Is a Reversal Pattern in Forex?

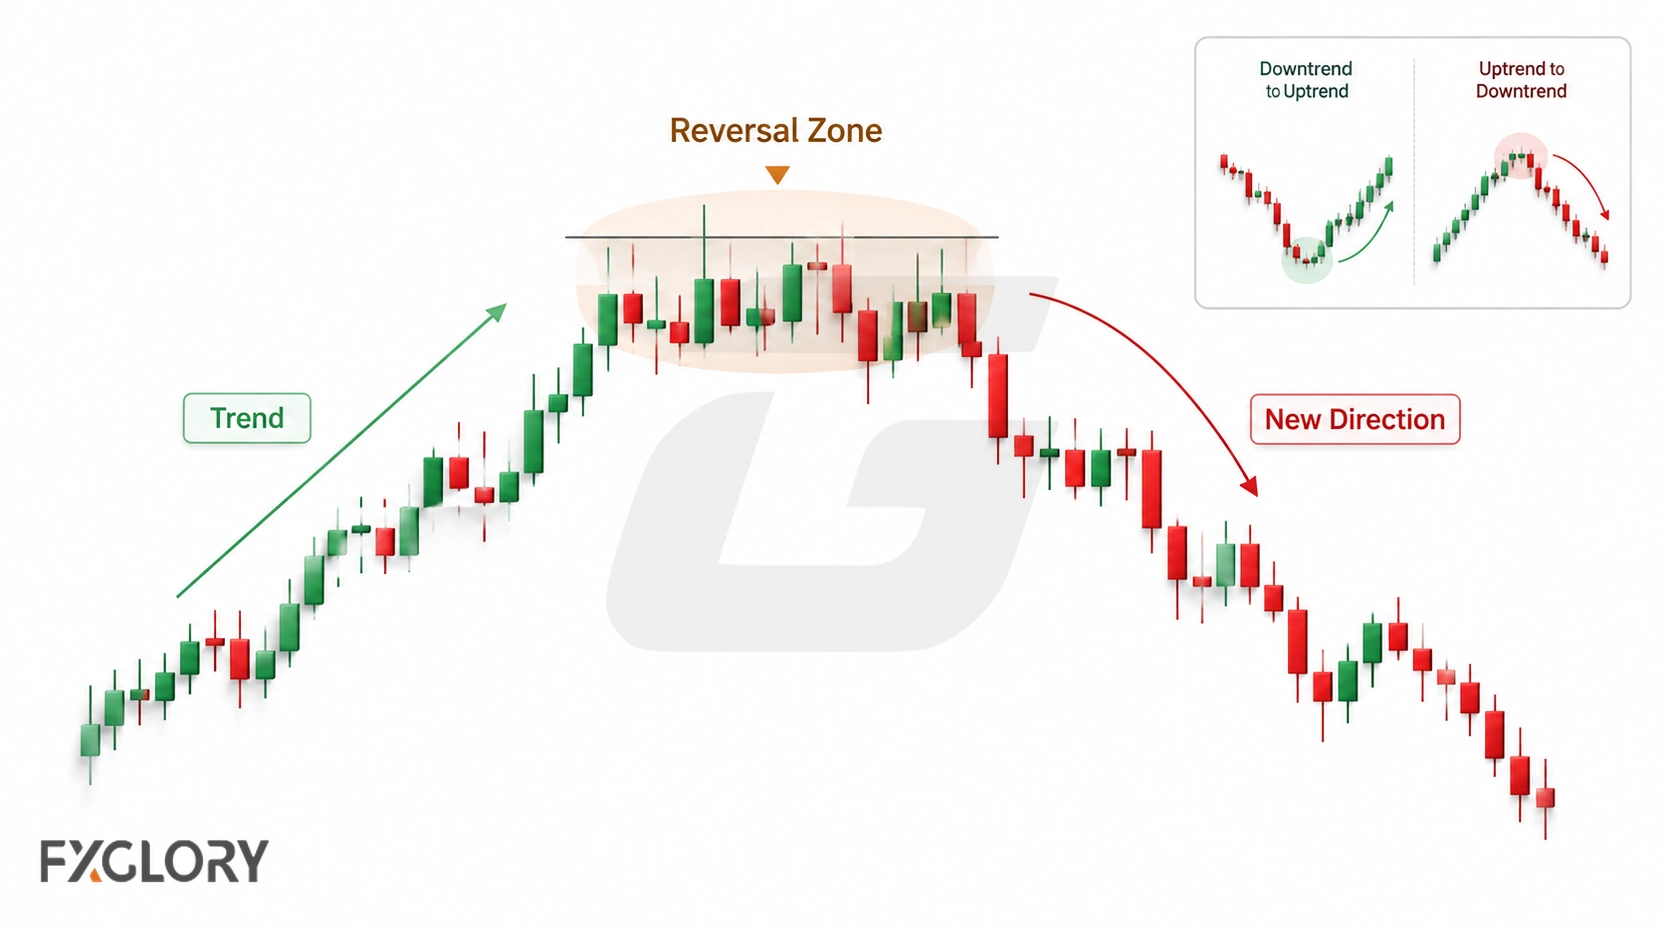
A reversal pattern in forex is a chart structure that may form when a previous trend starts to weaken. It can appear after an upward move or a downward move, and it may suggest that the market is no longer continuing with the same pressure as before.

The word reversal can sound final, but a pattern does not prove that a new trend has started. A forex reversal pattern only creates a scenario to study. Price still needs context, confirmation, invalidation, and risk control before the structure becomes useful.

A trader reviewing a reversal setup should first ask what the prior trend was, where the pattern is forming, which level matters, what would confirm a shift, and where the idea becomes wrong. For the broader chart-pattern framework, start with the full chart-pattern map.

Plain-English idea: A reversal pattern is a possible change-of-pressure structure, not proof that the market has already changed direction.

How Forex Reversal Patterns Form

Forex reversal patterns usually form after a market has already been moving in one direction. Price may stop making clean progress, react from an important area, create repeated highs or lows, form a multi-swing structure, or fail to continue beyond a previous level.

The structure develops because the old trend is being tested. Buyers may lose control after an upward move, or sellers may lose control after a downward move. That loss of control is only a possibility until price gives more evidence.

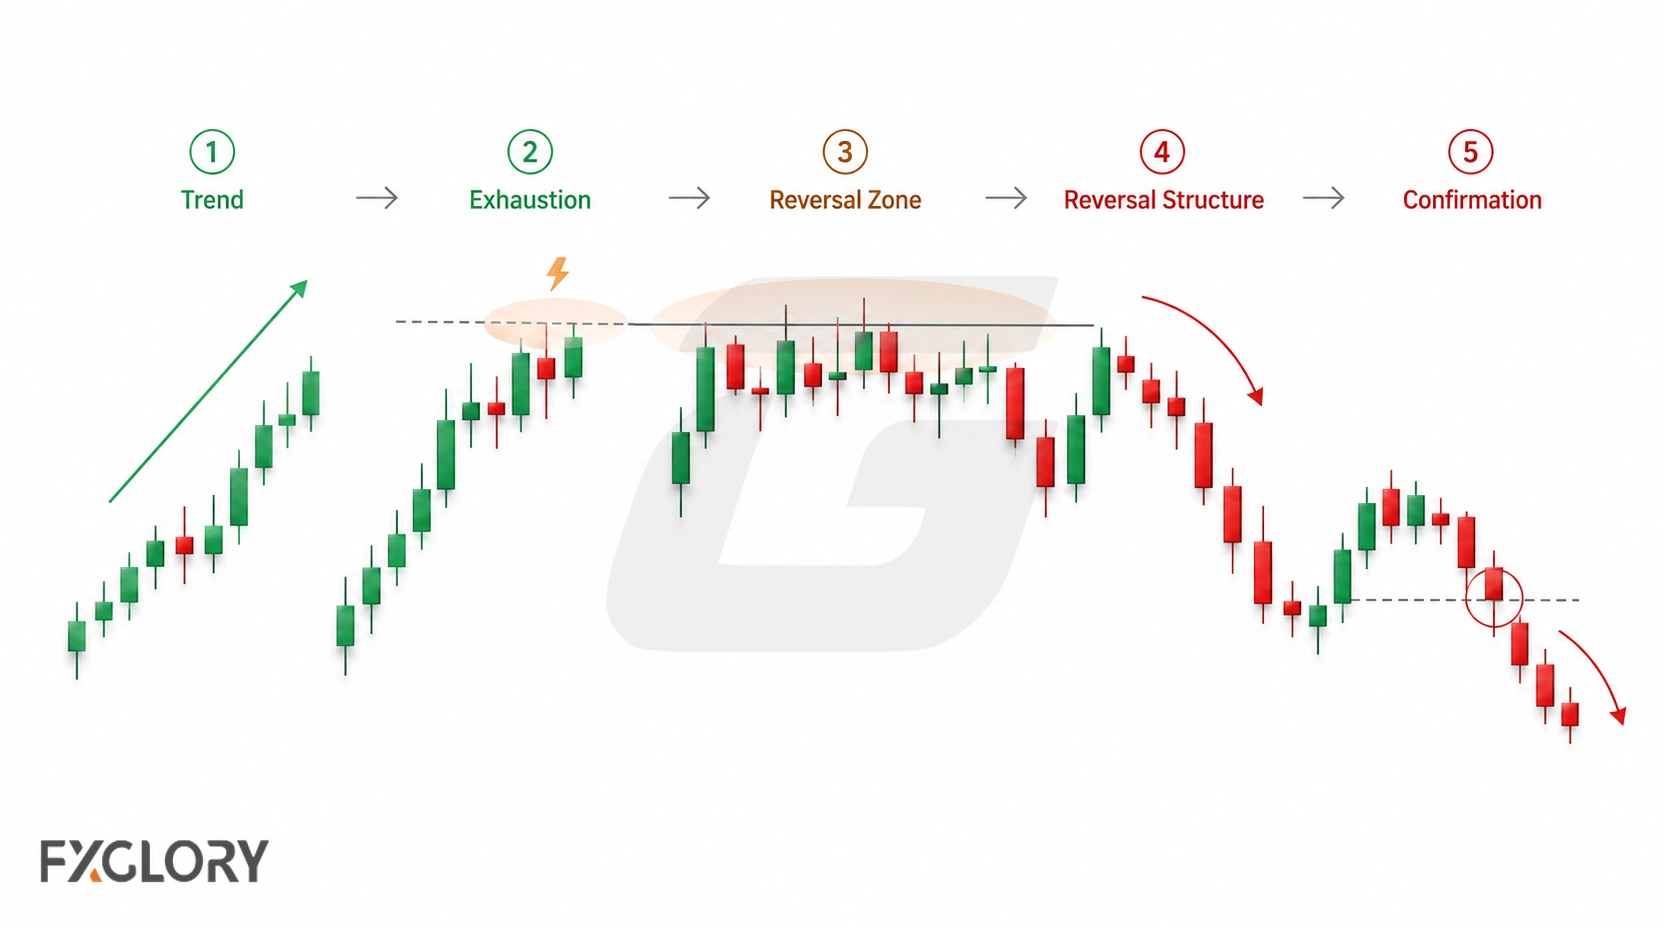
  • Prior movement: A clear upward or downward move exists before the reversal idea begins.
  • Exhaustion clue: Price struggles to continue, reacts sharply, or starts forming weaker swings.
  • Decision area: The structure forms near support, resistance, a trendline, a range edge, or another visible level.
  • Pattern structure: Price creates repeated tests, a neckline area, a wedge, or another broad chart formation.
  • Confirmation attempt: Price breaks, rejects, retests, or holds around a key boundary.

Without a clear prior movement, the same shape may simply be a range, sideways consolidation, or ordinary noise.

Core Elements of a Forex Reversal Pattern

A reversal pattern becomes easier to read when each part of the scenario is clear. If the trader cannot explain the parts, the pattern may be forced.

ElementWhat It MeansWhy It Matters
Prior trendPrice was moving clearly before the pattern appearedReversal needs something to reverse
Exhaustion behaviorPrice struggles to continue, reacts from a level, or forms weaker swingsIt shows the old pressure may be changing
Visible structureThe pattern has repeated highs, lows, neckline behavior, or a clear boundaryA clear structure helps avoid forced pattern recognition
Decision areaThe pattern forms around support, resistance, a trendline, or range edgeLocation helps explain why the structure matters
Confirmation behaviorPrice breaks, rejects, retests, or holds around the pattern boundaryIt gives more evidence than the shape alone
Invalidation pointThe area where the reversal idea becomes wrongWithout invalidation, the pattern becomes hope-based
Structure rule: A reversal pattern without a prior trend may not be a reversal pattern. It may only be range behavior.

Bullish vs Bearish Reversal Patterns

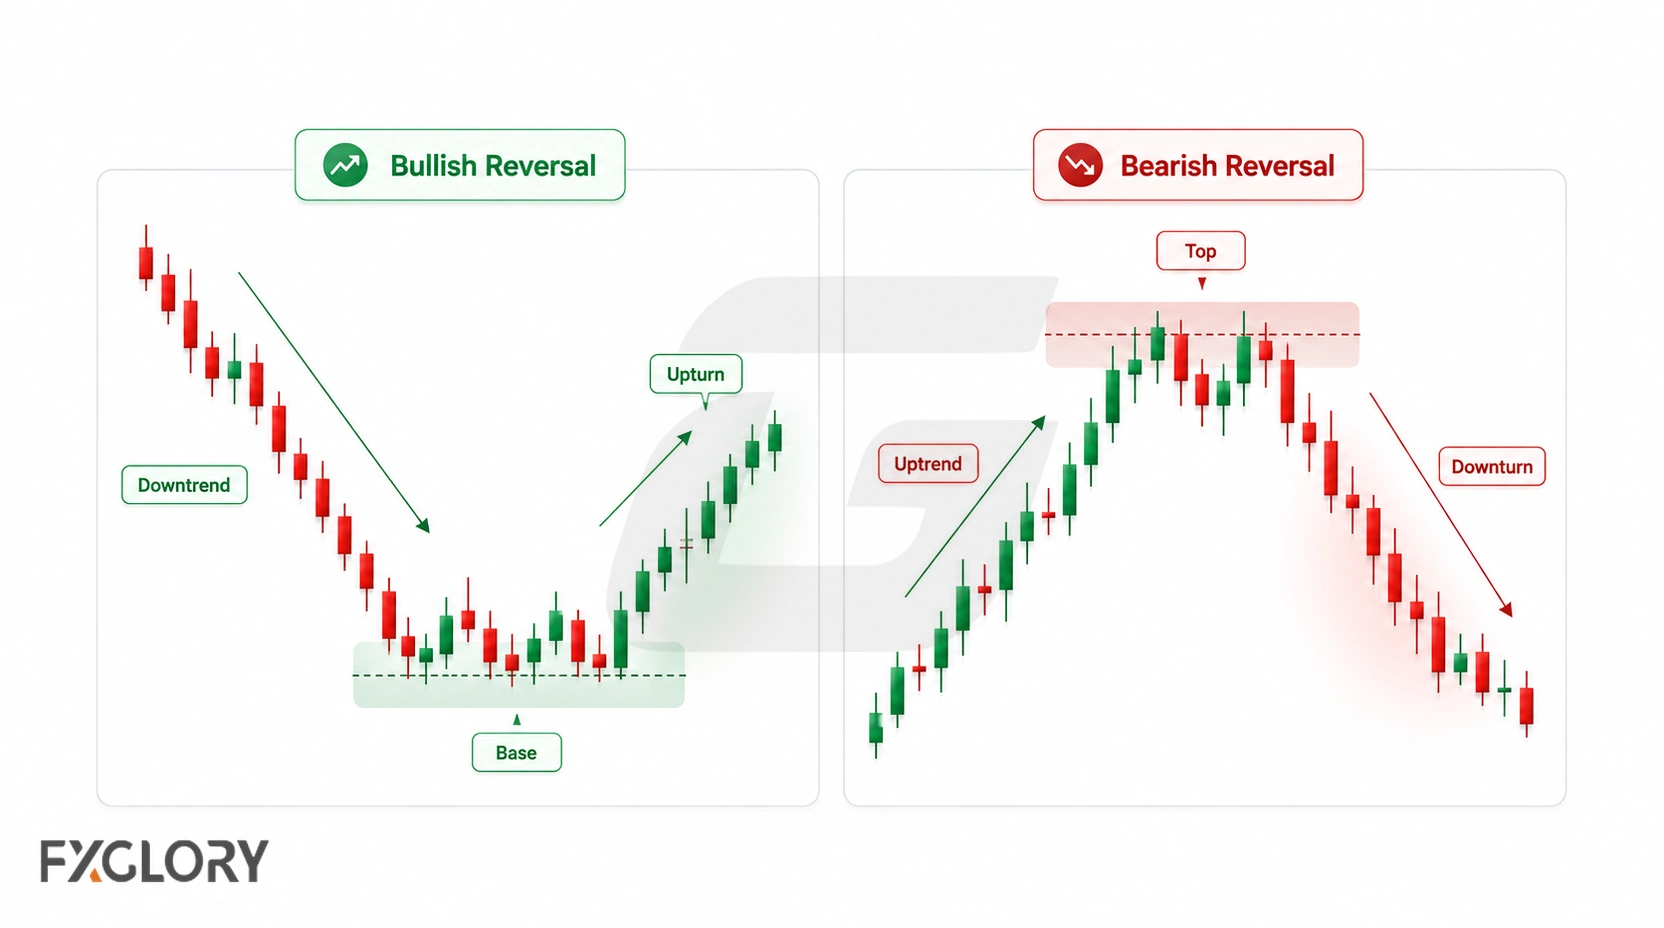
Forex reversal patterns can appear after downward movement or upward movement. The pattern direction depends on the prior trend and the way price behaves around the structure.

ScenarioPrior ContextPattern IdeaCareful Reading
Bullish reversalPrice has been moving downward before the structureSelling pressure may be weakeningDo not assume a new uptrend until price confirms the relevant boundary or holds the structure
Bearish reversalPrice has been moving upward before the structureBuying pressure may be weakeningDo not assume a new downtrend until price confirms the relevant boundary or holds the structure
Unclear reversalThe prior move is choppy, mixed, or already range-boundThe pattern may not have enough trend contextRead it as range behavior or neutral structure until price gives clearer evidence
Direction rule: Bullish or bearish reversal depends on prior trend, location, confirmation, and invalidation, not on the pattern name alone.

Reversal vs Retracement in Forex

A retracement is a temporary move against the current trend. A reversal suggests that the broader direction may be changing. The two can look similar while they are forming, especially on lower timeframes.

This is one of the most important distinctions for beginners. A market can pull back sharply and still continue in the original direction. A retracement becomes more serious only when it starts removing the structure that supported the old trend. If every pullback is treated as a reversal, the trader may fight the larger trend too early.

QuestionRetracement ClueReversal Clue
Prior trendThe broader trend remains intactThe trend begins to lose structure
DepthPrice pulls back but does not remove key structurePrice breaks or holds beyond important levels
TimeframeThe move may be small compared with the higher timeframeThe shift appears on a more meaningful timeframe
ConfirmationThe pullback fails and old trend pressure returnsPrice confirms a new structure or rejects the old trend direction
InvalidationThe original trend idea remains validThe old trend idea becomes weaker or invalid
Retracement warning: A sharp pullback is not automatically a trend reversal. The larger structure still matters.

Common Forex Reversal Patterns

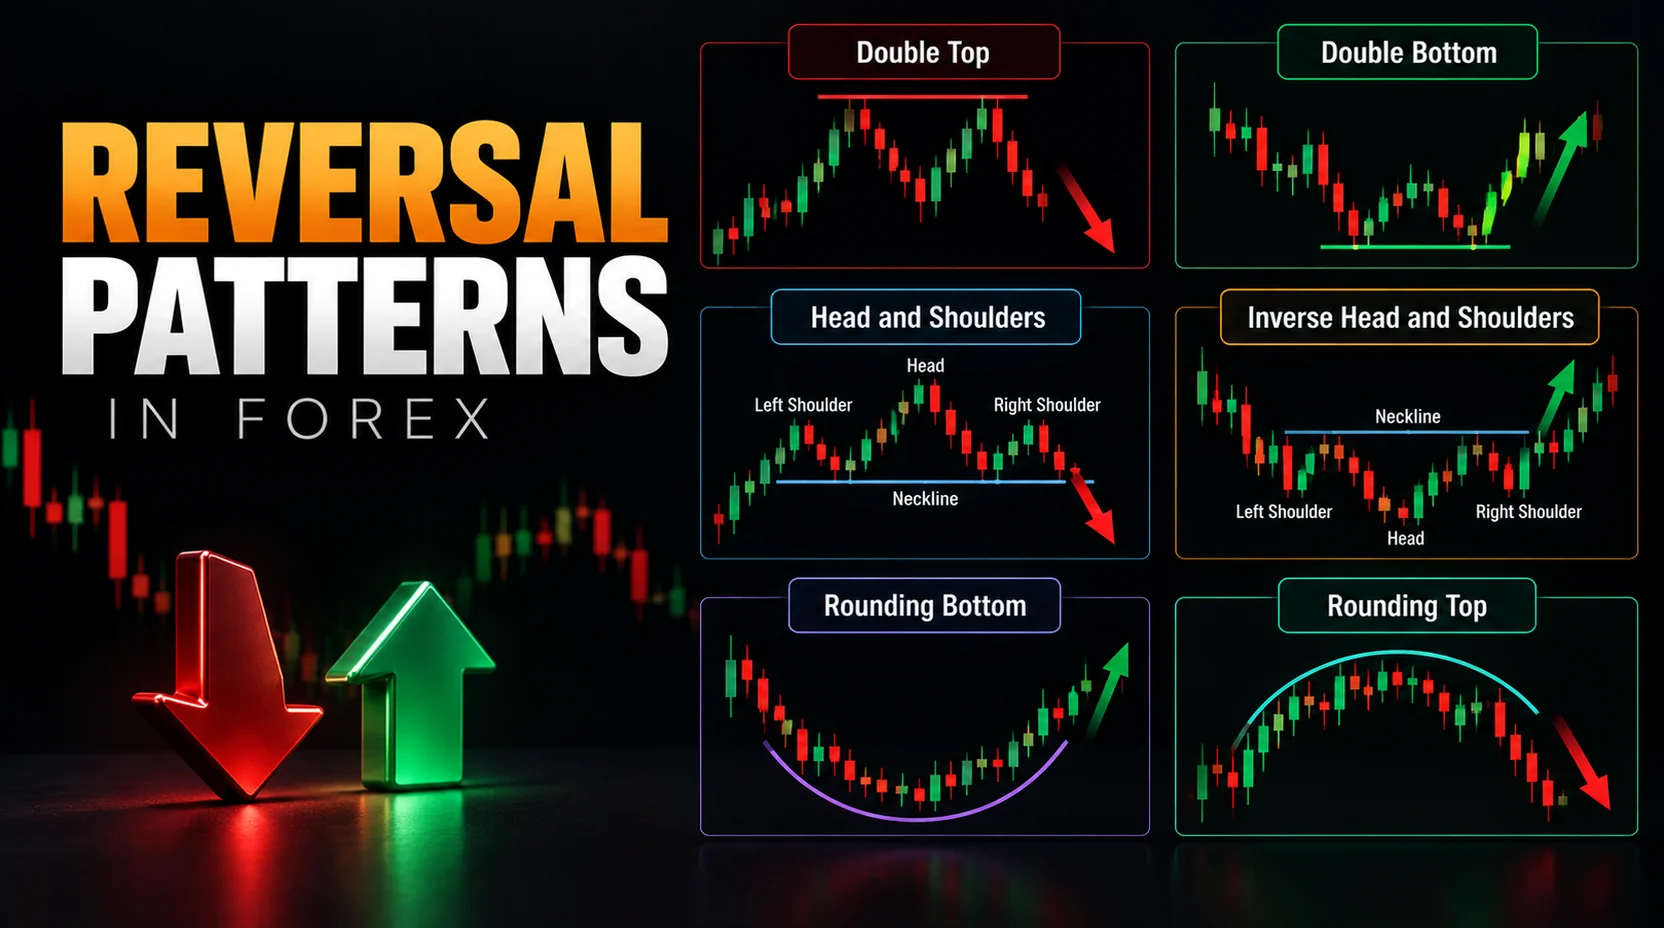
Many chart structures can behave like reversal patterns when they form after a clear prior move and show enough confirmation. The pattern name is less important than the trend before it, the decision area, the structure, and the invalidation point.

PatternTypical Reversal ContextWhat to CheckRelated Pattern
Double topAfter an upward move, price reacts twice near a similar resistance areaWhether the middle support area breaks or holdsthe second test of resistance
W pattern / double bottomAfter a downward move, price reacts twice near a similar support areaWhether the middle resistance area breaks or holdsthe W-shaped support reaction
Head and shouldersAfter an upward move, price forms a multi-swing structure around a necklineWhether neckline behavior confirms a pressure shiftthe neckline-based swing structure
Inverse head and shouldersAfter a downward move, price forms a multi-swing structure around a necklineWhether price can hold above the neckline areathe inverse neckline structure
Triple top / triple bottomRepeated reactions from a similar high or low areaWhether the repeated level leads to a real structure breakReference only
Wedge reversalNarrowing movement after a mature trend or near a key areaSlope, location, boundary behavior, and confirmationangled exhaustion behavior
Diamond, spike, Quasimodo, or sushi rollLess common reversal labels that may describe unusual or volatile turning behaviorWhether the structure is clear enough to avoid forcing the labelReference only

For a quick comparison of reversal patterns against continuation and neutral structures, use the chart-pattern reference sheet.

Context rule: A double top, W pattern, head and shoulders, wedge, or triple structure matters only when the surrounding price behavior supports the reversal reading.

Strong vs Weak Forex Reversal Patterns

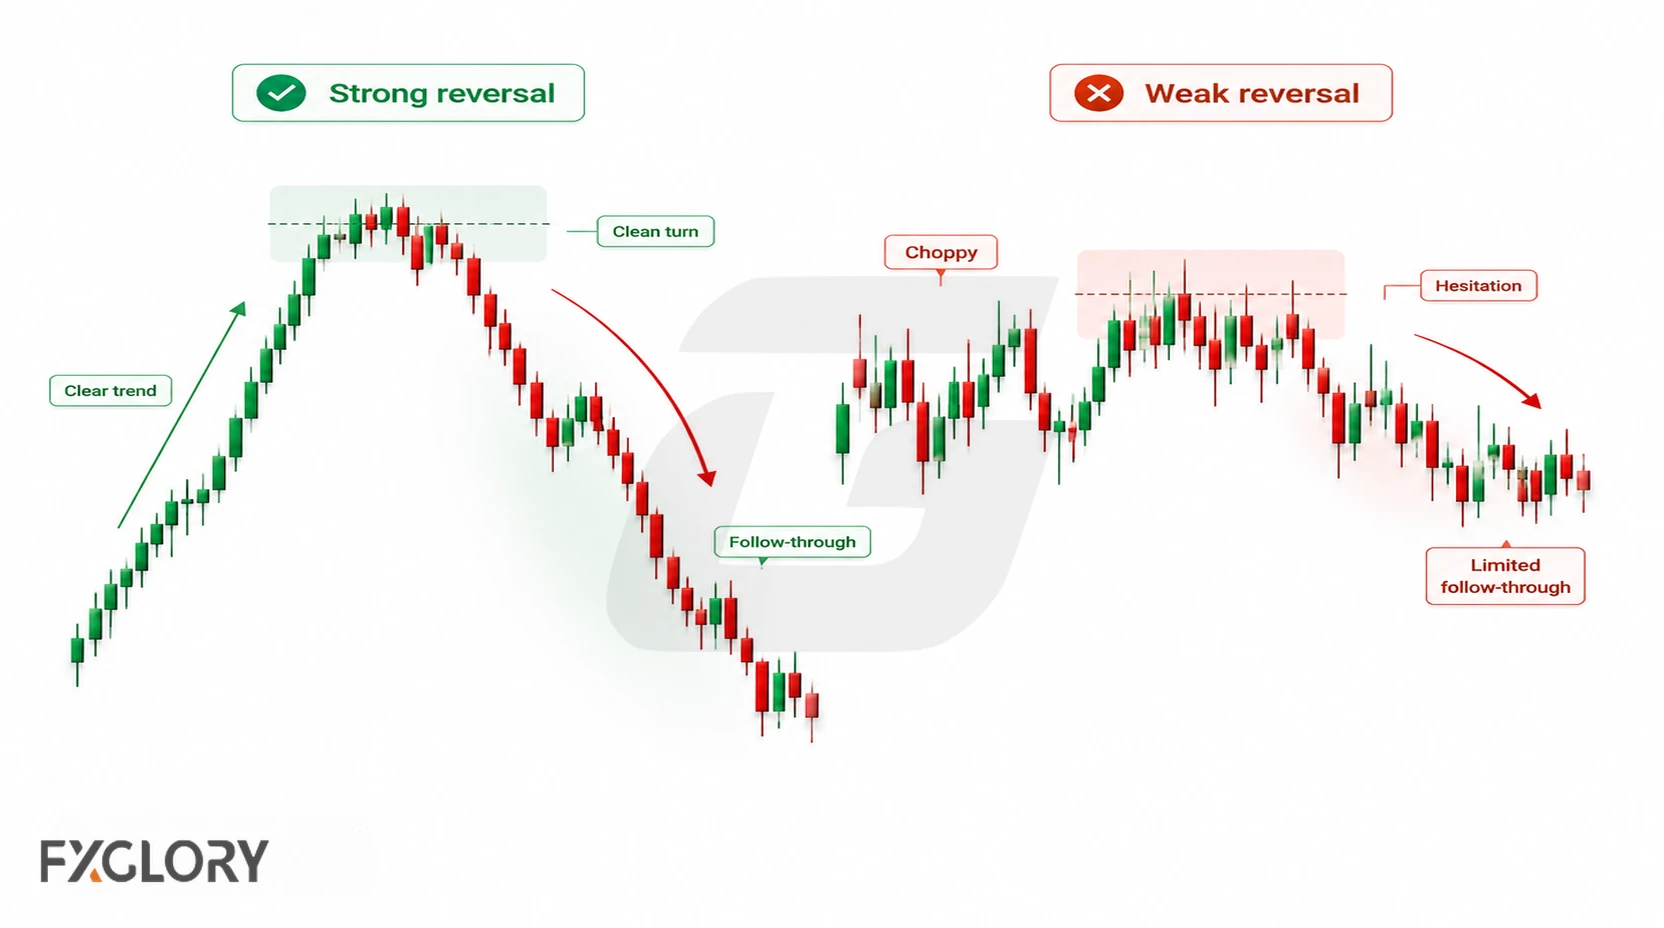
A strong reversal pattern is not just a recognizable shape. It has a prior trend, a meaningful location, a visible structure, and a clear point where the reversal idea becomes wrong.

Chart FactorStronger Reversal ConditionWeaker Reversal Condition
Prior trendThe earlier direction is clear before the pattern appearsThe market was already choppy or sideways
LocationThe structure forms around visible support, resistance, a trendline, or range edgeThe pattern appears in the middle of unclear movement
ExhaustionPrice struggles to continue or reacts strongly from a meaningful areaThe old trend still makes clean progress
StructureThe pattern can be explained without forcing lines or ignoring swingsThe pattern only appears after adjusting the chart to fit the label
ConfirmationPrice breaks, rejects, retests, or holds around the decision areaThe trader enters only because the shape resembles a pattern
Timeframe alignmentThe reversal idea does not fight a stronger higher-timeframe structureA small reversal pattern pushes against the larger trend
Risk planInvalidation and position risk are defined before actingThe trader focuses on the possible turn but not the wrong point
Quality rule: A weak reversal pattern is not improved by giving it a stronger name. If the trend-change story is unclear, the pattern is unclear.

How to Confirm a Forex Reversal Pattern

Confirmation does not prove that a reversal will continue. It only shows that price has given more information than the pattern shape alone.

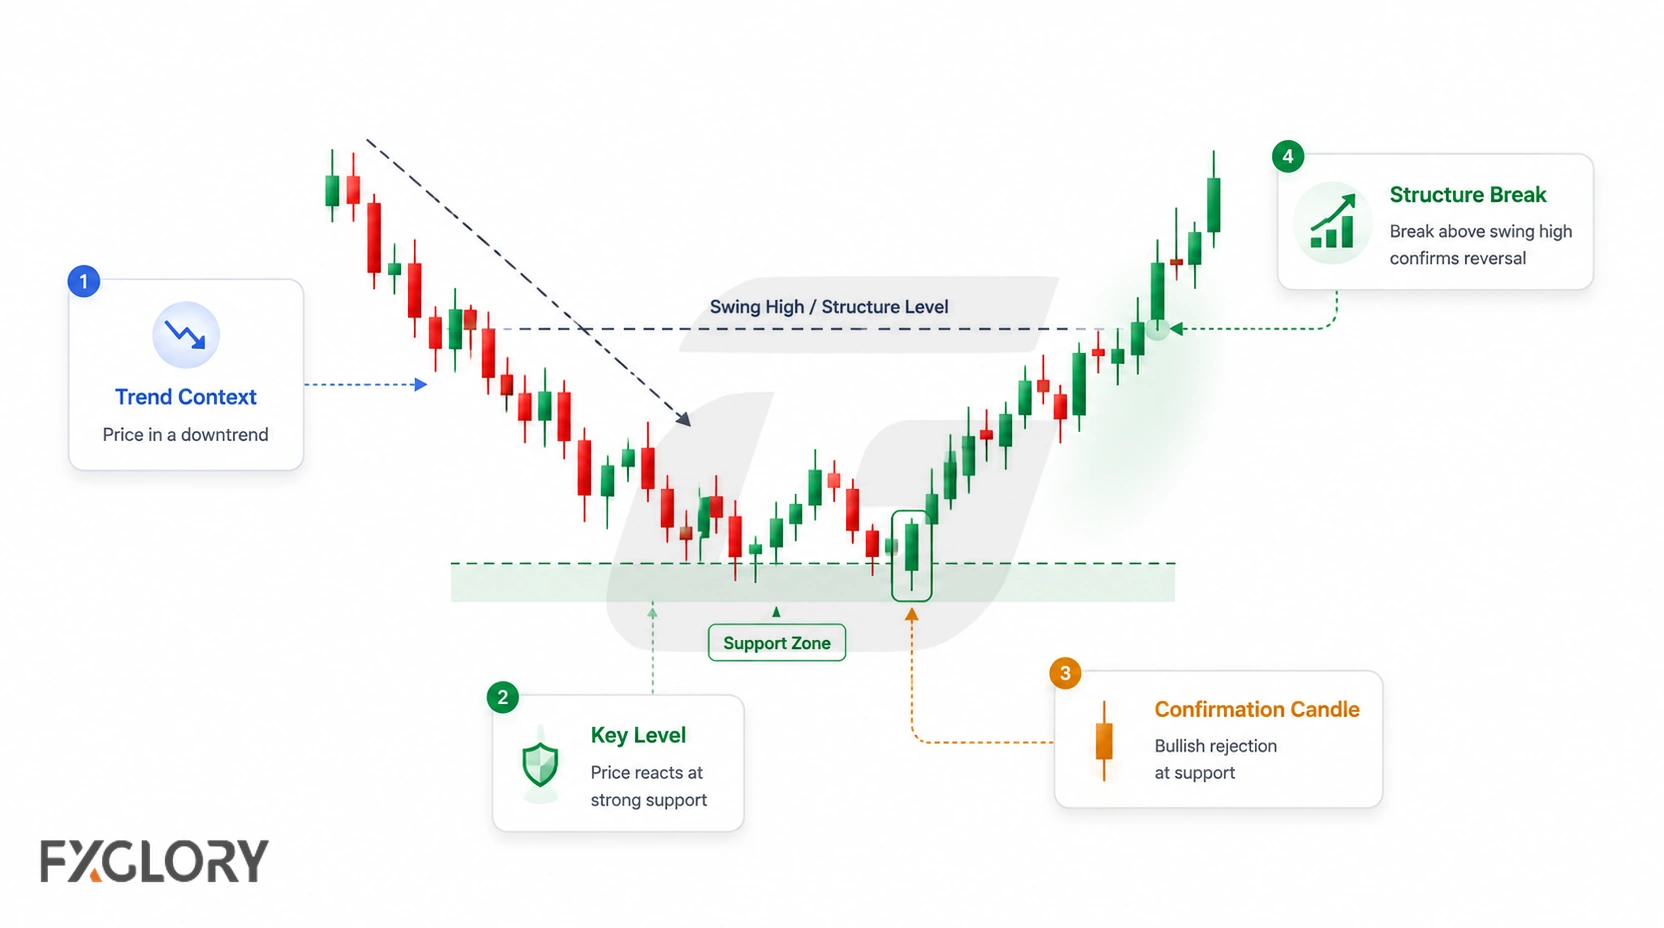
  1. Check the prior trend: Is there a clear move before the reversal idea?
  2. Find the decision area: Is price reacting from support, resistance, a trendline, a neckline, or another visible boundary?
  3. Read the structure: Is the pattern clear without forcing it?
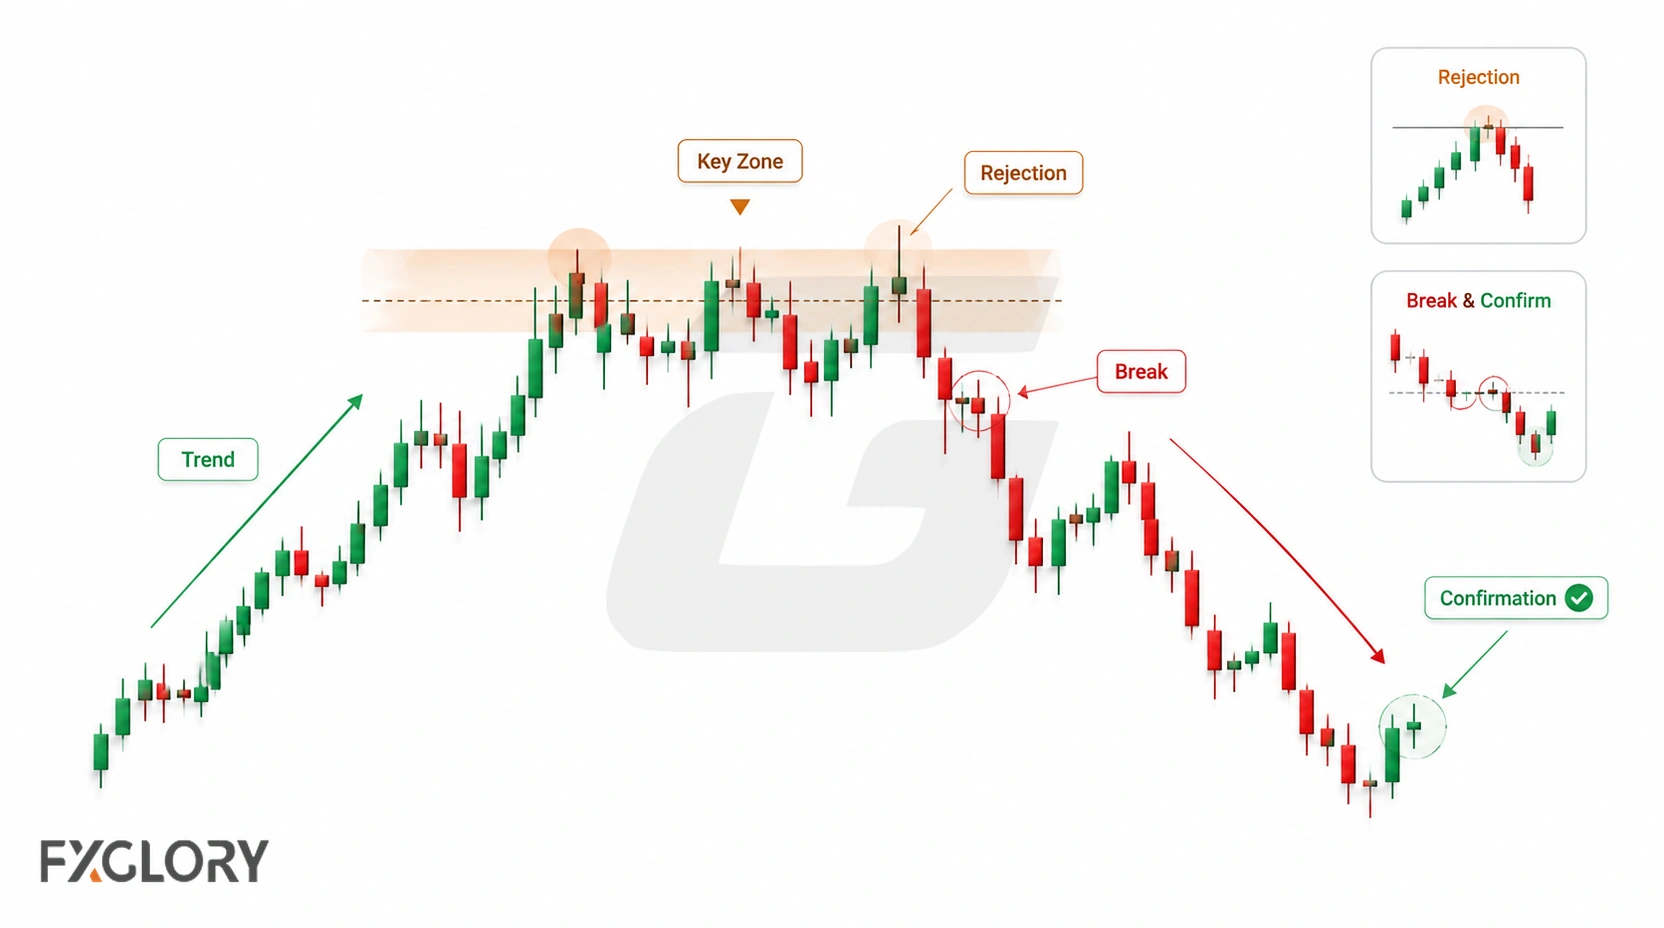
  4. Watch the break or rejection: Does price move beyond an important boundary, reject the old trend direction, or hold a new area?
  5. Check the close: Does price hold beyond the structure or only spike briefly?
  6. Watch the retest: If price returns to the broken area, does the area still matter?
  7. Look for supporting context: Momentum, divergence, candle reaction, trend strength, or volatility may support or weaken the idea.
  8. Define invalidation: Decide what price behavior cancels the reversal idea.

A reversal pattern becomes more useful when the trader can explain the prior trend, the exhaustion clue, the decision area, the confirmation behavior, and the wrong point without forcing the chart.

Invalidation: When the Reversal Idea Fails

Invalidation is the condition that shows the reversal idea is no longer useful. It should be defined before a trader focuses on any possible target or new trend scenario.

  • Old trend resumes: Price breaks the reversal structure and continues in the prior direction.
  • False break: Price breaks a neckline, support, resistance, or boundary, then returns back inside the structure.
  • Range behavior: The pattern turns into ordinary sideways movement instead of a new direction.
  • Higher-timeframe conflict: The reversal idea forms against a stronger higher-timeframe structure.
  • News-driven shift: A high-impact event changes volatility and makes the structure less useful.
  • No clear wrong point: The trader cannot explain where the reversal idea is invalid.

Some reversal methods use measured projections from a pattern height or swing structure to plan possible target zones. This can help organize a scenario, but it should not be treated as a promise that price will reach the projected area. Price may stall, retest, range, resume the old trend, or reverse again before any projected area is reached.

Wrong-point rule: A reversal pattern is incomplete if the trader can name the pattern but cannot name the invalidation point.

When a Pattern Is Not Really a Reversal Pattern

Some patterns look like reversals while they are forming, but the market context does not support that reading. A reversal label should not be forced onto every pullback or reaction.

SituationWhy It Weakens ReversalBetter Reading
No prior trendThere is no clear movement for price to reverseRange or neutral structure
Simple pullbackPrice moves against the trend but does not break meaningful structureRetracement
Old trend holdsPrice reacts but the prior trend resumes cleanlyContinuation or failed reversal
Messy sideways movementThe structure is too wide, volatile, or unclearUnclear market condition
Repeated false breaksThe market keeps trapping breakout attemptsRange, liquidity sweep, or unstable structure
News volatilityPrice behavior is driven by fast event movementWait for structure to rebuild

When a pattern starts behaving like a pause instead of a trend change, compare it with trend-pause pattern context instead of forcing a reversal label.

Forex Context: Sessions, News, Spread, Slippage, and Volume

Forex reversal patterns should be read with market conditions because currency pairs trade across global sessions. A turning structure may look clear during quiet movement but behave differently during a session overlap, economic release, or fast volatility shift.

  • Session behavior: Reversal attempts during active sessions may behave differently from moves during thin liquidity.
  • News events: Economic releases and central-bank comments can overpower a technical structure quickly.
  • Spread and slippage: Fast movement around reversal boundaries can affect execution and risk.
  • Pair behavior: Different currency pairs may react differently around support, resistance, and turning areas.
  • Timeframes: A lower-timeframe reversal pattern can conflict with a stronger higher-timeframe trend.
  • Volume limits: Spot forex does not have one centralized exchange volume figure, so volume-style readings need careful interpretation.

Some traders use tick activity as one supporting clue rather than a complete market-volume answer. When volume-style context matters, tick-volume reading in forex should stay secondary to structure, confirmation, and risk.

Using Indicators and Candles With Reversal Patterns

Indicators and candlestick reactions can support reversal-pattern analysis, but they should not replace price structure. The pattern still needs a prior trend, exhaustion behavior, a decision area, confirmation, and invalidation.

Tool TypeWhat It Can Help ReadCareful Use
Momentum indicatorsWhether pressure is fading or diverging from price movementDivergence can continue for some time and needs context
Trend indicatorsWhether the old trend is weakening or still intactThey may lag after price has already moved
Volatility indicatorsWhether movement is expanding, contracting, or unstableHigh volatility can increase execution risk
Candlestick reactionsShort-term rejection or hesitation near a decision areaOne candle is not the same as a full chart reversal pattern
Tick activityActivity around a breakout, rejection, or retestIt is supporting context, not centralized market volume

Overbought or oversold readings may show stretched conditions, but they are not reversal proof. A market can remain stretched while the trend continues, so those readings should be checked against structure, confirmation, invalidation, and risk.

When momentum or divergence is part of the reversal reading, MACD momentum context or RSI pressure readings may help organize the analysis. When candle reaction matters near a turning area, reversal candle behavior can add short-term detail without replacing the broader chart structure.

Example: Reading a Reversal Pattern on GBP/USD

Suppose GBP/USD has been moving upward, then price stops making clean upward progress near a resistance area and begins forming weaker swing behavior. A trader may first describe the market as an upward move that is losing structure, without naming the pattern too early.

If price later breaks a relevant support or structure boundary and holds below it, that may create a bearish reversal scenario. If price recovers and continues above the resistance area, the reversal idea weakens. If price stays between the same areas, the structure may still be a range rather than a completed reversal.

The useful questions are simple: Was there a clear prior trend? Is the reaction area meaningful? Which boundary matters? What would confirm reversal? Where is the idea wrong?

Example note: This is not a trade recommendation or signal. It shows how a reversal pattern can be organized into possible scenarios before any trading decision.

Common Mistakes With Forex Reversal Patterns

Reversal-pattern mistakes often happen when traders see a pullback and assume the trend has changed.

  • Calling every pullback a reversal: A retracement can happen without changing the larger trend.
  • Ignoring the prior trend: The trader labels a pattern as reversal even though the earlier move is unclear.
  • Entering before confirmation: The trader reacts to a shape before price breaks, rejects, retests, or holds.
  • Forcing a pattern name: A messy range is treated as a clean double top, W pattern, head and shoulders, or wedge.
  • Ignoring false breaks: Price leaves the structure briefly and then returns inside.
  • Missing higher-timeframe context: A small reversal pattern fights a larger trend or key level.
  • Overusing volume assumptions: Volume-style clues are treated as if spot forex had one centralized exchange volume figure.
  • No invalidation: The trader knows the expected turn but not the point where the idea is wrong.

Beginner Workflow for Forex Reversal Patterns

A clear process helps keep reversal patterns from becoming guesswork.

  1. Start with the prior trend: Identify whether price was clearly rising or falling before the pattern.
  2. Look for exhaustion: Check whether price is struggling to continue or reacting from a meaningful area.
  3. Mark the decision area: Draw only the support, resistance, neckline, range edge, or trendline that is visible without forcing it.
  4. Compare the structure: Decide whether the setup resembles a double top, W pattern, head and shoulders, wedge, or another reversal structure.
  5. Separate retracement from reversal: Check whether the larger trend is still intact.
  6. Wait for evidence: Look for breakout, close, retest, rejection, or supporting context.
  7. Define invalidation: Mark where the reversal idea becomes wrong.
  8. Check forex conditions: Consider session, news, spread, slippage, volatility, and pair behavior.
  9. Review the outcome: Whether the idea works or fails, check if the reversal reading was actually clear.

This process keeps the focus on market structure instead of treating reversal patterns as automatic entries.

A Safer Way to Read Forex Reversal Patterns

Forex reversal patterns help traders organize possible trend-change scenarios. They can make turning structures easier to describe, but they do not remove uncertainty from trading.

The strongest reversal ideas begin with a clear prior trend, visible exhaustion, a meaningful decision area, confirmation behavior, and a defined invalidation point. If these parts are missing, the pattern may not be ready for a trading decision.

Reversal analysis becomes more useful when it is read with context. Session behavior, news, spread, slippage, volatility, timeframe alignment, pair behavior, position size, and account risk still matter.

Final risk reminder: A forex reversal pattern is only one part of a trading decision. A possible turn does not guarantee a new trend, and every scenario needs confirmation, invalidation, and risk control.

Frequently Asked Questions

What is a reversal pattern in forex?

A reversal pattern in forex is a chart structure that may suggest a previous trend is weakening and that price could be preparing for a change in direction. It helps organize a reversal scenario, but it does not guarantee that a new trend has started.

What are common forex reversal patterns?

Common forex reversal patterns include double tops, double bottoms, W patterns, head and shoulders, inverse head and shoulders, triple tops and bottoms, some wedge structures, and some broader exhaustion formations.

What is the difference between a reversal and a retracement?

A retracement is a temporary move against the current trend, while a reversal suggests a possible change in the broader direction. A pullback can look like a reversal at first, so traders need confirmation and timeframe context.

Do forex reversal patterns always work?

No. Forex reversal patterns can fail because the prior trend resumes, the breakout is false, the pattern is forced, news changes market conditions, or the trader has no clear invalidation point.

What makes a reversal pattern stronger?

A reversal pattern is stronger when the prior trend is clear, price shows visible exhaustion, the structure is easy to explain, confirmation appears near a key boundary, and the invalidation point is defined.

What makes a reversal pattern weak?

A reversal pattern is weak when there is no clear prior trend, the structure is unclear, price is only pulling back, confirmation is missing, or the pattern conflicts with higher-timeframe structure.

Are candlestick reversal patterns the same as chart reversal patterns?

No. Candlestick reversal patterns usually focus on one candle or a small group of candles, while chart reversal patterns usually form across a broader structure with multiple swings, levels, or trendlines.

Can indicators confirm forex reversal patterns?

Indicators can help traders read momentum, trend strength, volatility, divergence, or tick activity around a reversal pattern. They should be treated as supporting context, not proof that price will reverse.

Why do reversal patterns fail?

Reversal patterns can fail because the trend remains strong, price makes a false break, the pattern is inside a range, news changes conditions, liquidity is thin, spread or slippage affects execution, or invalidation is unclear.

Should beginners trade reversal patterns alone?

Beginners should not treat reversal patterns as complete trade signals. A reversal idea should be connected to trend context, support or resistance, confirmation, invalidation, position size, and risk control.

Related Contents

Forex Chart PatternsReturn to the broader chart-pattern guide for reversal, continuation, neutral, and harmonic pattern context.
Forex Chart Patterns Cheat SheetUse the reference sheet to compare reversal patterns with other chart-pattern groups.
Double Top Pattern ForexStudy repeated resistance reactions after an upward move.
W Pattern ForexReview the W-shaped support reaction often compared with a double bottom.
Head and Shoulders ForexUnderstand neckline structure, swing formation, confirmation, and invalidation.
Wedge Pattern ForexRead rising and falling wedge structures with location, slope, and confirmation context.
Forex CandlestickCompare broader chart reversal structures with candle-level reactions around key areas.
Forex Technical IndicatorsUse indicator concepts to think about momentum, trend strength, volatility, and confirmation context.

Practice Reading Reversal Scenarios Before Trading Live

Use an FXGlory demo account to practice identifying reversal patterns, testing market scenarios, placing demo orders, and reviewing decisions before using real money.

Open a Demo Account