
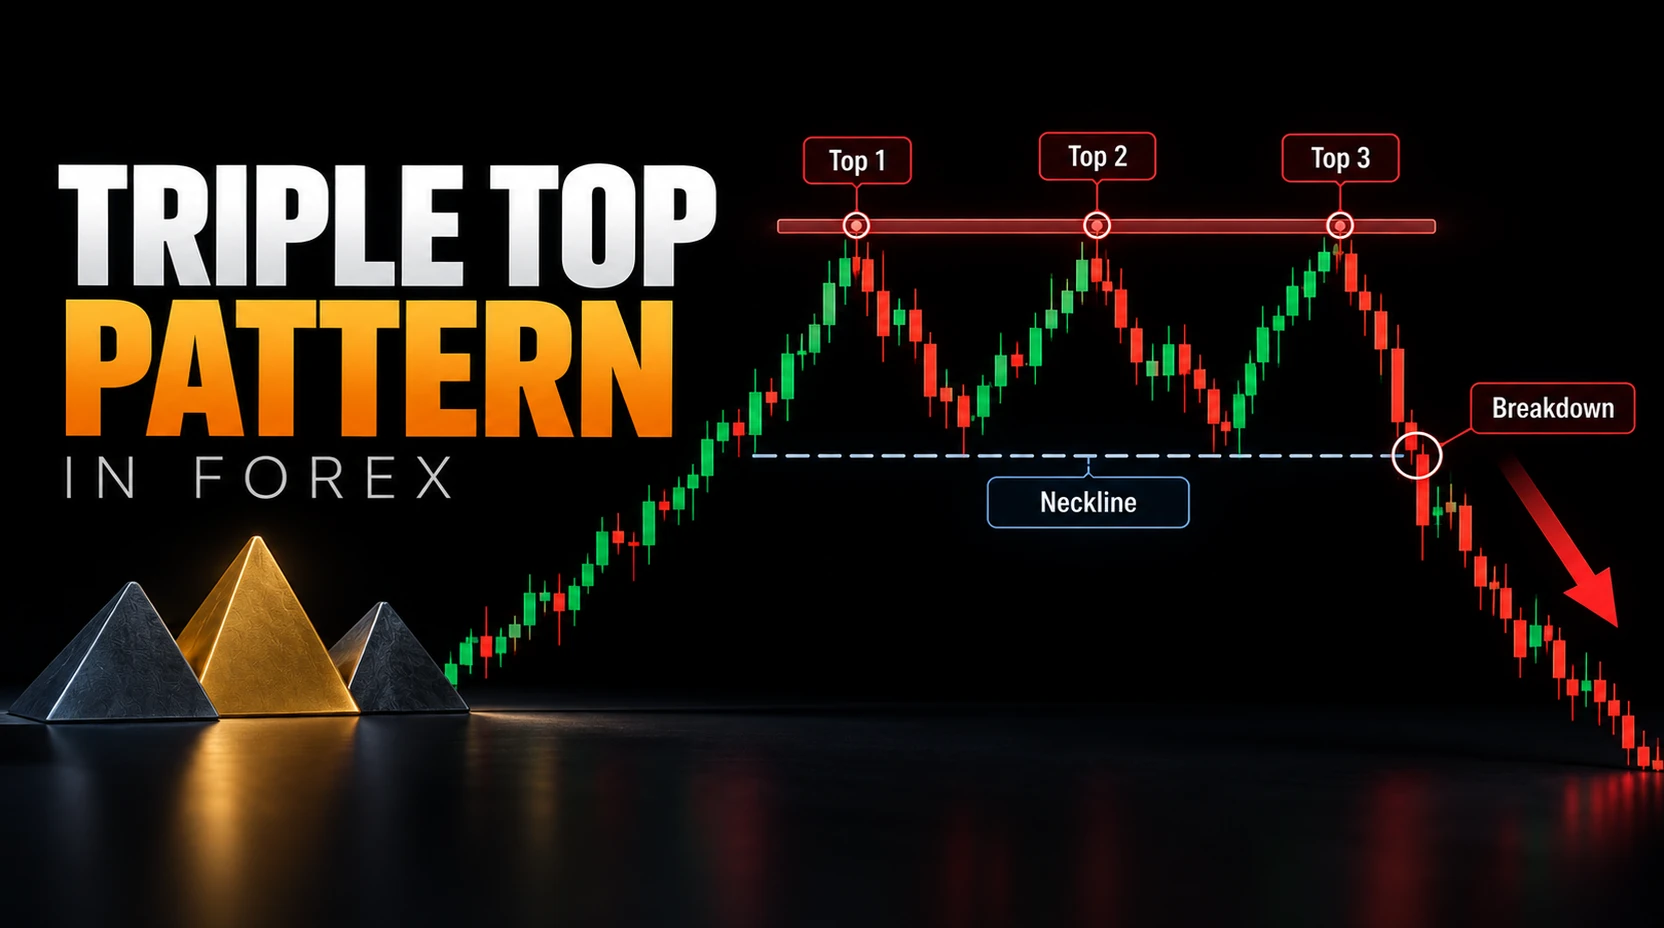
What Is a Triple Top Pattern in Forex?
A triple top is a potential bearish reversal pattern that develops after an upward move and three distinct attempts to break a similar resistance area. The failed tests suggest that buyers have struggled to sustain further gains, but the formation remains a candidate until the support area beneath the peaks breaks.
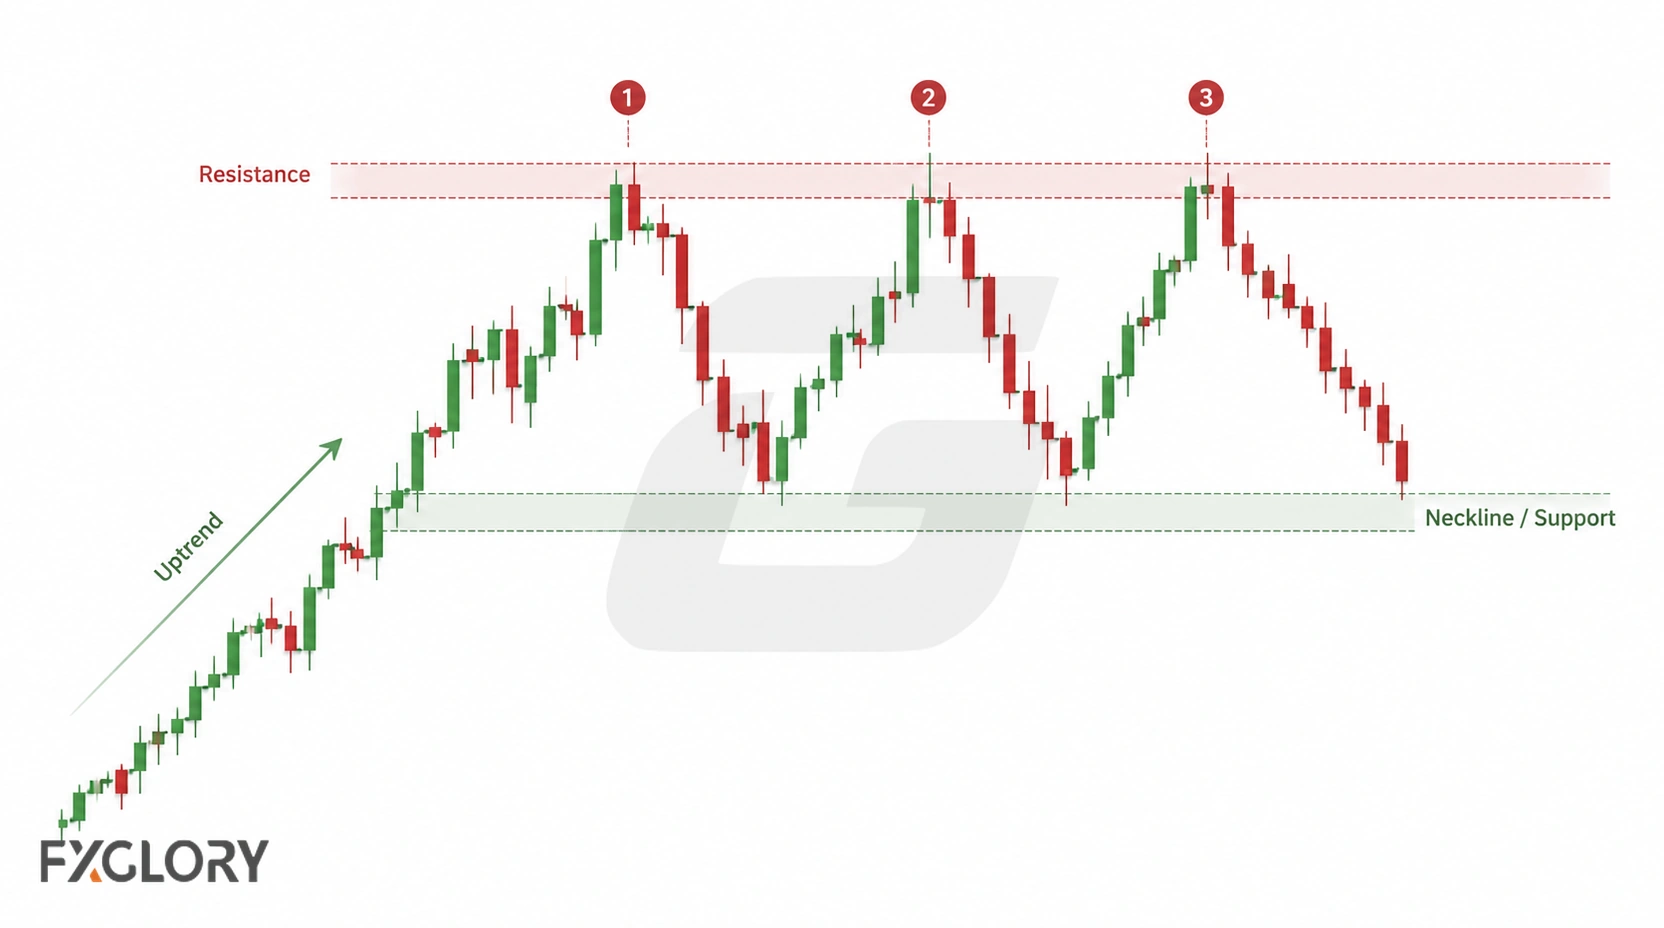
The pullback lows between the peaks establish the neckline. To see how triple tops fit among broader reversal structures, review forex reversal patterns.
How Triple Top Patterns Form
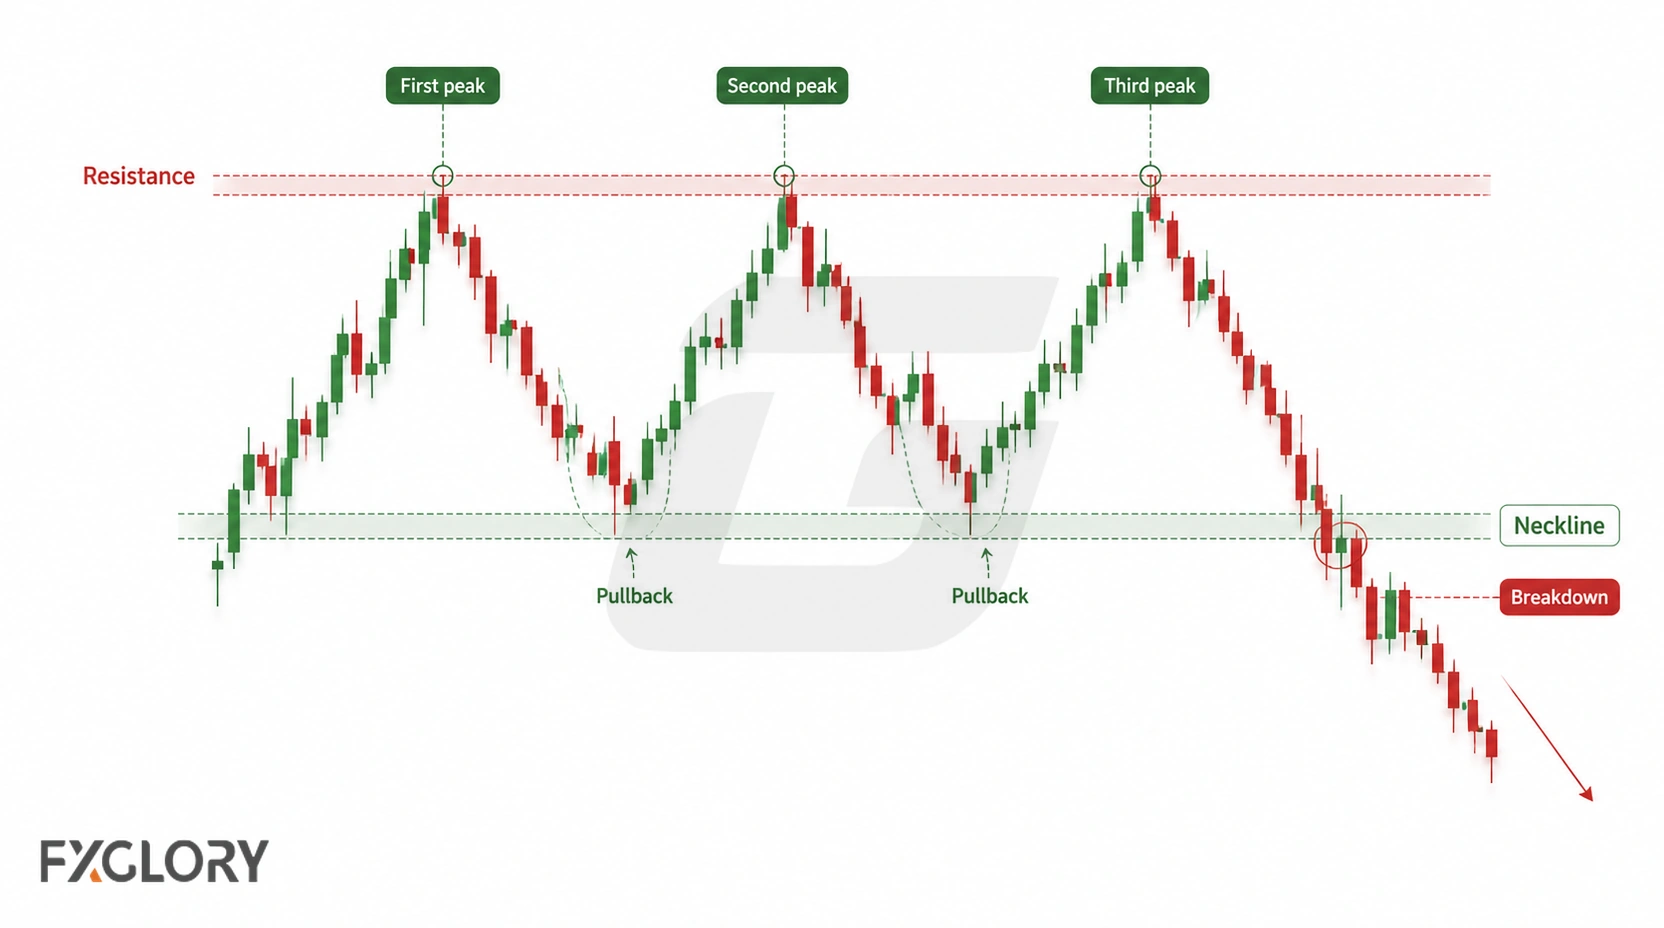
Price advances, makes a first high, retreats, revisits resistance twice, and creates two intervening troughs. Once the third resistance attempt fails, the troughs provide a potential downside break level.
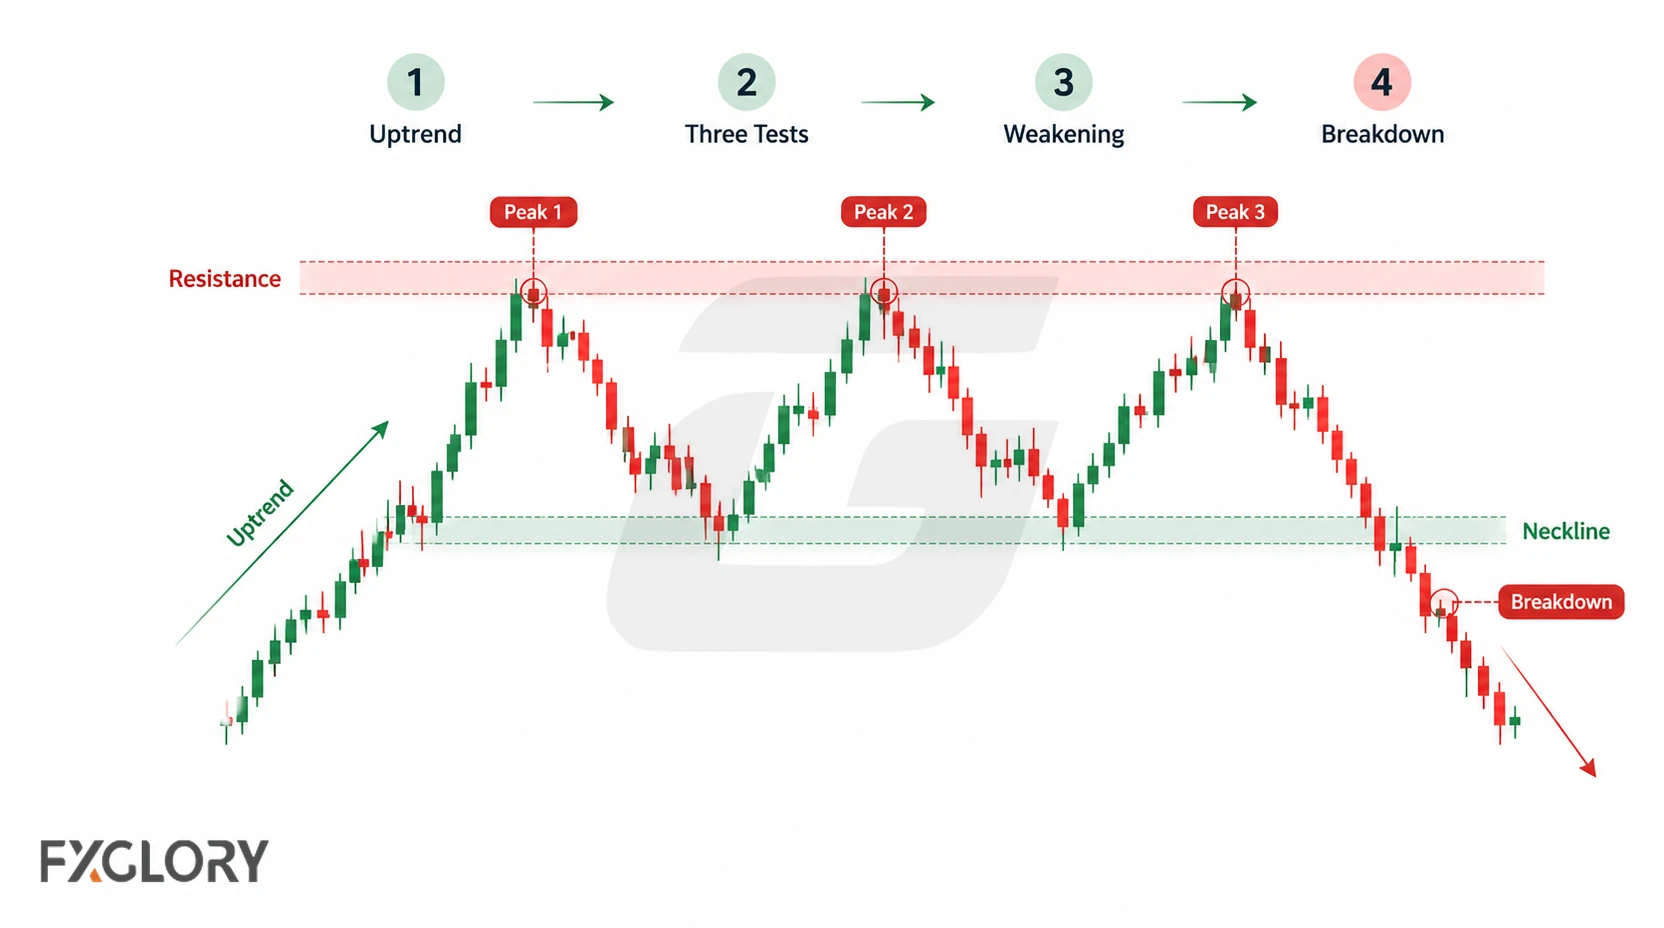
Identify three separate swings rather than selecting neighboring candle wicks simply to complete the shape. A market that continues oscillating within the boundaries has not yet produced the neckline breakdown.
Triple Top Pattern Anatomy
| Component | What to mark | Purpose |
|---|---|---|
| Prior advance | Upward move before the three tests | Provides potential reversal context |
| Resistance area | Zone containing three separate highs | Shows repeated unsuccessful attempts to advance |
| Intervening troughs | Two pullback lows | Define neckline support |
| Breakdown level | Lower boundary of the marked support zone, or chosen neckline line | Provides a consistent confirmation rule |
Candidate vs Confirmed Triple Top
Three visible resistance tests establish a candidate, not a confirmed reversal. Under the neckline-break method, confirmation occurs when price breaks the predefined neckline/support boundary. Some traders require a candle close beneath it to filter intrabar moves; the chosen rule should be specified in advance.
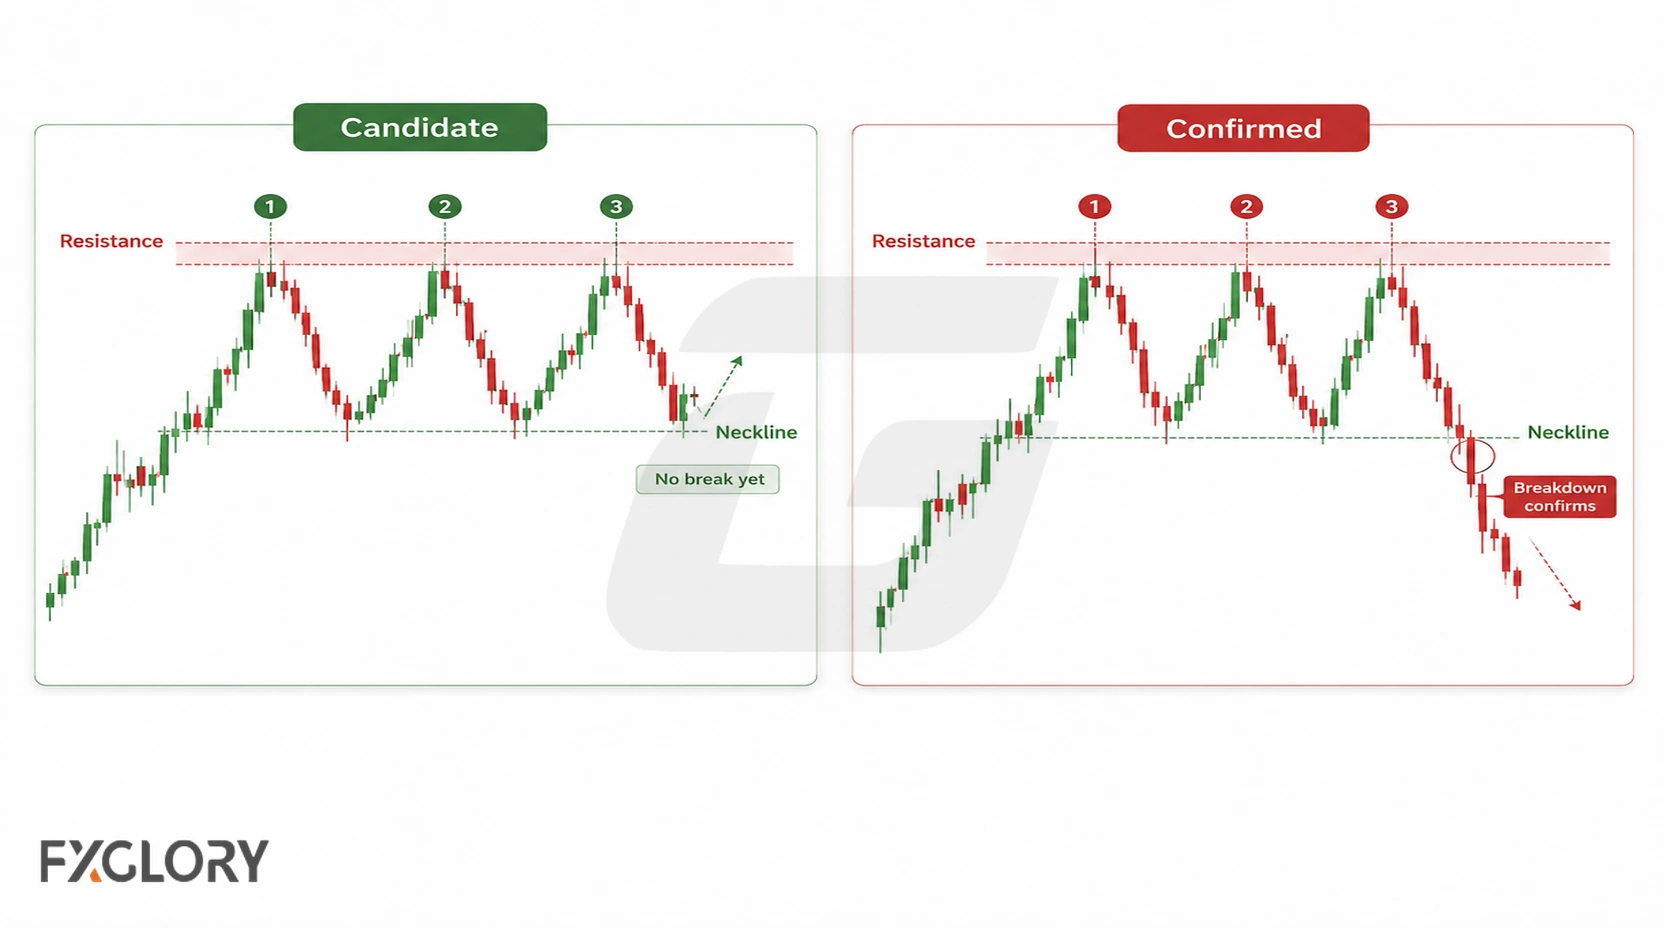
A subsequent hold below the broken area, continued downside movement, or a retest that fails to reclaim support supplies additional evidence after the break. A retest is not a substitute for the initial breakdown. If support continues holding, the candidate remains unconfirmed.
How to Draw and Read the Neckline
Mark the reaction lows between the peaks. When they are uneven, a narrow support zone may describe the structure better than a single precise line; decide which boundary defines a break before monitoring confirmation. A sloping line may also be appropriate if it connects identifiable troughs without being forced.
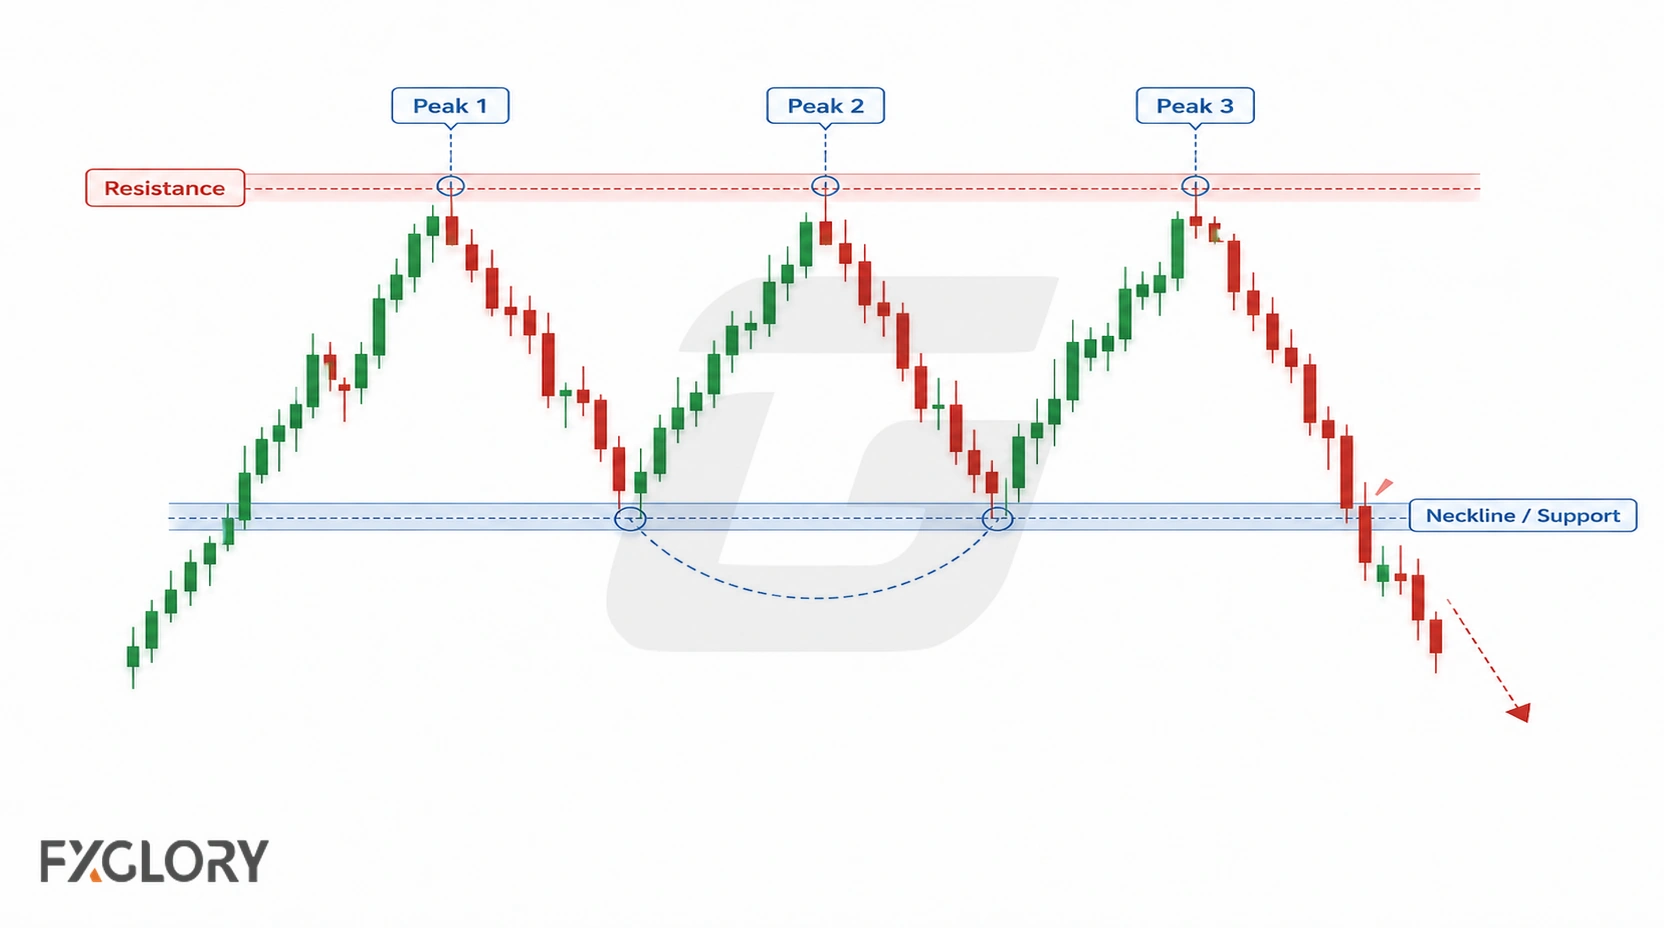
Price dipping briefly through the zone differs from a sustained break. If price later retests from below and fails to regain support, the breakdown has survived that test. If it moves back above the zone and holds, the bearish breakdown thesis may be weakened or invalidated under the selected rules. Spread and volatility can affect the appearance and execution of apparent breaks.
How Similar and Far Apart Should the Three Peaks Be?
The highs need not be identical. They should represent three reasonably distinct reactions at one recognizable resistance area. Crowded wicks in a few candles may reflect noise rather than separate attempts; widely separated highs can belong to a long trading range.
If the middle high rises clearly above both outer highs, compare the shape with head and shoulders before applying a triple-top label. Avoid repeatedly shifting the resistance level to fit unrelated highs.
Triple Top vs Similar Forex Chart Patterns
| Structure | Key distinction | Further reading |
|---|---|---|
| Double top | Two upper tests instead of three | Double top pattern |
| Head and shoulders | Typically has a higher middle peak (head) | Head and shoulders |
| Rectangle | Ongoing rotation between horizontal boundaries without a reversal breakdown | Rectangle pattern |
| Ascending triangle | Rising swing lows press against relatively flat resistance | Forex triangle patterns |
| Triple bottom | Bullish counterpart built around three support tests after a decline | See the related chart-pattern guides |
The shape beneath resistance can help distinguish a potential reversal from a continuing consolidation. Classify the structure from its actual swings rather than from the number of visible high points alone.
Clean vs Forced Triple Top Patterns
A readable setup has a preceding rise, distinct upper tests within one resistance area and identifiable pullback support. A forced example relies on arbitrary wicks, inconsistent levels or troughs that cannot define a usable neckline.
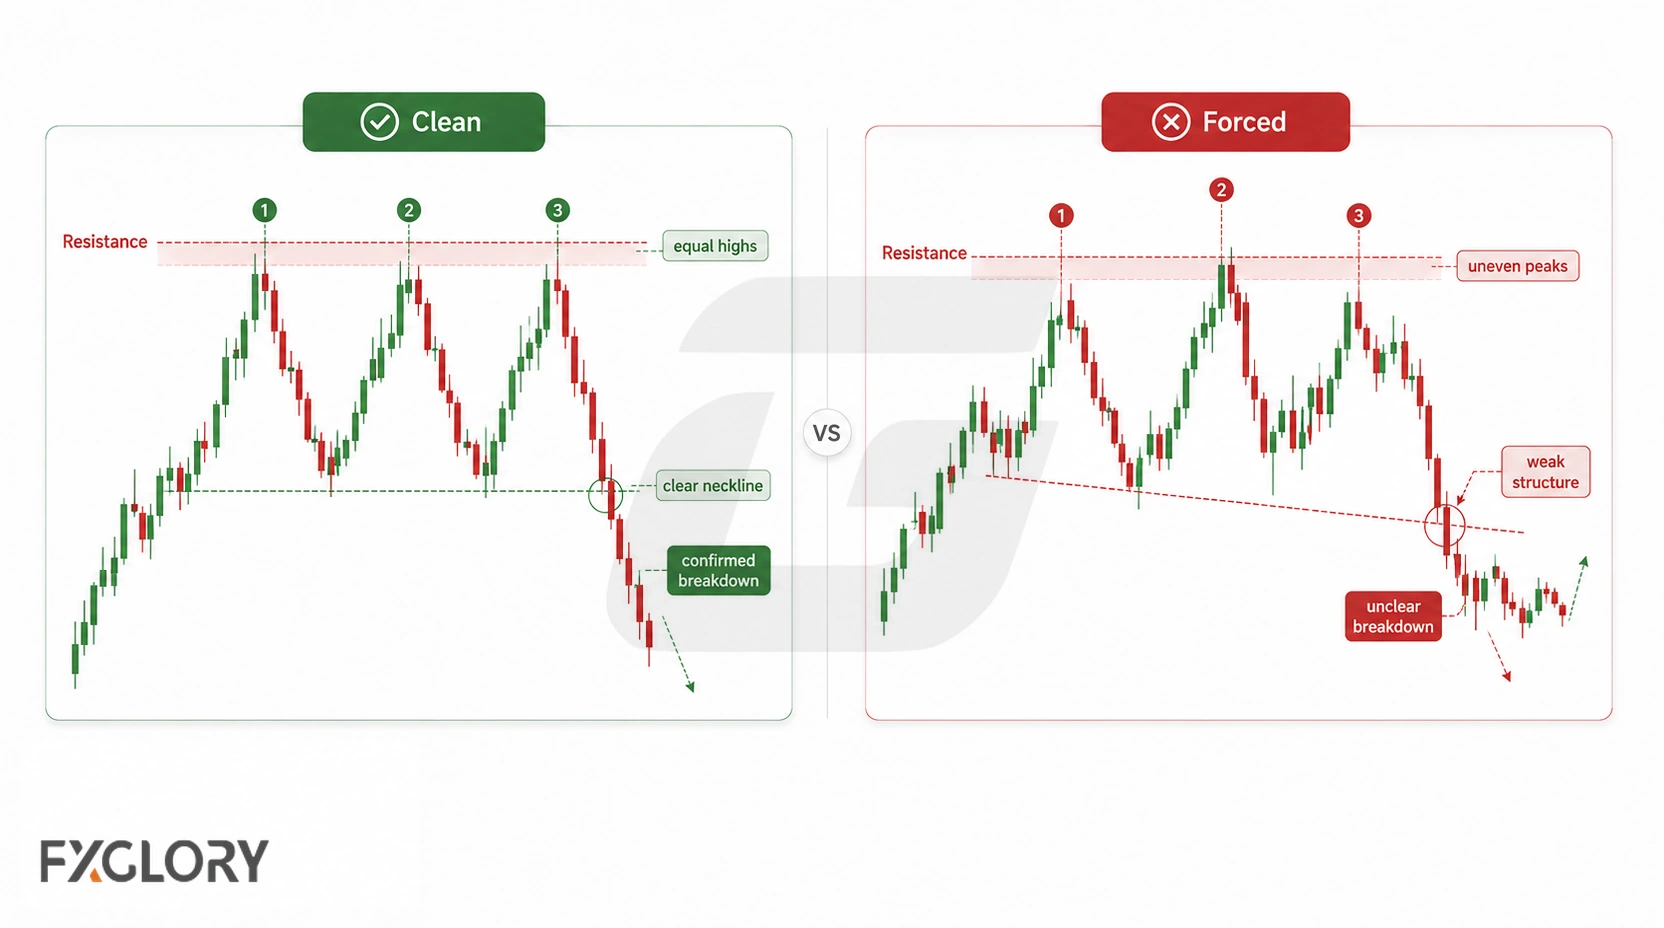
Practical test: Could another chart reader mark approximately the same resistance and support areas without being told which pattern to find? If not, treat the interpretation as uncertain rather than assuming that a neat label means a reliable reversal.
How to Assess a Triple Top Breakdown
Use a consistent sequence to evaluate the candidate and what happens after support is lost.
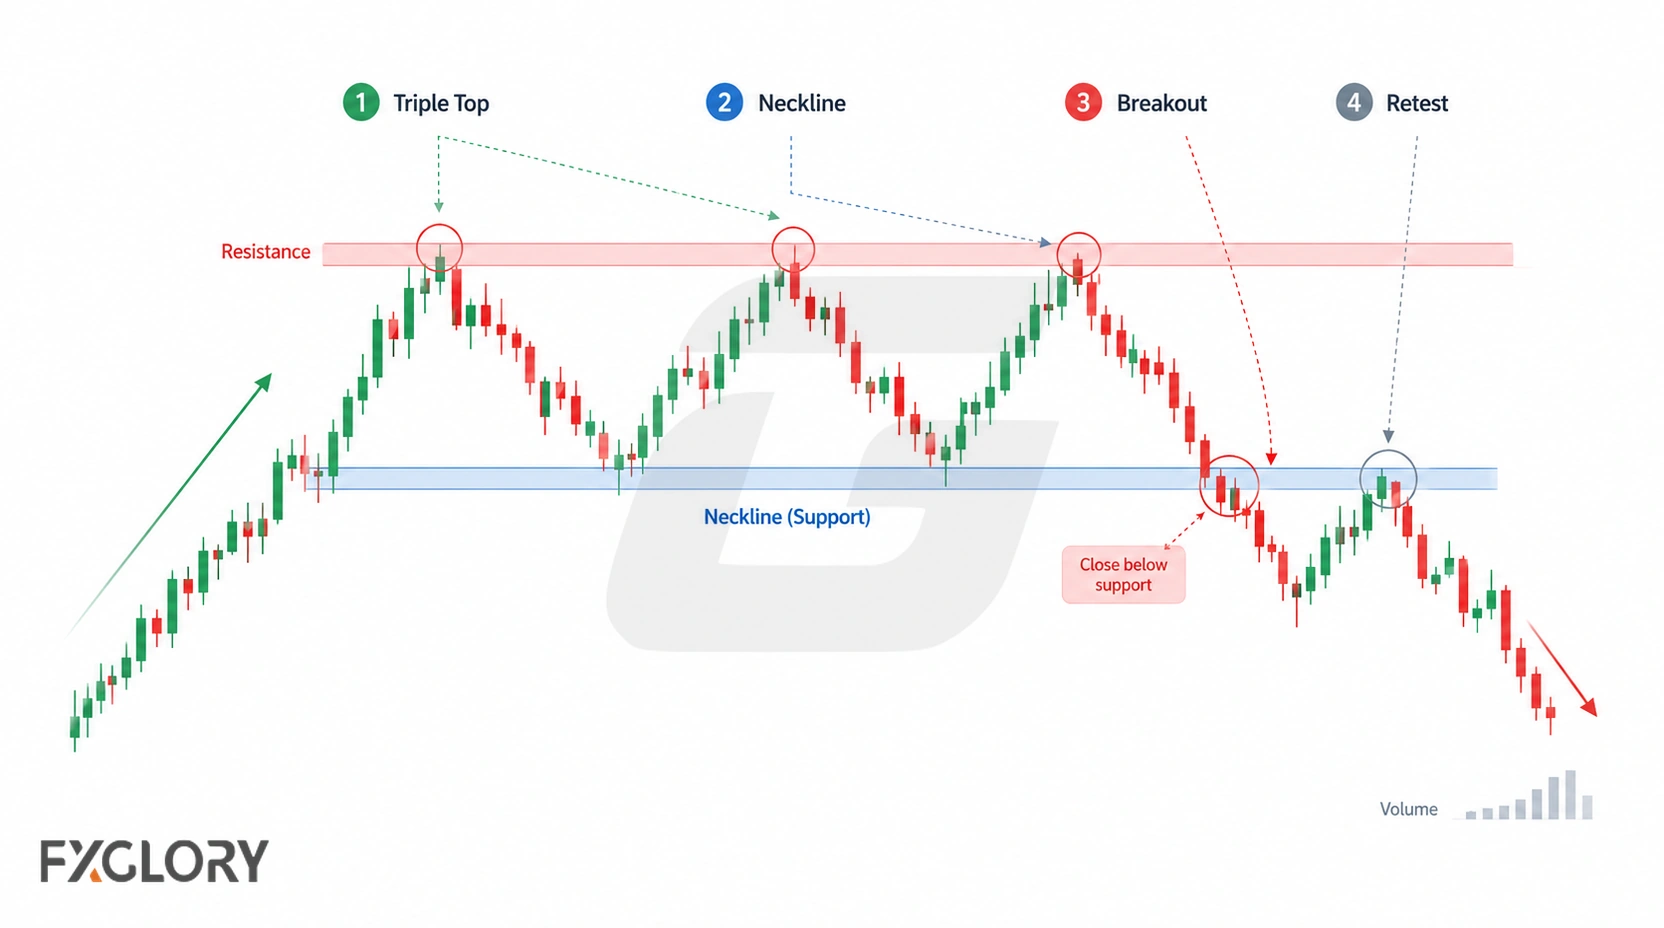
- Mark the context: Identify the preceding advance, three resistance tests and intervening troughs.
- Define the trigger: Specify the neckline boundary and whether a close below it is required.
- Check the break: See whether price actually crosses the defined level; a third peak alone does not meet this rule.
- Assess what follows: Look for movement or a hold below support. If price retests the broken area, distinguish rejection from a sustained reclaim.
- Record the opposing case: Identify price behavior that would negate the bearish interpretation, and consider trading costs before making any decision.
A break establishes a technical confirmation under the selected rule, not certainty about the next move. A closing-price filter may exclude some false intrabar breaks but can also delay recognition.
Unconfirmed, Failed, and Invalidated Setups
| Price behavior | Interpretation |
|---|---|
| Support holds after the third peak | Unconfirmed: the candidate may continue ranging; lack of a break is not itself invalidation |
| Price breaks neckline then returns above and holds | Failed breakdown: the confirmation thesis is undermined |
| Price breaks and sustains above the three-peak resistance zone | Bearish pattern invalidated under a resistance-break rule |
| Levels or peaks cannot be drawn consistently | Poor-quality identification: avoid claiming an identifiable setup |
These are analytical labels, not universal stop-order locations. A trading stop depends on the method’s invalidation logic, while position size also depends on stop distance, instrument value and a predetermined risk limit. Higher-timeframe support or news risks may affect suitability without mechanically invalidating the pattern.
Recognizing False Breakdowns
One important failure mode is a downside move through neckline support followed by a return inside the previous range. An intrabar dip may never satisfy a candle-close confirmation rule; even a close below can subsequently fail. Watch whether the reclaimed area holds rather than assuming one tick across a line is decisive.
During abrupt moves, wider spreads or slippage can produce fills unlike the charted level. Distinguish the technical pattern outcome from the actual execution of any position.
Triple Top Scanner and Automation Caution
Scanners can flag approximate triple-top shapes, but their tolerance for uneven highs, swing spacing and neckline selection varies. Some may recognize incomplete candidates or redraw levels as new data arrives. Check the original chart and the scanner’s criteria before interpreting a detected pattern as confirmed.
Triple Top Measured-Move Example
A traditional projection subtracts the vertical height between resistance and neckline from the neckline level. For a hypothetical EUR/USD structure, resistance at 1.1050 and neckline at 1.1000 imply a 50-pip height. Subtracting 0.0050 from 1.1000 gives an illustrative projection of 1.0950.
This is a geometric reference, not an observed market result or a forecast. If the neckline slopes or is a zone, the measurement needs a consistent chosen reference; price can reverse or stall long before any projected level.
Forex Context: Sessions, News and Trading Costs
Currency pairs can react differently around session changes, thin liquidity and major economic releases. A breakout visible on one chart may face wider spreads, slippage or conflicting higher-timeframe support. Pair-specific volatility and the chosen chart timeframe affect how meaningful a resistance test or close below support appears.
Plan risk from the defined trade scenario rather than assuming that greater volatility automatically dictates a wider stop. Position size, if a trade is considered, follows the selected stop distance, pip value and account-risk limit.
Volume and Tick Activity in Spot Forex
Spot forex has no single centralized, exchange-wide traded-volume figure. A broker’s tick activity counts price updates in its feed; it is not the same as total market transaction volume. Tick changes around resistance or a breakdown can be contextual clues, but their interpretation depends on the data source. See the forex tick-volume indicator guide for details.
Indicators and Candles: Supporting Evidence
Momentum readings can show slowing price momentum near the peaks; volatility tools describe movement size; and candles can show rejection or closing behavior around the marked levels. None replaces an explicitly defined neckline-break rule. For more detail, consult the ATR volatility guide, candlestick guide and technical indicators overview.
Example: Three Possible EUR/USD Outcomes
Consider a hypothetical EUR/USD chart with three distinct highs near 1.1050 and two troughs near 1.1000 after an upward move. The structure is a candidate while the 1.1000 support area holds.
| Next event | How to describe it |
|---|---|
| A candle closes below the predefined 1.1000 neckline boundary | Breakdown confirmed under a close-based rule; subsequent follow-through remains uncertain |
| Price breaks below, then closes back above support and holds | Potential failed breakdown, especially if a short position relied on that break |
| Price instead breaks and sustains above the 1.1050 resistance area | Bearish triple-top idea invalidated under the stated resistance rule |
The numbers are for illustration only, not historical EUR/USD prices, an entry recommendation or a live-market signal.
Common Triple Top Reading Mistakes
- Changing the rules after seeing the outcome: Repositioning the neckline or switching between wick and closing-price rules makes the interpretation impossible to evaluate consistently.
- Confusing confirmation with execution: A chart breakdown does not ensure a stop or market order fills at the marked level.
- Using a measured move as certainty: The projected height is not evidence of a successful trade or a guaranteed target.
- Ignoring the competing interpretation: If support continues holding, the chart may remain a range rather than developing the expected reversal.
Triple Top Pattern: Practical Takeaway
Read a triple top in stages: resistance tests define the candidate; the chosen neckline-break rule defines confirmation; later price action tests whether that breakdown survives. Keep the levels and rules consistent, and treat any measured move as a scenario rather than a promise.