
What Is a Flag Pattern in Forex?
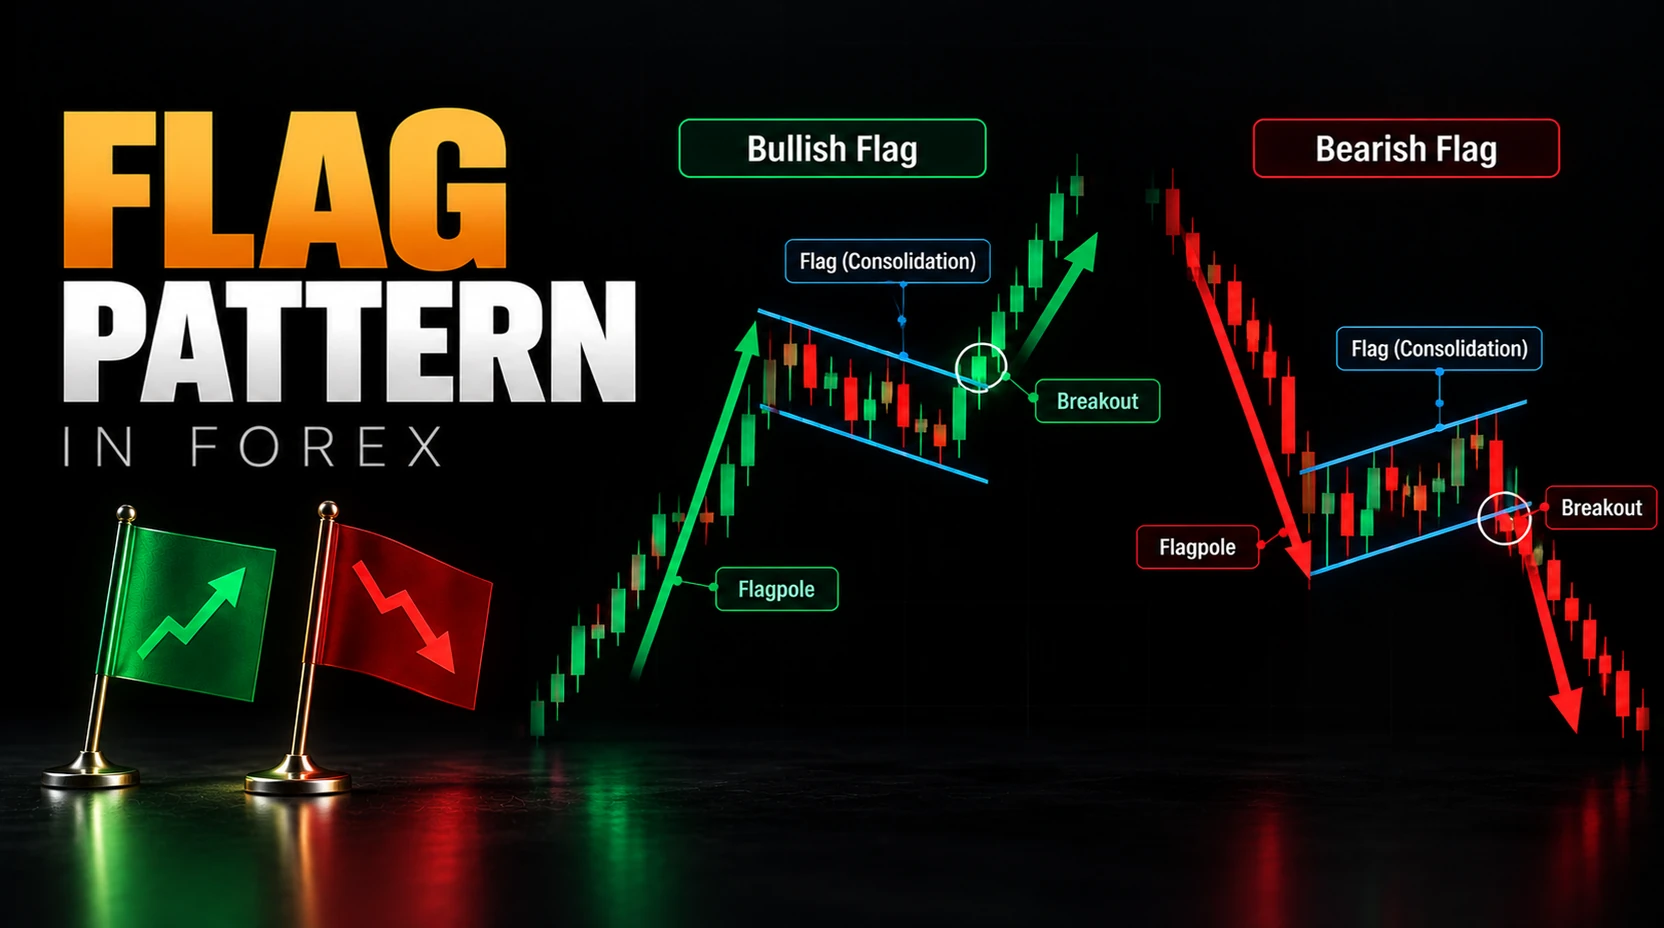
A flag pattern in forex is a chart structure that may form after a sharp directional move. The strong move is called the flagpole. The smaller pause that follows is called the flag.
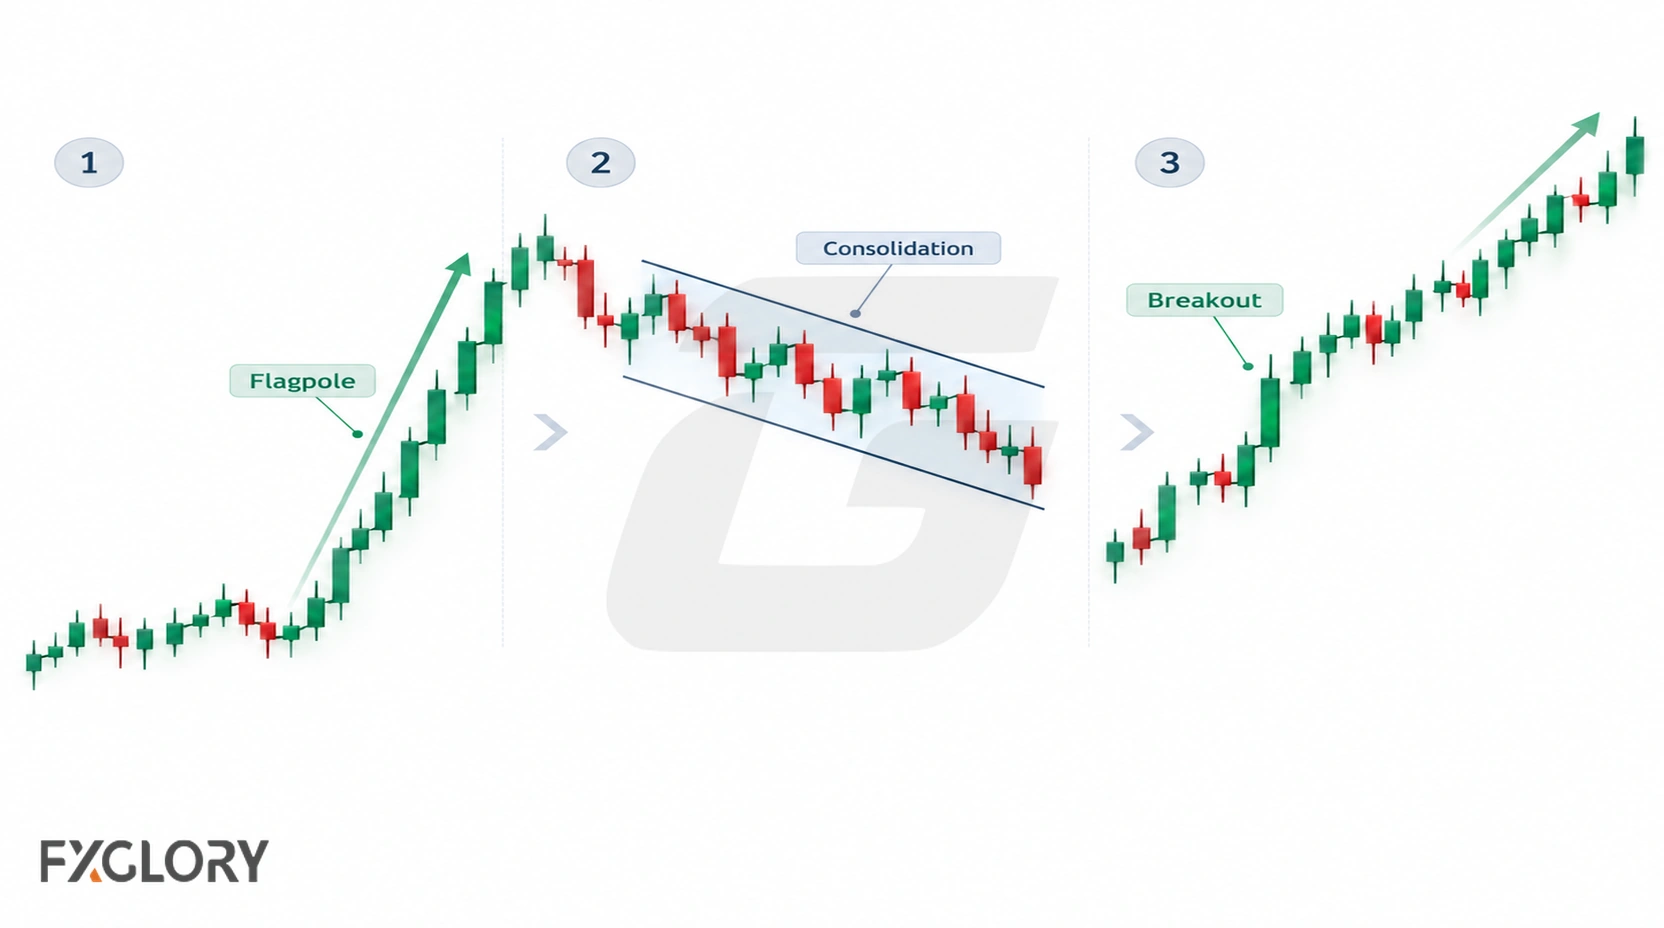
The flag usually appears as a short parallel or channel-like consolidation. In a bullish flag, the pause often slopes slightly downward or moves sideways after an upward move. In a bearish flag, the pause often slopes slightly upward or moves sideways after a downward move.
Flags are usually studied as possible continuation patterns. This means the pattern may describe a market pausing before another attempt in the original direction. It does not mean continuation is guaranteed. For the broader category, review trend-pause pattern context.
How Forex Flag Patterns Form
A flag pattern starts with momentum. Price moves sharply in one direction, creating the flagpole. After that move, price pauses as traders reassess the move, take profit, wait for more liquidity, or react around short-term support and resistance.
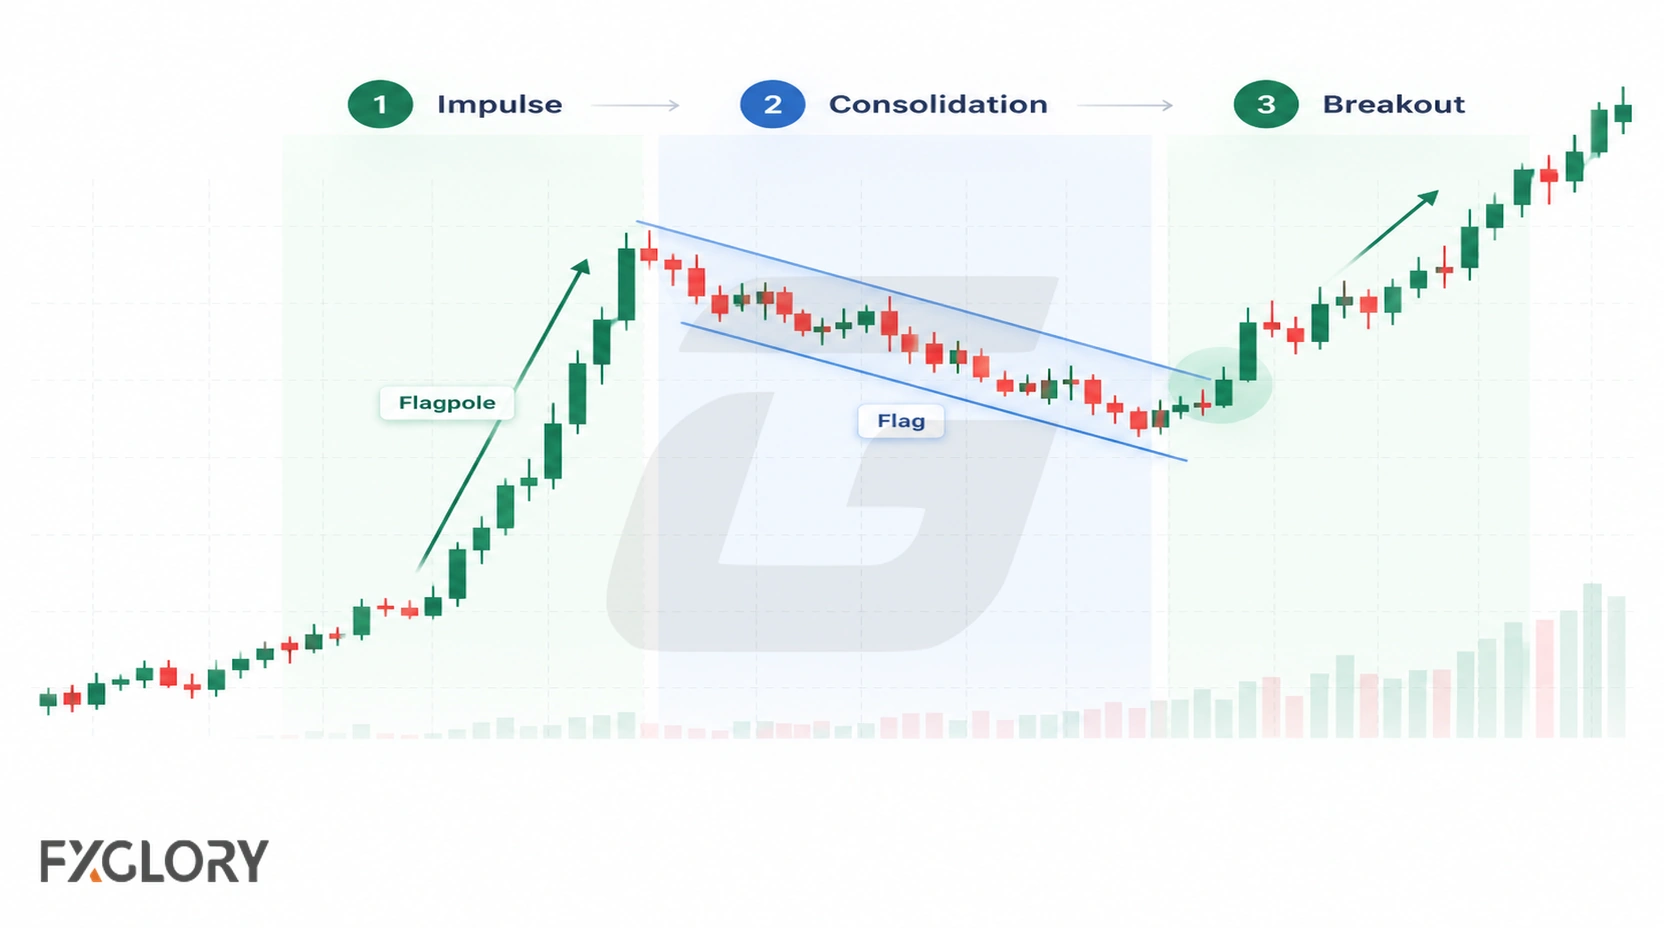
The pause should be smaller than the flagpole and should not erase too much of the original move. If the pause becomes too deep, too wide, or too long, the structure may stop behaving like a flag and become a range, channel, rectangle, or reversal attempt.
- Impulse first: A clear sharp move creates the flagpole.
- Controlled pause: Price consolidates instead of fully reversing the move.
- Parallel boundaries: The flag often forms between two relatively parallel lines.
- Breakout test: Price tests whether it can leave the flag in the direction of the prior move.
- Retest or hold: Price may return to the broken boundary or hold outside the flag.
- Failure risk: Price can break against the expected direction or return inside the flag after a breakout.
A flag pattern is easier to identify when the flagpole and consolidation boundaries are clear without forcing the chart. The breakout decision and any trade-risk plan come afterward.
Flag Pattern Anatomy
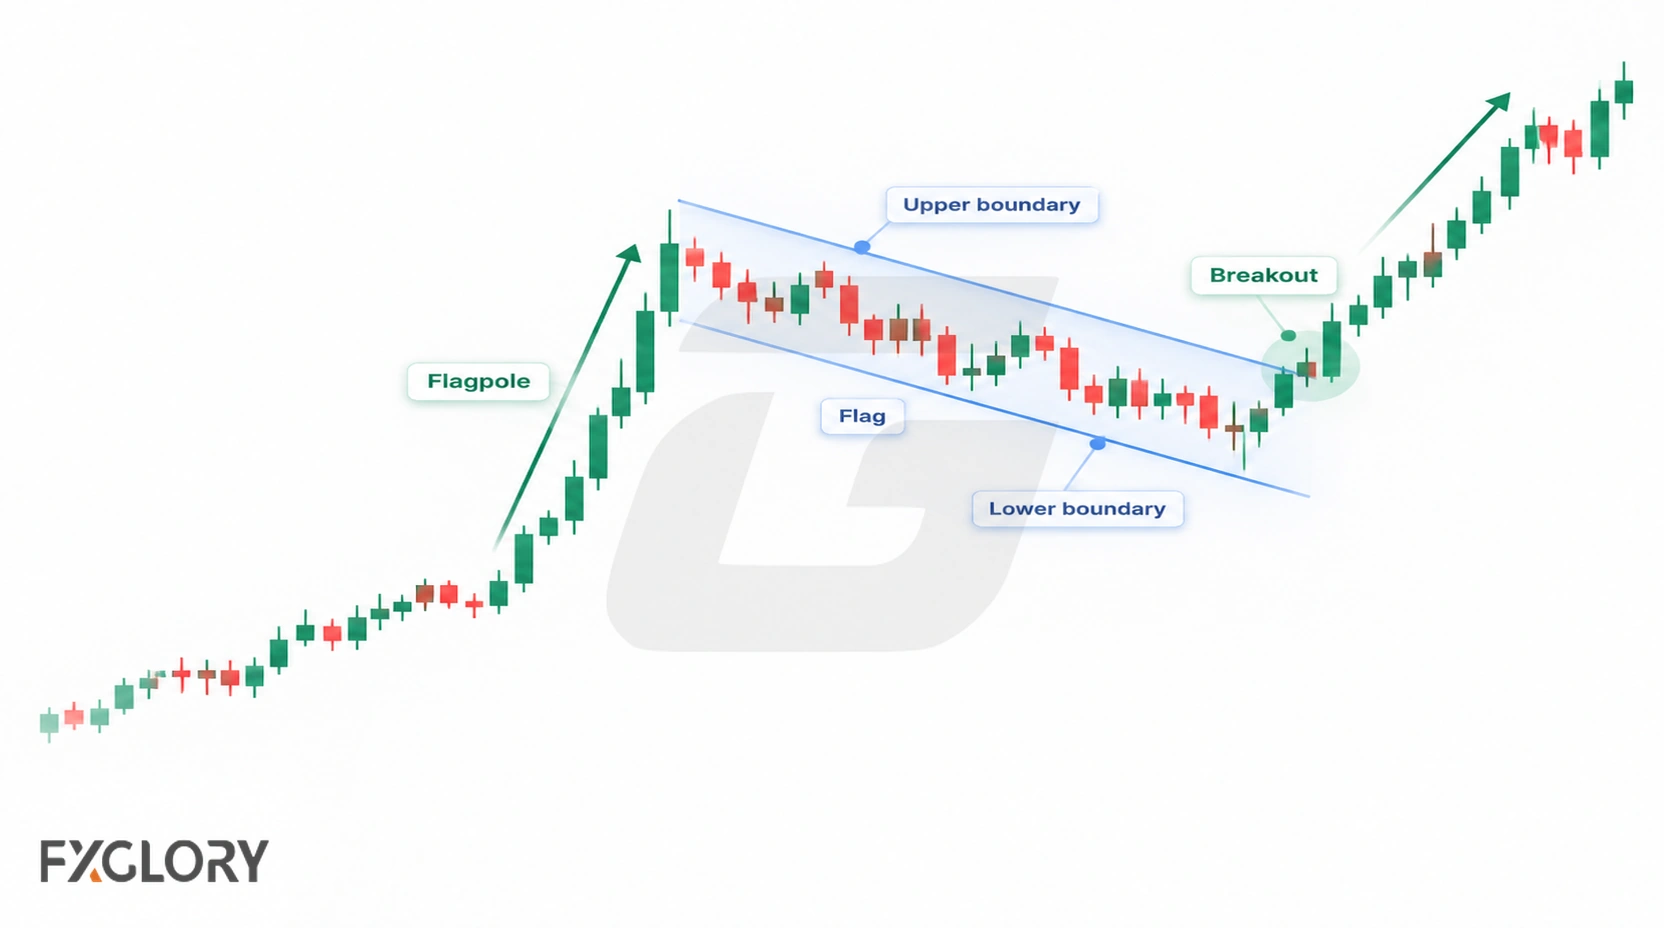
A forex flag pattern has three main parts: the flagpole, the flag channel, and the breakout decision area.
| Part | What It Means | Why It Matters |
|---|---|---|
| Flagpole | The sharp move before the pause | Without a clear flagpole, the structure may not be a flag |
| Flag channel | The smaller consolidation after the impulse | Shows whether price is pausing in a controlled way |
| Upper boundary | The top side of the flag channel | Often important for bullish breakout attempts or bearish invalidation |
| Lower boundary | The bottom side of the flag channel | Often important for bearish breakout attempts or bullish invalidation |
| Breakout area | The boundary price tries to leave | Shows whether the flag scenario develops or fails |
| Retest area | The broken boundary may be tested again | A retest can support or weaken the breakout scenario |
| Scenario invalidation | Price behavior that contradicts a proposed continuation or breakout scenario | Helps assess the trade idea; it is not required to recognize the flag structure |
Bullish Flag Pattern Forex
A bullish flag pattern may form after a sharp upward move. Price then pauses inside a small downward or sideways channel-like structure. Traders watch whether price can break above the upper boundary and hold outside the flag.
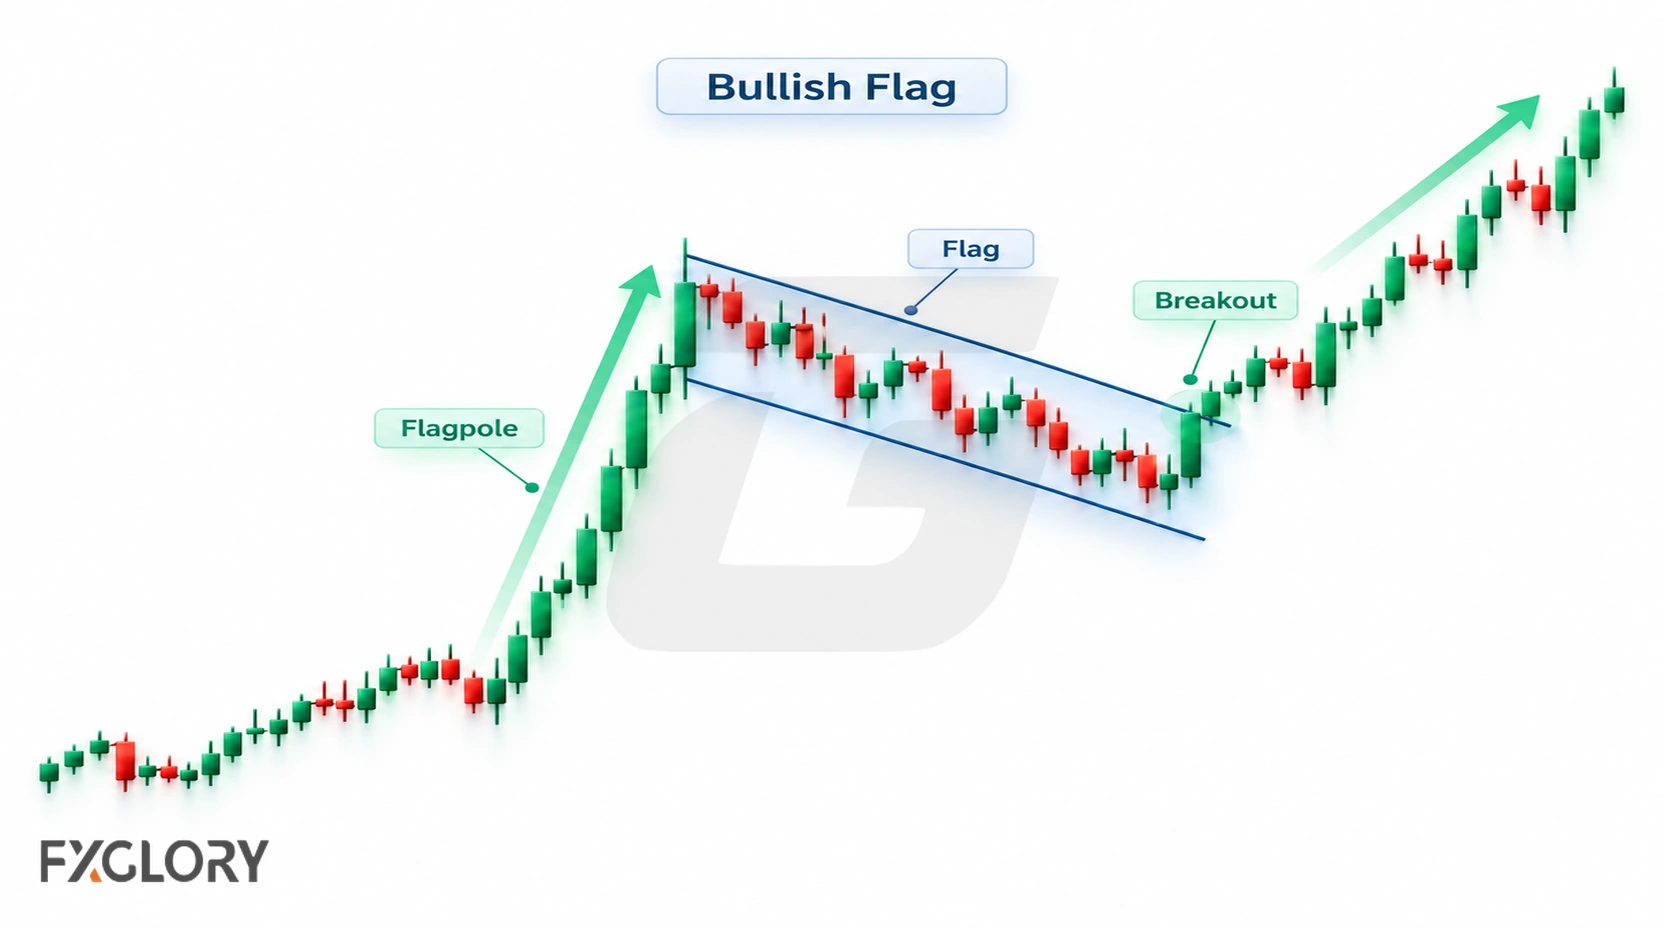
The bullish continuation scenario weakens if price breaks below the flag structure, retraces too deeply into the flagpole, or loses a predefined breakout holding condition. A bullish flag is not confirmed by the upward flagpole alone; the pause and boundary behavior matter.
| Bullish Flag Part | Useful Reading | Careful Use |
|---|---|---|
| Prior move | Price rises sharply before the flag | The upward impulse should be distinct from the subsequent pause |
| Flag direction | The pause slopes down slightly or moves sideways | A very deep pullback can weaken the continuation idea |
| Upper boundary | Price tests whether it can leave the flag upward | A brief spike can still become a false breakout |
| Retest behavior | Price may return to the broken boundary | The retest can fail and move back inside the flag |
| Invalidation | An opposite-side break or loss of breakout support can weaken the bullish scenario | Define a trade exit separately from identifying the flag |
Bearish Flag Pattern Forex
A bearish flag pattern may form after a sharp downward move. Price then pauses inside a small upward or sideways channel-like structure. Traders watch whether price can break below the lower boundary and hold outside the flag.
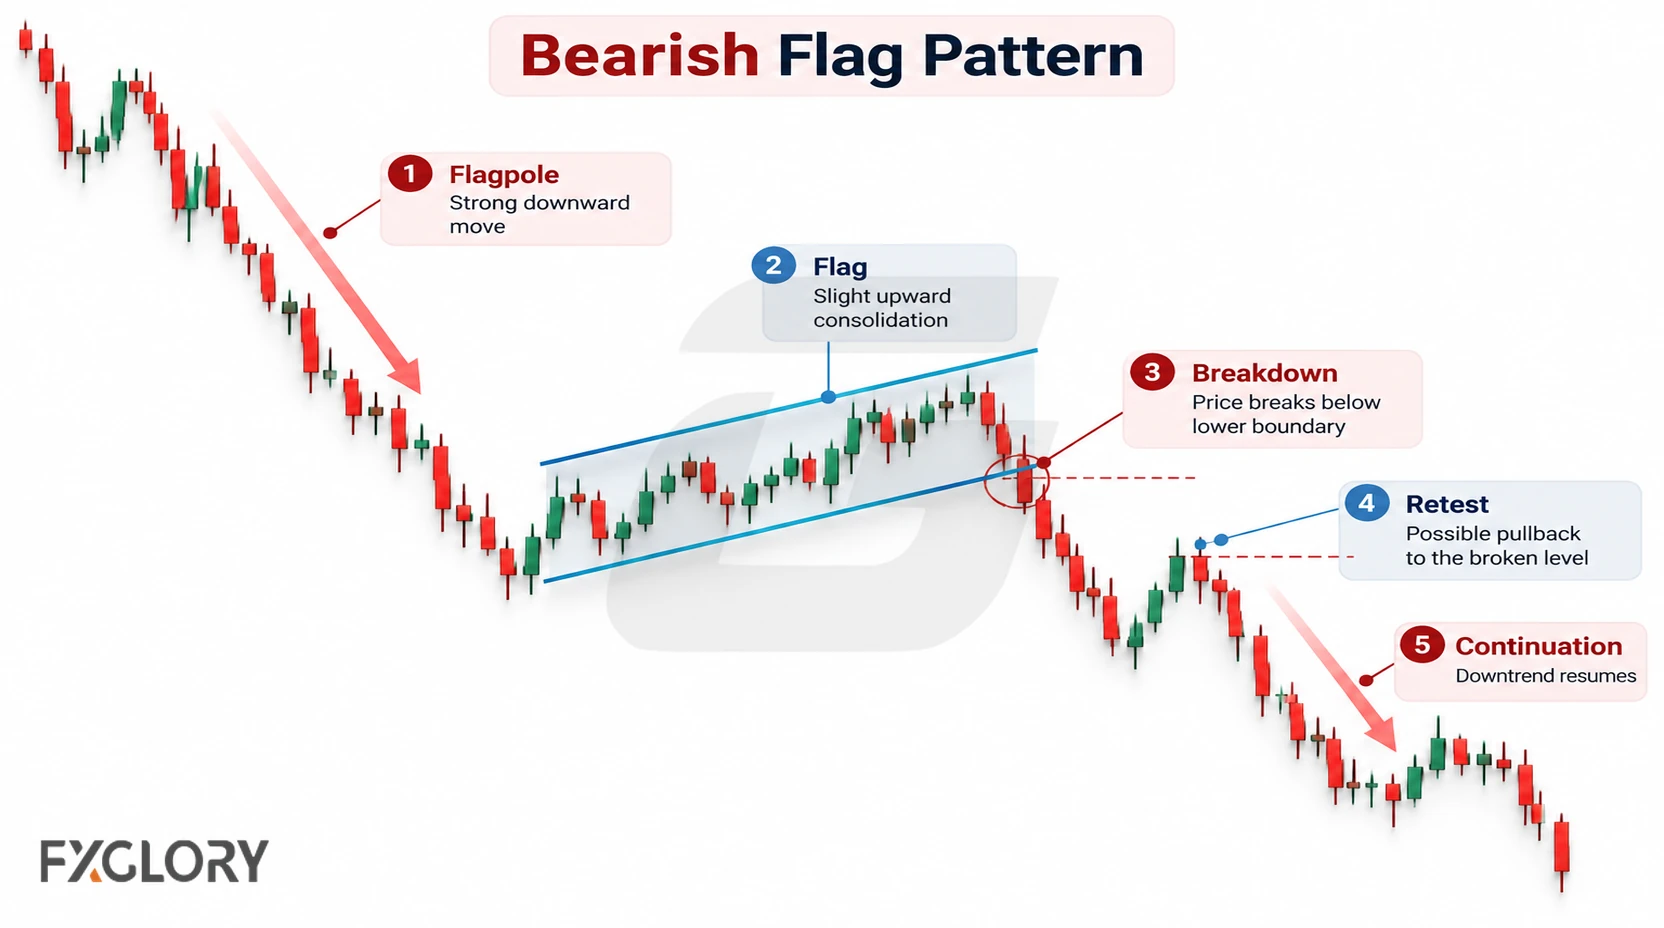
The bearish continuation scenario weakens if price breaks above the flag structure, retraces too deeply into the flagpole, or loses a predefined breakdown holding condition. A bearish flag is not confirmed by the downward flagpole alone; the consolidation and boundary behavior matter.
| Bearish Flag Part | Useful Reading | Careful Use |
|---|---|---|
| Prior move | Price falls sharply before the flag | The downward impulse should stand out from the subsequent recovery |
| Flag direction | The pause slopes up slightly or moves sideways | A very deep recovery can weaken the continuation idea |
| Lower boundary | Price tests whether it can leave the flag downward | A brief break can still become a false breakdown |
| Retest behavior | Price may return to the broken boundary | The retest can fail and move back inside the flag |
| Invalidation | An opposite-side break or loss of breakout support can weaken the bearish scenario | Define a trade exit separately from identifying the flag |
Bull Flag vs Bear Flag
Bullish and bearish flags are mirror structures. The pattern logic is similar, but the prior move and breakout direction are different.
| Feature | Bullish Flag | Bearish Flag |
|---|---|---|
| Prior move | Sharp upward move | Sharp downward move |
| Flag pause | Small downward or sideways channel | Small upward or sideways channel |
| Continuation test | Break above the upper boundary | Break below the lower boundary |
| Common failure | Price breaks lower or returns inside after an upward break | Price breaks higher or returns inside after a downward break |
| Careful reading | Possible bullish continuation only after confirmation | Possible bearish continuation only after confirmation |
Because the two versions share the same structure, the main reading difference is the direction of the flagpole and the boundary price tests after the pause.
Flag Pattern Map
Use the quick map below to separate a real flag candidate from an ordinary channel or range.
| Stage | Visual Cue | What It Means | Risk Check |
|---|---|---|---|
| 1. Flagpole | Price moves sharply in one direction | The market creates the impulse that makes a flag possible | If there is no impulse, it may not be a flag |
| 2. Controlled pause | Price consolidates in a smaller structure | The move pauses rather than fully reversing | If the pause is too deep, the flag weakens |
| 3. Parallel channel | The flag has two relatively parallel boundaries | The structure is closer to a flag than a pennant or wedge | If boundaries converge, another pattern may fit better |
| 4. Breakout test | Price leaves one side of the flag | The continuation scenario is being tested | A brief break can still fail |
| 5. Retest or hold | Price reacts outside the flag or returns to the boundary | The broken area may still matter | A sustained return inside can undermine a confirmed breakout; a brief retest may not |
Flag vs Pennant, Wedge, and Rectangle
Flags are often confused with pennants, wedges, and rectangles because all of them can describe a pause after movement. The boundary shape is the main difference.
| Structure | Main Boundary Shape | Typical Context | Careful Reading |
|---|---|---|---|
| Flag | Relatively parallel channel | After a sharp move | Flagpole and controlled pause identify the structure; a continuation breakout is separate |
| Pennant | Small converging triangle | After a sharp move | Compression is tighter and more triangular than a flag |
| Wedge | Converging sloped boundaries | Continuation or reversal context | Direction and context matter more than slope alone |
| Rectangle | Horizontal range-like boundaries | Pause, consolidation, or range | Without a sharp flagpole, it may be a range rather than a flag |
When the pause narrows into compact converging compression, compact pennant compression may be the closer structure. When the pause narrows between angled lines, angled wedge compression may fit better. When the structure is broader triangle-style compression, triangle compression in forex may be more useful.
Flag Pattern vs Ordinary Channel
A flag pattern and an ordinary channel can look similar because both may have parallel boundaries. The difference is what came before the channel and how the pause behaves compared with that prior move.
| Question | Flag Pattern Clue | Ordinary Channel Clue |
|---|---|---|
| What came before? | A sharp flagpole appears before the pause | Price is already moving between channel boundaries without a fresh impulse |
| How large is the pause? | The flag is smaller than the flagpole | The channel is the main structure, not a short pause |
| What is the main idea? | Possible continuation after controlled consolidation | Repeated movement between channel boundaries |
| What weakens the reading? | Deep retracement, long pause, false breakout, or opposite-side break | Boundary breaks or trend-channel behavior changing |
| Better label when unsure | Identifiable flag candidate even while the breakout remains unconfirmed | Channel or range until a flagpole and controlled pause are obvious |
Strong vs Weak Forex Flag Patterns
A strong flag pattern is not just a small channel on a chart. It has a clear flagpole, controlled consolidation, and visible boundaries. A defined invalidation condition belongs to the subsequent continuation or trade plan.
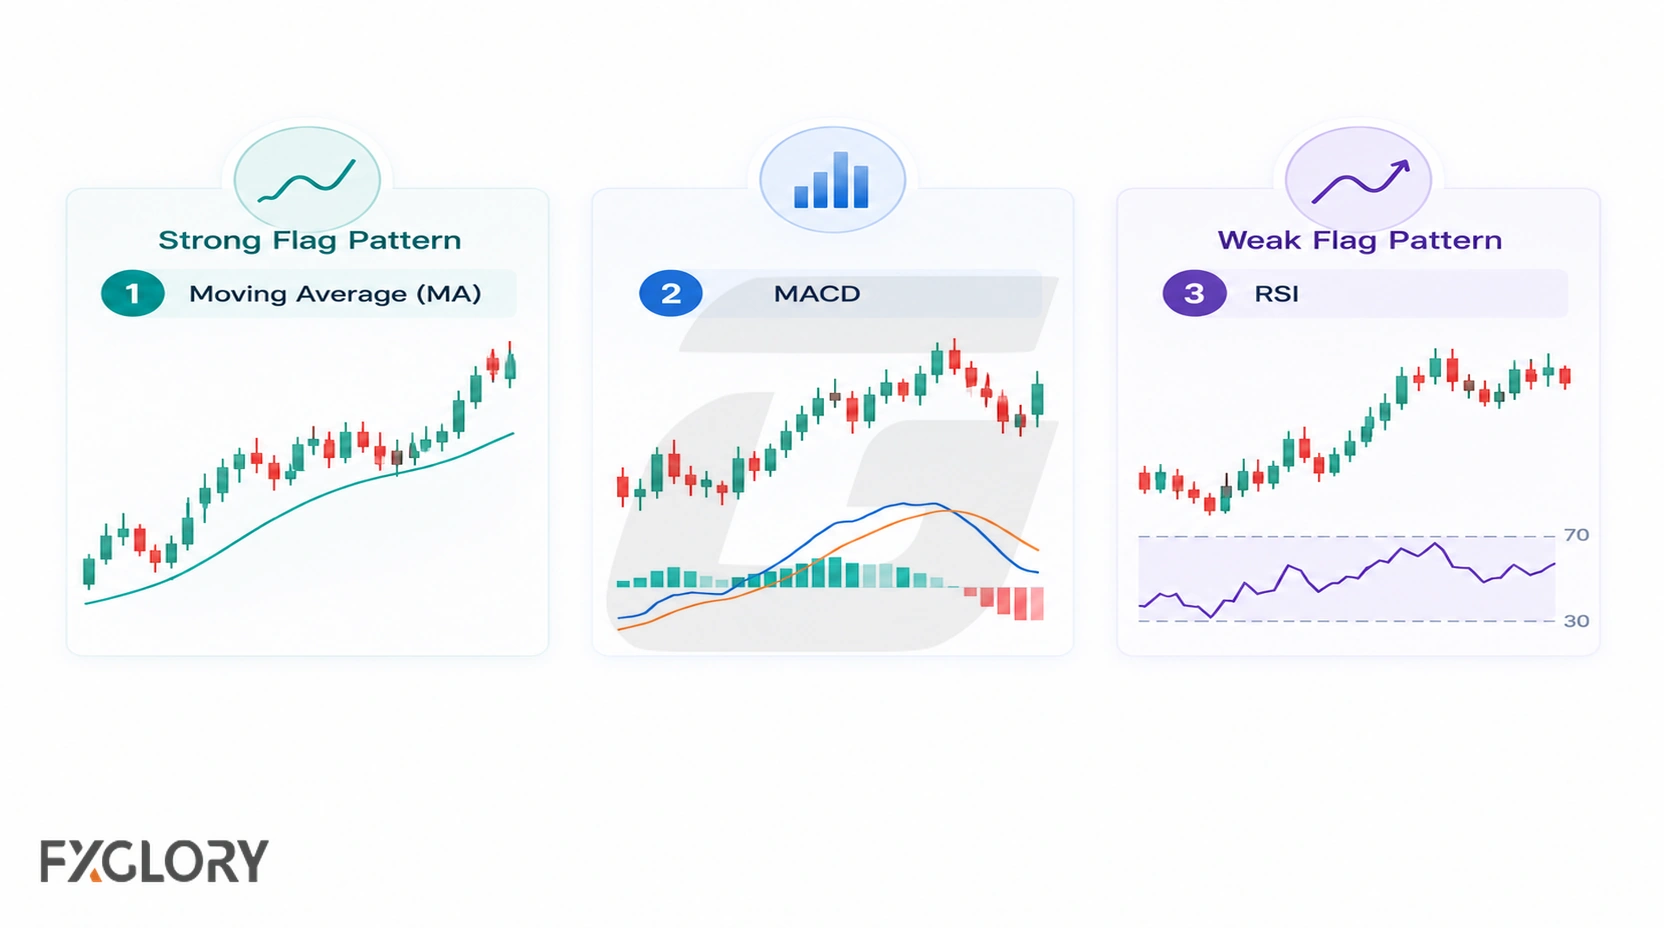
| Chart Factor | Stronger Flag Condition | Weaker Flag Condition |
|---|---|---|
| Flagpole | Sharp directional move before the pause | No clear impulse before the channel appears |
| Flag size | The pause is smaller than the flagpole | The pause erases too much of the prior move |
| Boundary shape | The flag forms between relatively parallel lines | The structure is messy, widening, or too irregular |
| Retracement depth | Price pulls back in a controlled way | Price retraces deeply into the flagpole |
| Duration | The pause is brief compared with the prior move | The consolidation lasts so long that momentum becomes unclear |
| Confirmation | An initial break gains support from a close, sustained hold, or follow-through | The trader reacts before boundary behavior is clear |
| Context | The setup does not fight stronger higher-timeframe structure | The flag appears against a larger support, resistance, or trend conflict |
| Risk plan | Invalidation and position risk are defined before acting | The trader focuses on the expected continuation but not the wrong point |
How to Confirm a Forex Flag Pattern
Confirmation helps separate a visible flag candidate from a more developed continuation scenario. It does not prove that price will continue, but it gives more information than the shape alone.
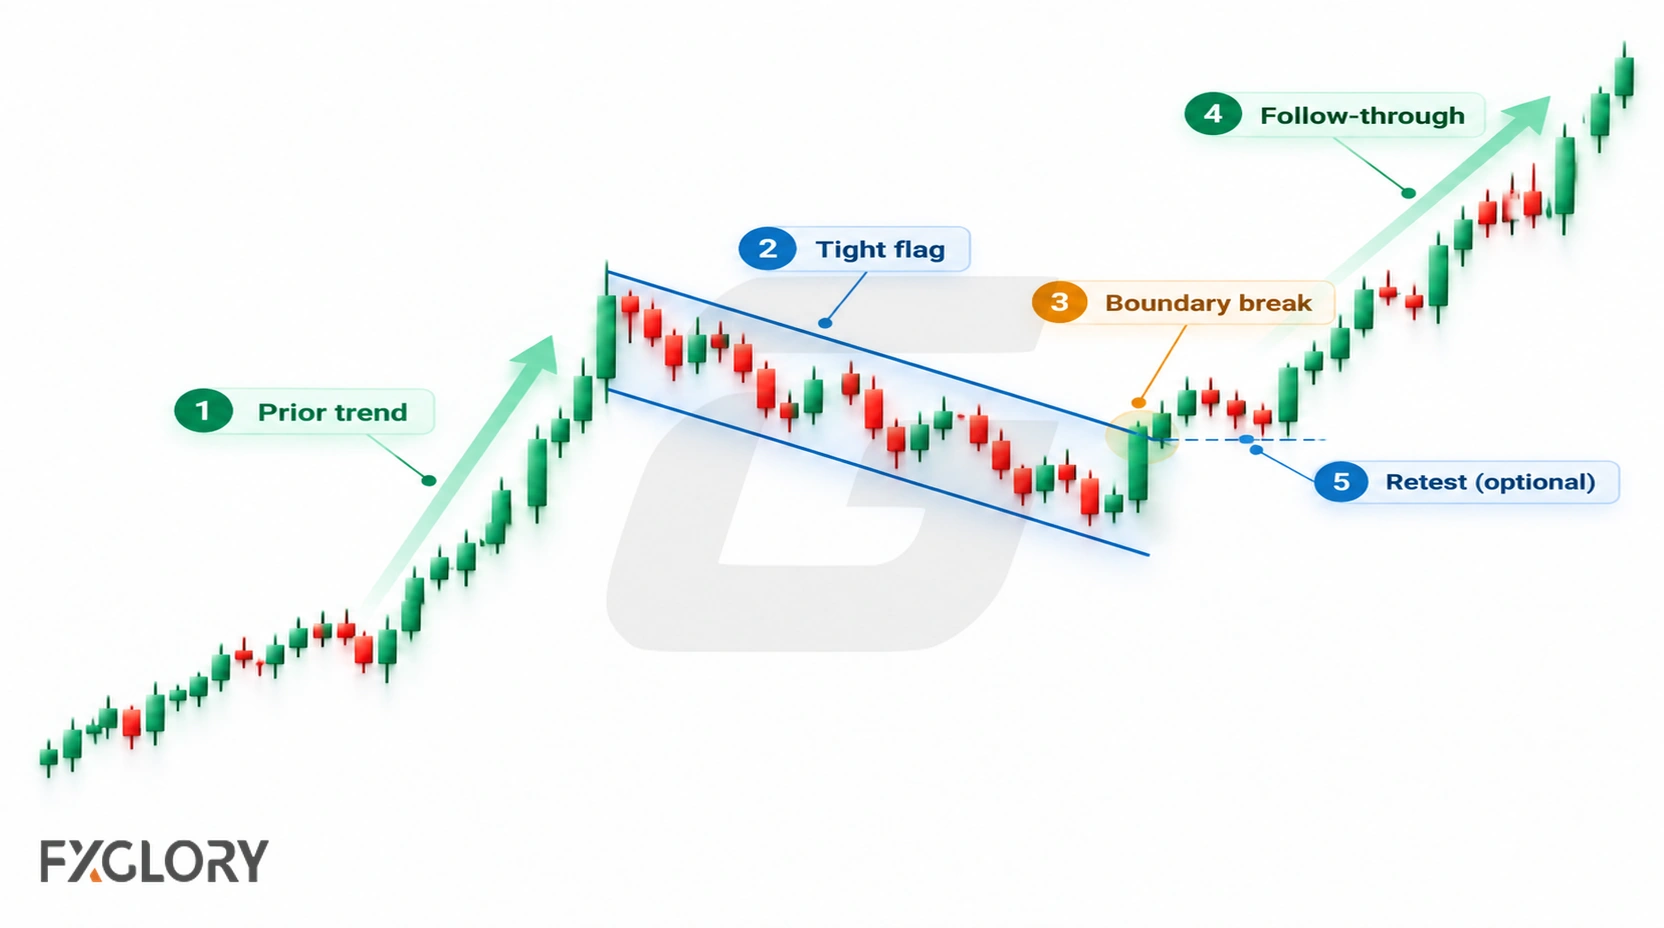
- Identify the structure: Confirm a distinct flagpole and smaller, relatively parallel consolidation.
- Observe the initial break: Price crosses the boundary in the direction of the flagpole; this is the breakout event, not proof of continuation.
- Assess stronger evidence: A close outside the channel, subsequent holding behavior, or follow-through may strengthen the scenario. No single criterion is universally sufficient.
- Evaluate any retest: A return to the boundary may offer additional evidence but is not mandatory. A brief crossing is different from sustained acceptance back inside.
- Apply context and planning: Consider volatility, costs, higher-timeframe levels, and define any trade’s cancellation and risk rules independently of pattern identification.
Some methods estimate possible continuation distance by measuring the flagpole from its starting price to its end and projecting that same price distance from a stated breakout reference level. This is a measured-move illustration, not a target guarantee. Price may move only part of the way, retest, range, reverse, or fail immediately.
Readers who need a full entry, exit, and position-risk framework can consult the forex breakout strategy guide.
Invalidation: When the Flag Pattern Idea Fails
Recognizing a flag, confirming a continuation breakout, and defining a trade exit are different tasks. A flag can exist while price remains inside its channel; without a continuation breakout, that scenario is unconfirmed rather than invalidated.
- Structural deterioration: The pullback erases much of the flagpole, or the consolidation grows so broad or irregular that the original flag description no longer fits.
- Opposite-side break: Price exits below a bullish flag or above a bearish flag, weakening the expected continuation case.
- Failed breakout: After breaking in the expected direction, price sustains a move back inside the channel or violates a holding condition specified in advance. A brief retest alone does not necessarily invalidate it.
- Contextual pressure: Higher-timeframe levels, fast news-driven moves, or changing liquidity may reduce the usefulness of a setup without automatically erasing its original structure.
For an actual position, the trader separately defines entry, stop or cancellation conditions, position size, and acceptable loss. A stop can be triggered even when the earlier flag identification was sound; conversely, a correctly drawn flag can produce a failed continuation breakout.
False Flag Patterns in Forex
A misleading flag setup may be an ordinary channel mislabeled as a flag, or a genuine flag followed by a failed continuation breakout. Those are different outcomes. The most common problem is treating any small channel as a flag, even when there was no meaningful flagpole.
| False Signal | What It Looks Like | Careful Reading |
|---|---|---|
| No real flagpole | A channel appears without a sharp prior move | The structure may be an ordinary channel or range |
| Retracement too deep | The flag erases too much of the original move | The continuation idea weakens |
| Consolidation too long | The flag stretches for many swings without direction | Momentum may no longer support the flag idea |
| Channel widens | The pause expands instead of staying controlled | The structure may not be a clean flag |
| Fake breakout | Price breaks out, then sustains a return inside the flag | The breakout may have failed; a brief retest is not enough by itself |
| News distortion | A fast event-driven move breaks the structure suddenly | Wait for structure to rebuild before judging the pattern |
Forex Context: Sessions, News, Spread, Slippage, and Timeframes
Forex flag patterns should be read with market conditions because currency pairs trade across global sessions. A flag breakout that looks clean during quiet movement may behave differently during a session overlap, economic release, or fast volatility shift.
- Session behavior: Breakouts during active sessions may behave differently from moves during thin liquidity.
- News events: Economic releases and central-bank comments can overpower a flag structure quickly.
- Spread and slippage: Fast movement around a breakout, retest, or invalidation area can affect execution and risk.
- Pair behavior: Different currency pairs may trend, pause, and break from flags differently.
- Timeframes: A lower-timeframe flag can conflict with a stronger higher-timeframe support, resistance, or trend.
- Volatility shift: A quiet flag can become unstable if movement expands suddenly.
A flag pattern becomes more useful when the trader can explain the flagpole, flag channel, breakout condition, invalidation, and market conditions before considering any trade decision.
Volume and Tick Activity in Forex Flag Patterns
Many flag-pattern discussions mention volume drying up during consolidation and increasing during breakout. In spot forex, this needs caution because there is no single centralized exchange volume figure for the entire market.
Some traders use tick activity as a supporting clue around the flag channel, breakout, or retest. This can add context, but it should not be treated as proof of continuation. When volume-style context matters, tick-volume reading in forex should stay secondary to structure, confirmation, and risk.
Using Indicators and Candles With Flag Patterns
Indicators and candlestick reactions can support flag-pattern analysis, but they should not replace price structure. Identify the flagpole and controlled channel first; breakout behavior and risk planning are separate stages.
| Tool Type | What It Can Help Read | Careful Use |
|---|---|---|
| Momentum indicators | Whether pressure supports the continuation scenario | Momentum can fade or diverge before price confirms direction |
| Trend-strength indicators | Whether the original move still has trend pressure | They may lag after price has already moved |
| Volatility indicators | Whether movement is expanding or contracting around the flag | High volatility can make breakouts and retests harder to manage |
| Candlestick reactions | Short-term rejection or hesitation near flag boundaries | One candle is not the same as a complete flag confirmation |
| Tick activity | Activity around breakout or retest areas | It is supporting context, not centralized market volume |
When movement size matters around the flagpole or breakout, ATR-based volatility context can help frame changing conditions. When candle reaction matters near a boundary, candlestick behavior around key areas can add short-term detail. For broader momentum or trend context, indicator-based chart context may help organize the reading.
Example: Reading a Flag Pattern on EUR/USD
Consider an entirely hypothetical bullish flag in EUR/USD. Price rises from 1.1000 to 1.1100, forming a 100-pip flagpole. It then consolidates in a smaller, slightly descending channel, with illustrative price action between roughly 1.1070 and 1.1100. The 30-pip retreat from the flagpole high is shallower than the original impulse.
Suppose the descending upper boundary is near 1.1090 when price crosses it at 1.1095. That crossing is initial breakout evidence, not a completed guarantee of continuation. A subsequent close and continued trading above the moving boundary would strengthen the case; a retest may occur but is not required. If price instead sustains a move back inside the flag or breaks below its lower boundary, the bullish continuation scenario weakens. The original flag structure may still have been identified correctly.
For a simple measured-move illustration, projecting the 100-pip flagpole from the assumed 1.1090 boundary level gives 1.1190. Different reference points or execution costs change a practical calculation; 1.1190 is neither a forecast nor a guaranteed target.
Common Mistakes With Forex Flag Patterns
Flag-pattern mistakes often happen when traders see a small channel and assume continuation must follow.
- Ignoring the flagpole: The trader labels an ordinary channel as a flag even though no sharp move came first.
- Entering inside the flag too early: The trader reacts before price confirms boundary behavior.
- Forcing parallel lines: The channel is drawn around random swings to make the pattern fit.
- Ignoring deep retracement: The pause erases too much of the original move.
- Confusing flags with pennants or wedges: Converging structures are treated as parallel flag channels.
- Ignoring false breakouts: Price breaks the boundary briefly, then returns inside the flag.
- Missing higher-timeframe context: A small flag forms against a major level or broader trend conflict.
- Overusing volume assumptions: Volume-style clues are treated as if spot forex had one centralized exchange volume figure.
- No trade exit plan: The trader identifies the flag correctly but enters without a defined cancellation condition or acceptable risk.
Beginner Workflow for the Flag Pattern
A clear process helps keep flag patterns from becoming simple line-drawing guesses.
- Mark the impulse and pause: Identify a clear flagpole followed by a smaller, relatively parallel channel.
- Classify the candidate: Note the prior move’s direction and whether the pause remains controlled rather than becoming a broad range.
- Separate formation from breakout: Observe the expected boundary and decide what breakout evidence your method requires.
- Evaluate the result: Review a close, sustained hold, follow-through, or optional retest without treating any one as a guarantee.
- Plan independently: Check news, spread, slippage, and timeframe context; if trading, define your exit condition and position risk.
- Review afterward: Record whether the pattern identification was accurate separately from whether the continuation trade worked.
This process keeps the focus on the flagpole, channel quality, confirmation, invalidation, and risk instead of treating the flag name as an automatic continuation signal.
A Safer Way to Read Flag Patterns in Forex
The flag pattern helps traders organize a possible continuation scenario after a sharp directional move. A recognizable flag has a clear flagpole, a smaller controlled channel, and visible boundaries. Breakout confirmation and a defined risk plan determine whether a particular trading approach is actionable.
Bullish flags and bearish flags use the same basic structure in opposite directions. A bullish flag follows an upward move, while a bearish flag follows a downward move. Their continuation scenarios can fail if price breaks the opposite side, sustains a return inside after a breakout, retraces too deeply, or loses the compact channel structure.
Flag-pattern analysis becomes more useful when it is read with context. Session behavior, news, spread, slippage, volatility, timeframe alignment, pair behavior, position size, and account risk still matter.