
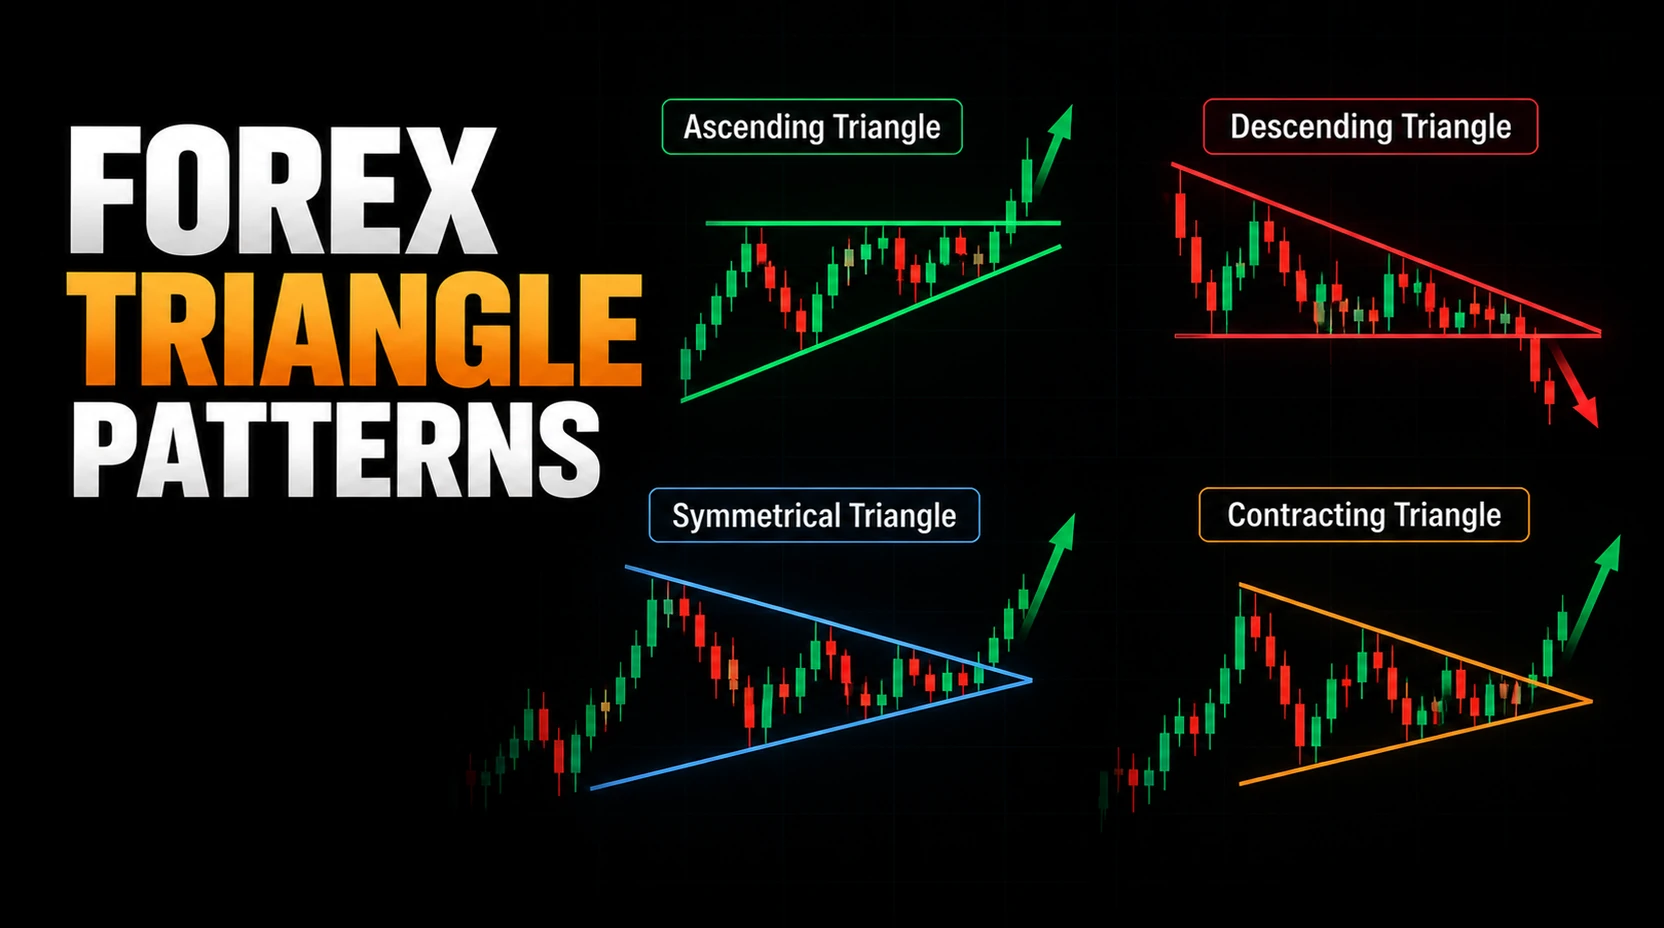
What Are Forex Triangle Patterns?
Forex triangle patterns form when price swings narrow between two boundaries that converge or partly converge. One or both sides may slope, depending on the type. Traders use the structure to identify potential breakout levels, not to predict which side must break.
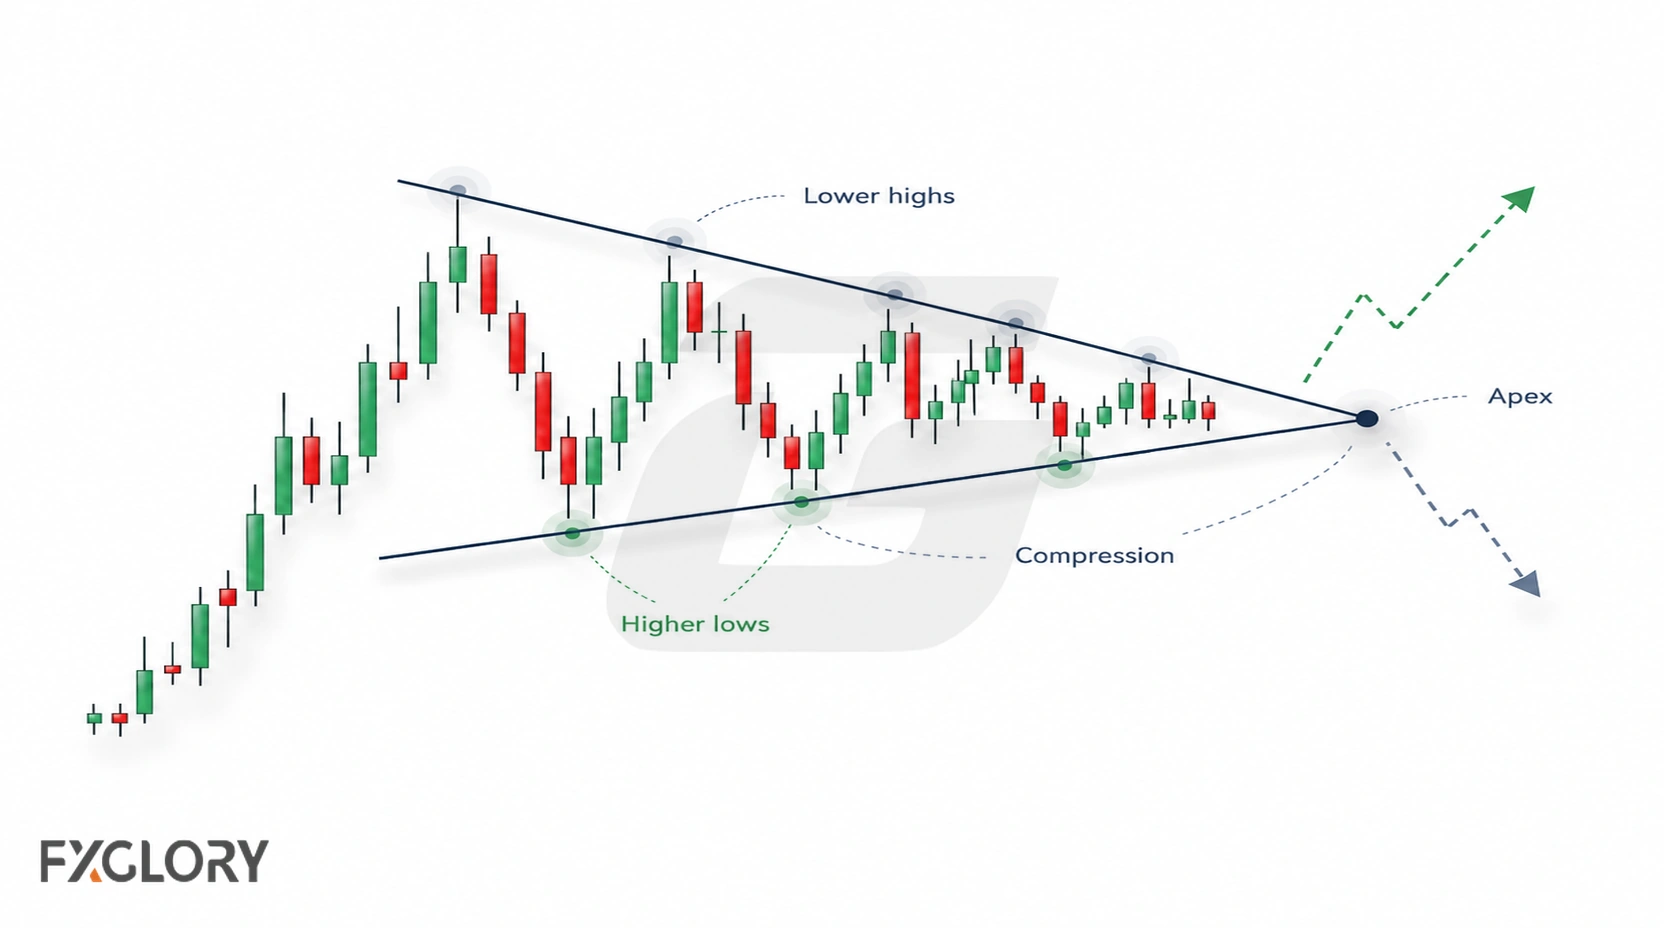
A triangle may appear during a trending market or a broader consolidation. Its role as a continuation or reversal pattern becomes clearer from the preceding move and the eventual breakout. See the forex chart-pattern overview for the wider classification.
How Triangle Patterns Form in Forex
As a triangle develops, successive swing highs, swing lows, or both move closer together. Several identifiable reactions help establish the boundaries. Price can then break either side, keep oscillating within the structure, or lose a clearly distinguishable shape.
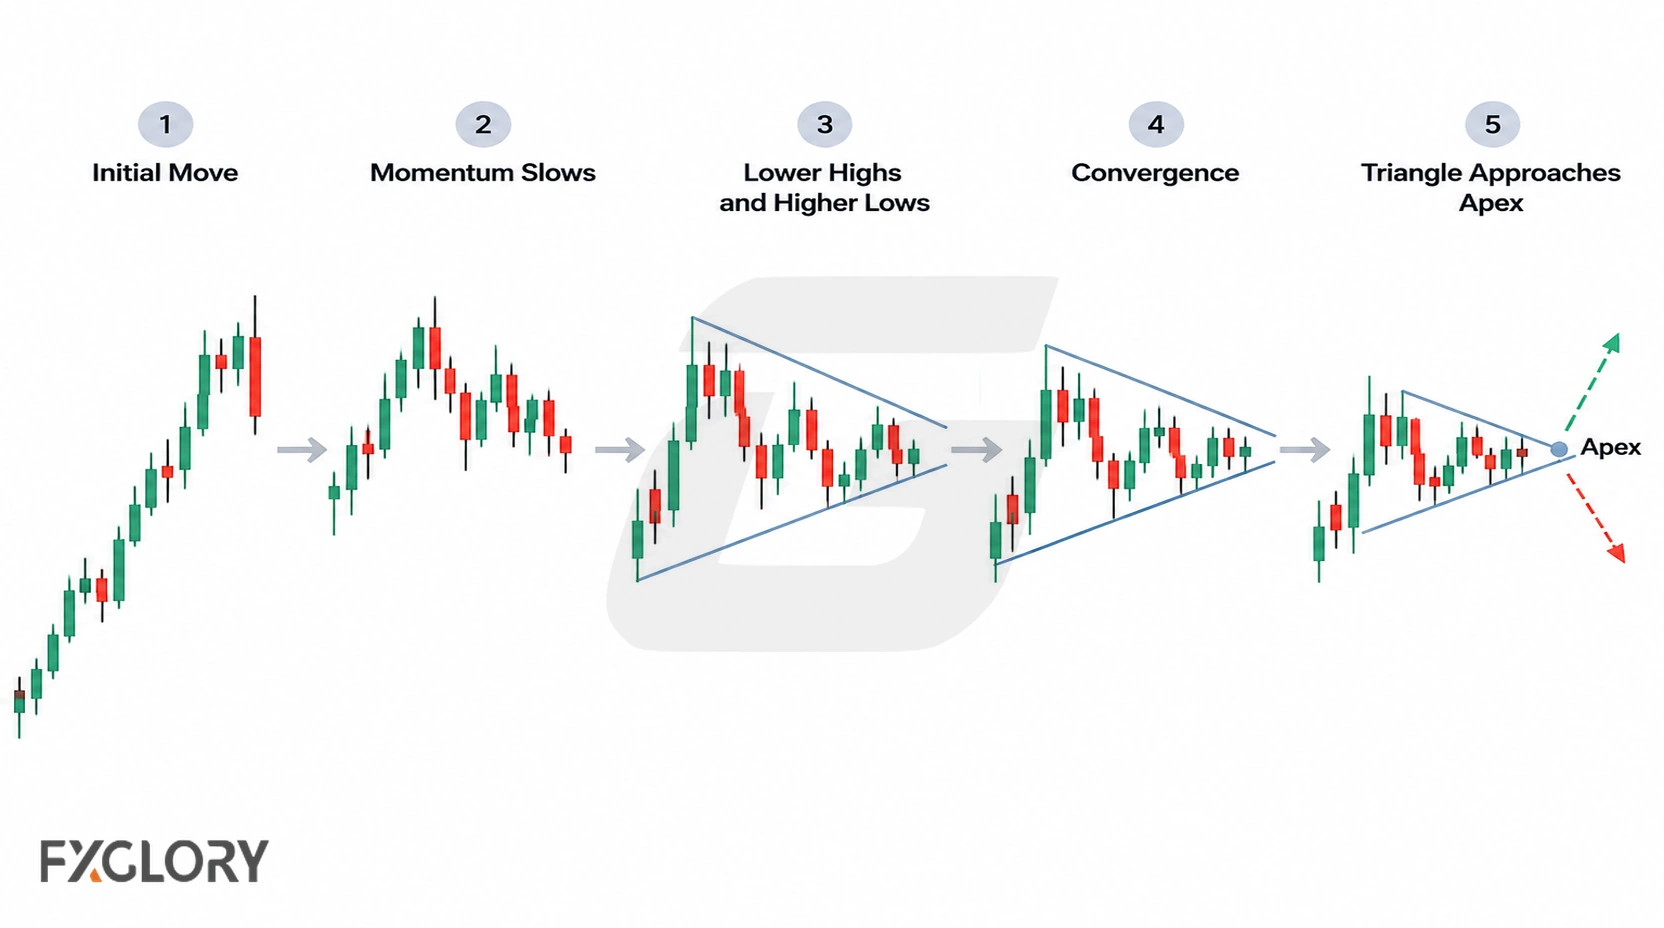
The apex is the projected meeting point of the two boundaries, not a required breakout destination. Price can escape earlier. When price compresses into very small swings close to the apex, marking a useful break can become difficult; that does not establish a universal failure rate for late breakouts.
Triangle Pattern Anatomy
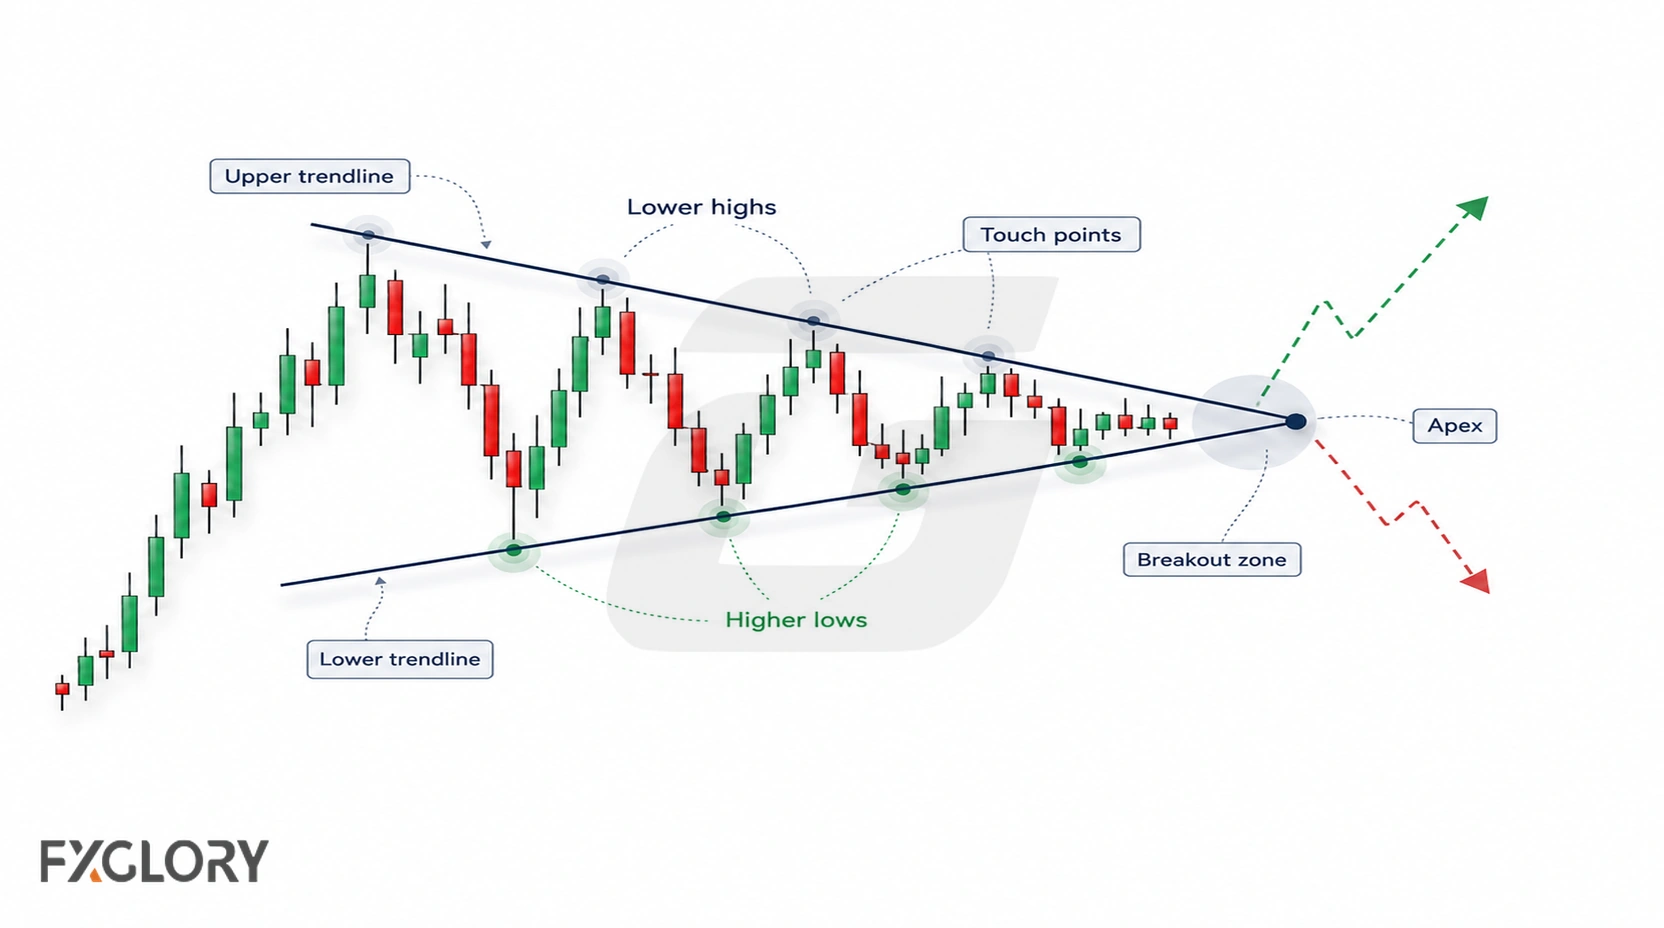
| Element | How to identify it |
|---|---|
| Upper boundary | Connect relevant swing highs, allowing for normal wick variation |
| Lower boundary | Connect relevant swing lows without repeatedly shifting the line |
| Touch points | Look for separate reactions on both sides, not just two isolated wicks |
| Apex | Extend the boundaries to their approximate meeting point |
| Breakout boundary | Use the relevant line value at the time of the attempted break |
Because sloping boundaries move with time, a level marked on one candle may not be the correct breakout threshold several candles later.
Types of Forex Triangle Patterns
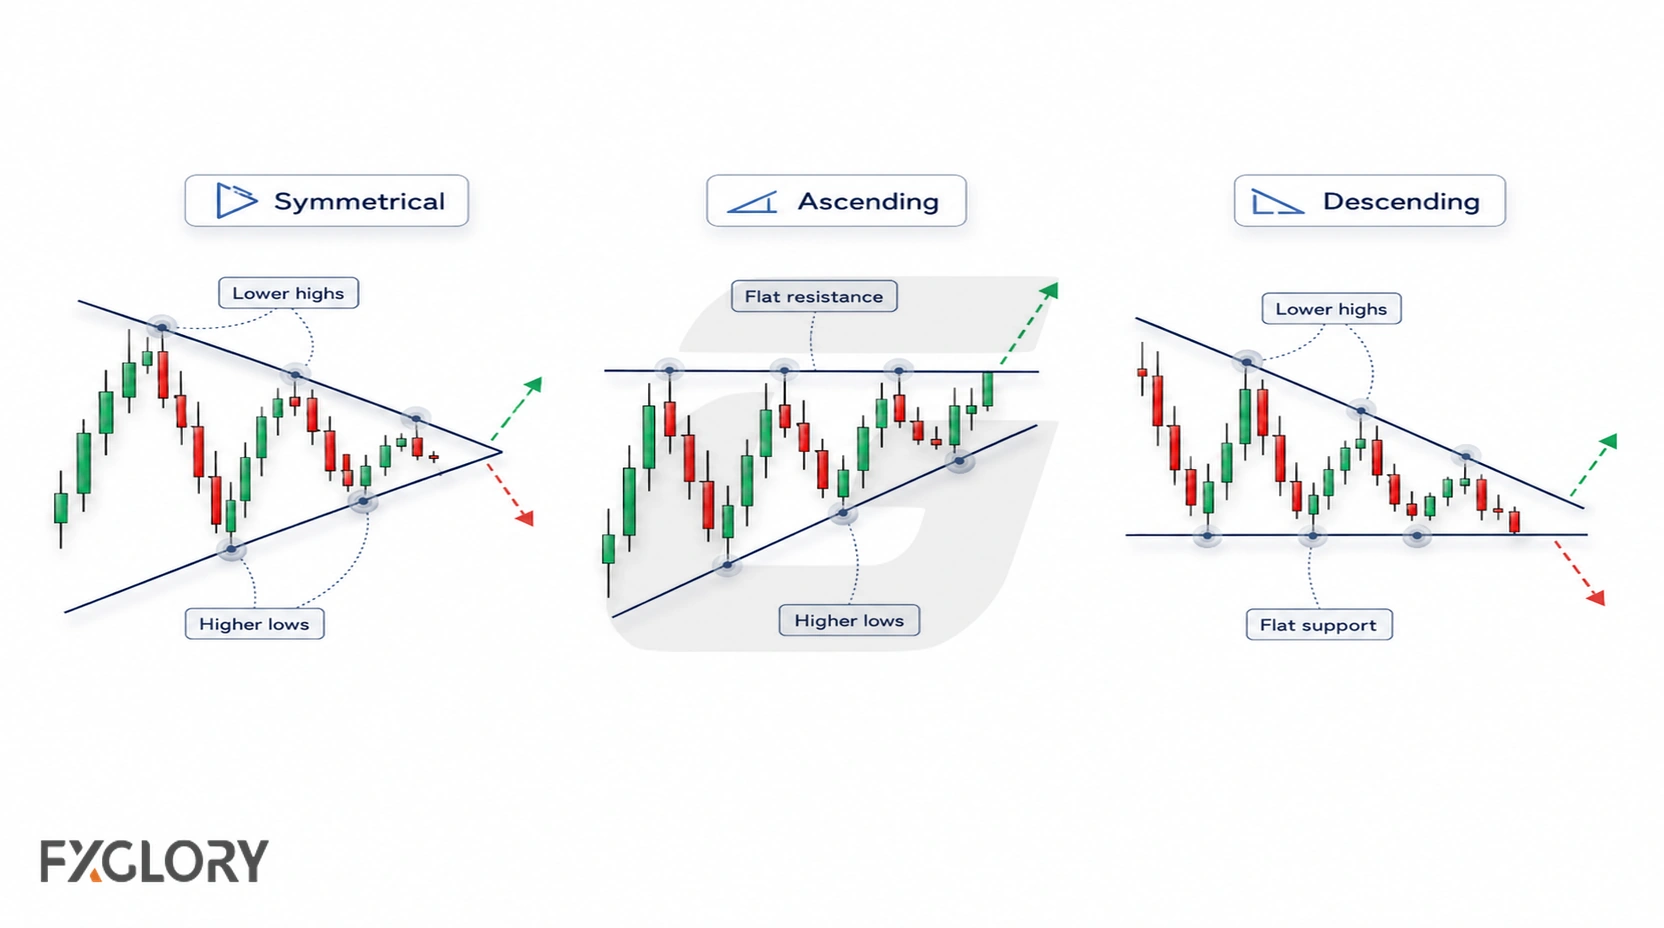
| Type | Shape | Conventional interpretation |
|---|---|---|
| Symmetrical | Lower highs and higher lows | Compression from both sides, without an intrinsic directional break signal |
| Ascending | Relatively flat resistance with rising lows | Increasing tests of resistance can suggest upward pressure |
| Descending | Relatively flat support with falling highs | Increasing tests of support can suggest downward pressure |
Directional expectations are interpretations of shape, not verified breakout probabilities. Ascending triangles can break downward, descending triangles can break upward, and symmetrical triangles can resolve either way. Determine the outcome from actual boundary behavior.
How to Judge Triangle Quality
Assess the drawing before examining any breakout. Structural clarity and later trading performance are separate questions.
| Feature | Readable structure | Questionable structure |
|---|---|---|
| Swings | Several distinct reactions identify the sides | One wick is doing most of the work |
| Geometry | Boundaries show a recognizable narrowing pattern | Price swings do not actually contract |
| Drawing | Line placement stays consistent as new candles form | Lines must continually be moved to preserve the label |
| Context | The preceding price movement is identifiable | The triangle is selected from undifferentiated chart noise |
A well-drawn triangle can still fail to produce a lasting breakout; neat geometry does not establish a profitable strategy.
How to Confirm a Forex Triangle Breakout
Choose a breakout rule before interpreting the next candles. One method uses a candle close beyond the relevant upper or lower boundary; another might react to an intrabar cross. These produce different signals, especially in volatile conditions.
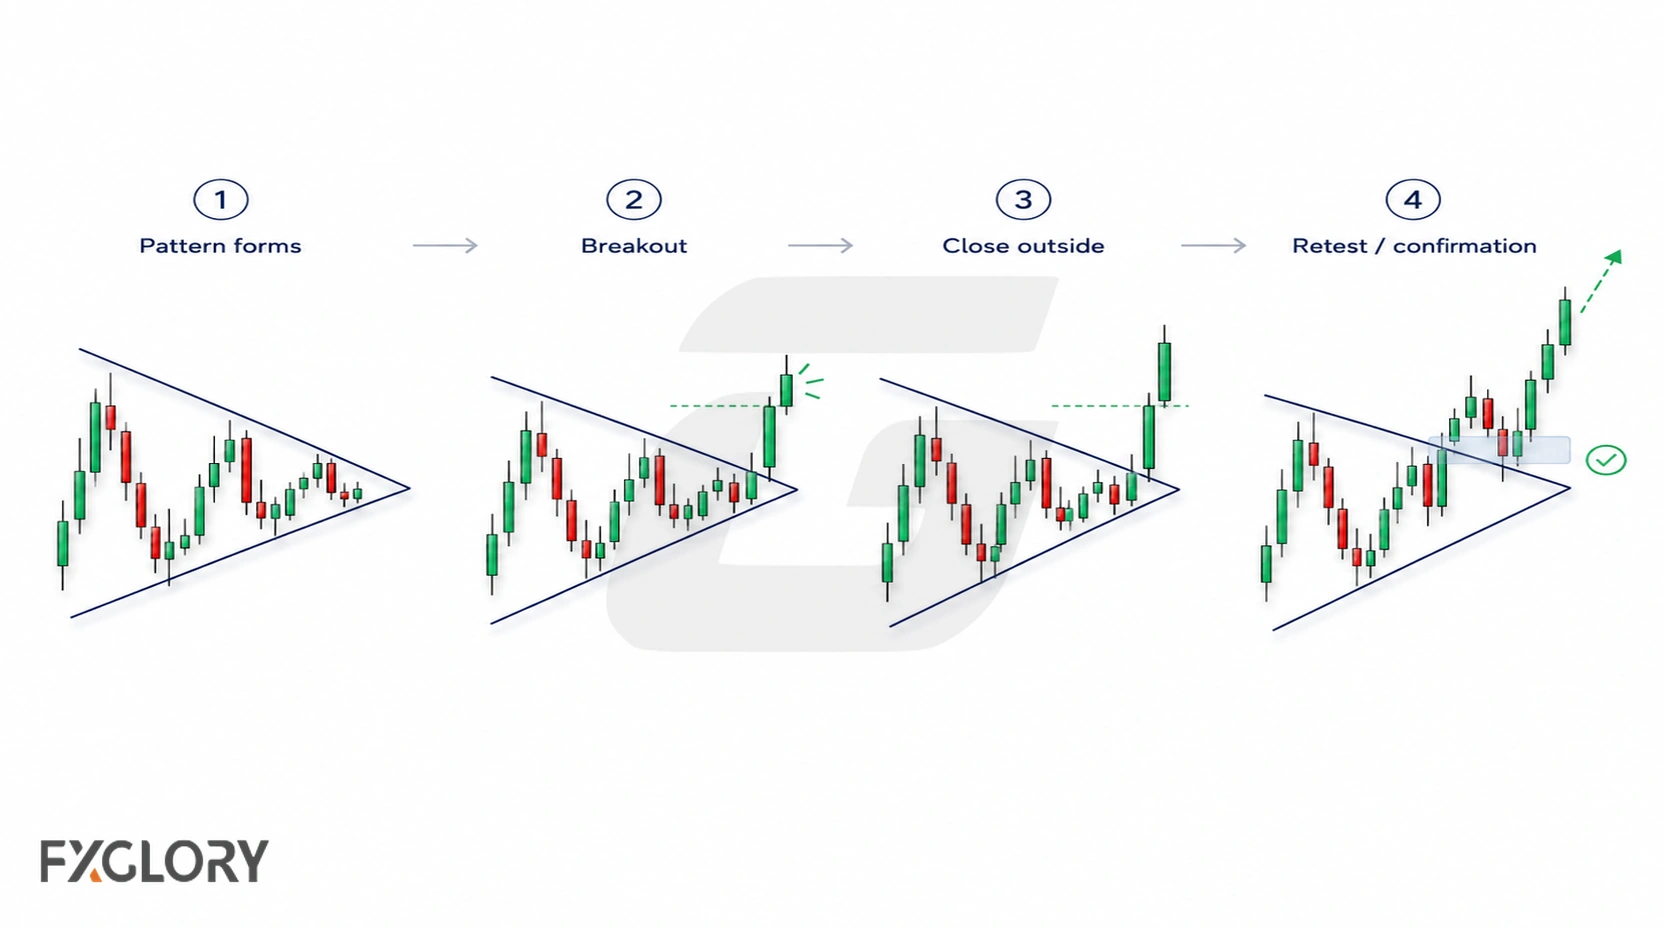
- Identify the triangle: Check the swings and the correct boundary locations.
- Specify the rule: Decide whether the price must cross or close beyond the line, and which timeframe applies.
- Check the breakout: Compare price with the boundary at that candle, not an earlier fixed value.
- Evaluate subsequent behavior: Price may extend, retest and reject the broken boundary, or move back inside.
- Define failure and risk: Record what would contradict the direction and consider spreads and execution costs.
Neither a retest nor a later hold outside substitutes for the initial break when using a boundary-break confirmation method. A candle-close requirement can screen out some intrabar spikes but does not eliminate false breakouts.
Unconfirmed, Failed and Invalidated Triangle Ideas
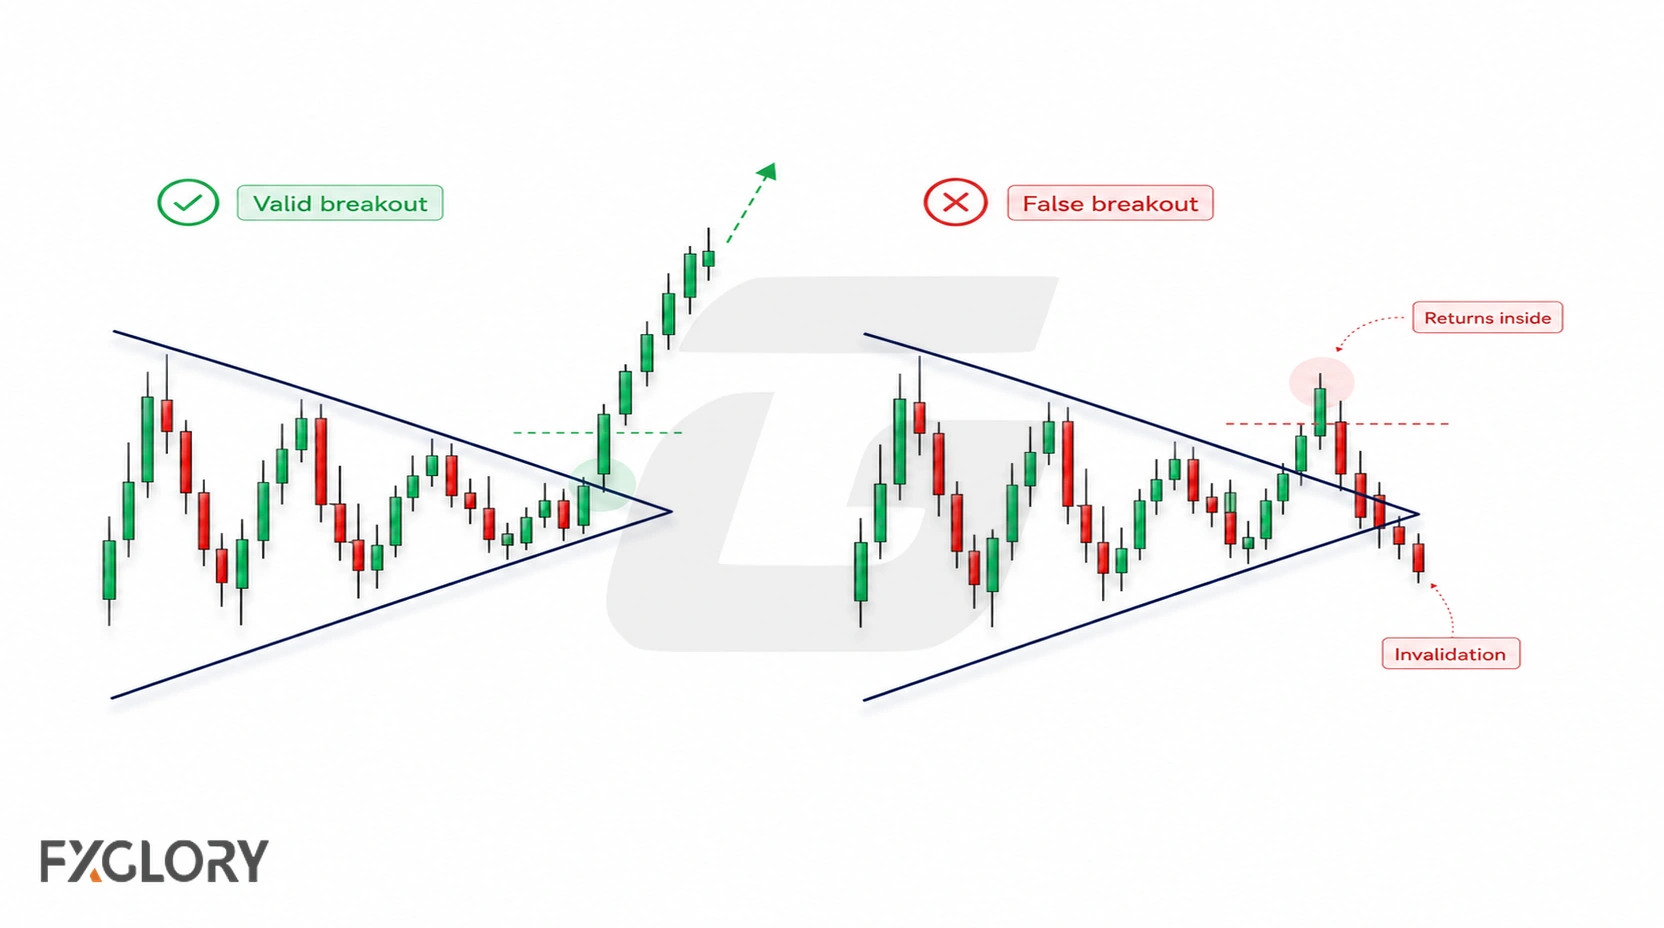
| Observation | Interpretation |
|---|---|
| Price remains within the boundaries | Triangle candidate is unconfirmed, not invalid solely because it has not broken |
| Price crosses a boundary but does not meet the selected close-based rule | Unconfirmed attempt under that rule |
| Price meets the breakout rule, then returns inside and holds | Potential failed breakout |
| Price subsequently breaks and holds beyond the opposite boundary | May invalidate the original directional thesis under predefined criteria |
| Boundaries become impossible to mark consistently | Poor or no longer useful pattern identification, not necessarily a failed trade |
Higher-timeframe barriers, surprise news and rapidly widening spreads can make a breakout less attractive or more expensive, but they do not independently invalidate its geometry. A trade's stop and size must reflect a chosen strategy, instrument value and account-risk limit rather than a universal triangle rule.
Triangle vs Wedge vs Pennant
| Structure | Distinctive clue |
|---|---|
| Triangle | Converging or partly converging boundaries, including flat-sided variants |
| Wedge | Both boundaries generally slope upward or downward |
| Pennant | Usually compact compression following a sharp directional move |
For detailed distinctions, read the wedge guide and pennant guide. Triangles within trends can also be compared with the continuation-pattern overview.
Forex Context: Sessions, News, Costs and Volume
Trading sessions, scheduled economic releases and thin liquidity can change the speed of a breakout. Spread widening and slippage affect fill prices, especially during fast markets. A nearby higher-timeframe level may constrain the space available for a move without automatically making the triangle invalid.
Spot forex has no single consolidated exchange-wide volume figure. Broker tick activity reflects updates in a particular feed rather than total worldwide transactions. Use it as contextual information, not proof of a breakout; the forex tick-volume guide explains this distinction.
Indicators and Candles With Triangle Patterns
Momentum tools may describe changes in price momentum, volatility indicators show changes in movement size, and candle closes help apply an explicitly defined breakout rule. They answer different questions and need not agree. For further explanation, see technical indicators, ATR volatility and candlestick patterns.
Hypothetical NZD/USD Triangle Example
Suppose NZD/USD shows lower swing highs at 0.6100, then 0.6080, while the lows rise from 0.6020 to 0.6040. This suggests a developing symmetrical triangle, provided later swings also respect narrowing boundaries. These prices are illustrative, not observed quotes.
Assume that at a later candle the current upper boundary is 0.6070 and the lower boundary is 0.6050. Under a rule requiring a candle close outside, a close at 0.6074 confirms an upside breakout attempt, whereas a wick to 0.6074 followed by a close at 0.6065 does not. If a confirmed upside break subsequently falls back below the upper boundary and holds inside, the bullish breakout thesis may have failed. A downside close below the contemporaneous lower boundary would instead be evaluated as a downside scenario.
Because triangle lines slope, the 0.6070 and 0.6050 boundaries in this example apply to that illustrative candle only; do not reuse them as permanent horizontal levels. The example is not a signal, historical backtest or predicted NZD/USD outcome.
Common Triangle-Pattern Mistakes
- Redrawing after the result: Adjusting the lines or confirmation rule retrospectively makes a chart interpretation impossible to evaluate fairly.
- Confusing a neat shape with a tested edge: A recognizable triangle is not evidence of a profitable method.
- Using stale boundary prices: A sloping line has a different value at each candle, so a supposed break must be checked against the current line.
- Confusing chart prices with order fills: Spread and slippage may change execution around a fast breakout.
Forex Triangle Patterns: Key Conclusion
Classify a triangle by its boundaries, decide in advance what counts as a breakout, and evaluate later price behavior separately. The resulting chart interpretation can organize a scenario, but it cannot settle direction or trading risk on its own.