
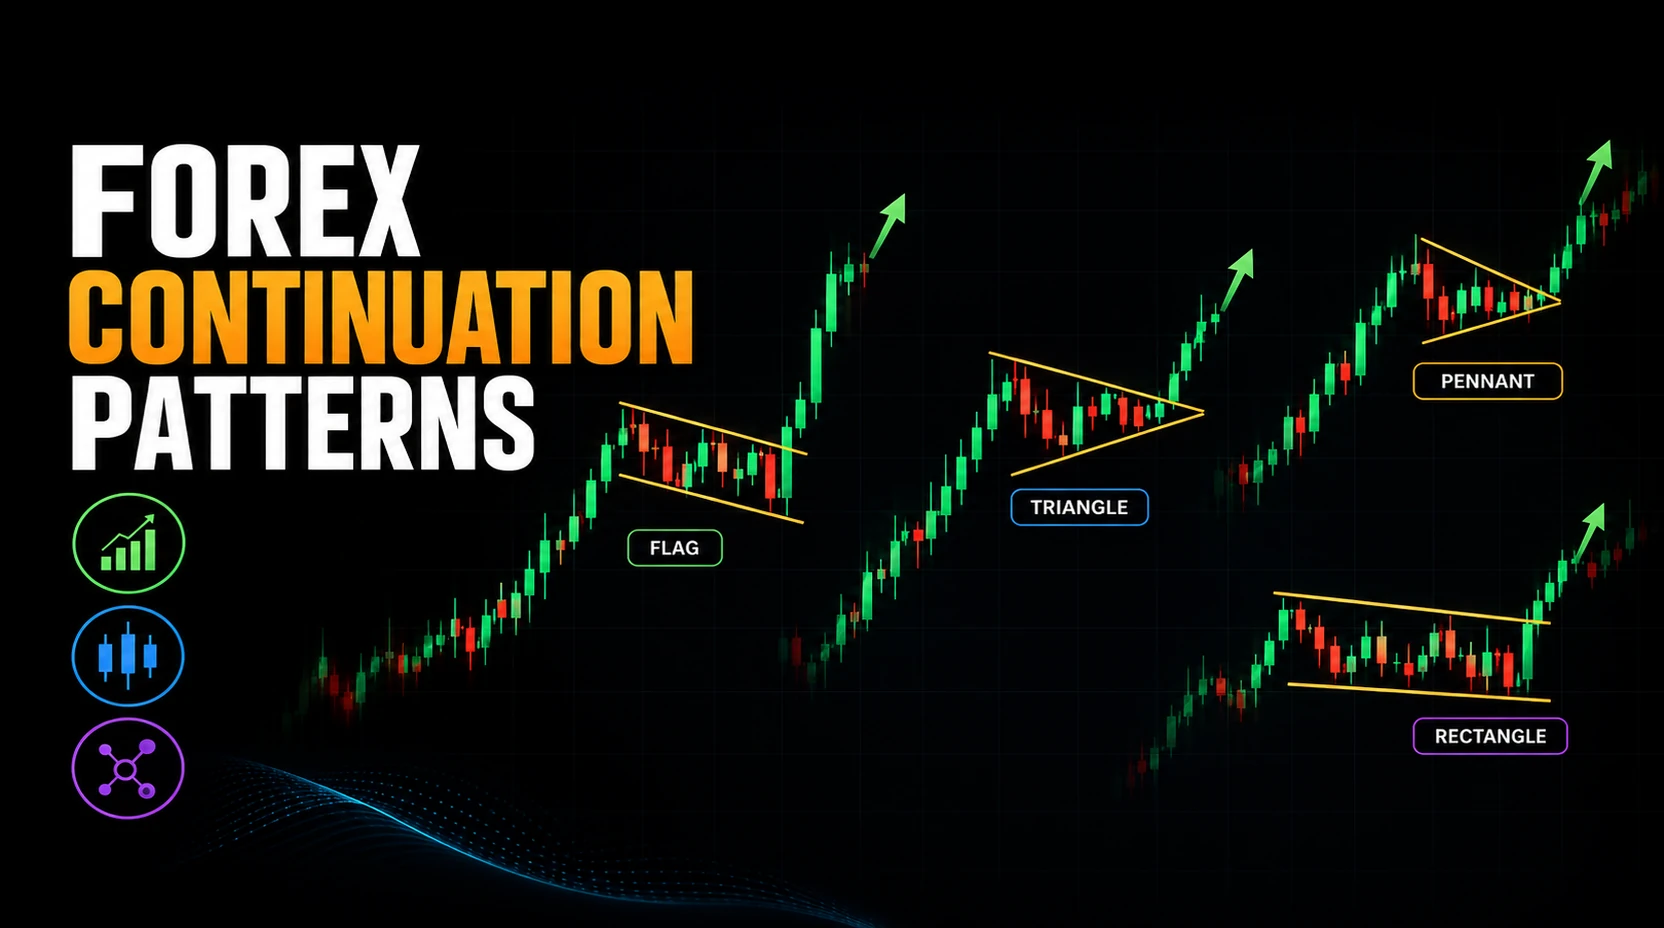
What Are Forex Continuation Patterns?
Forex continuation patterns are chart structures that may form when an existing trend pauses before another possible move in the same direction. The pause can appear as compression, a short channel, a sideways range, or a narrowing structure.
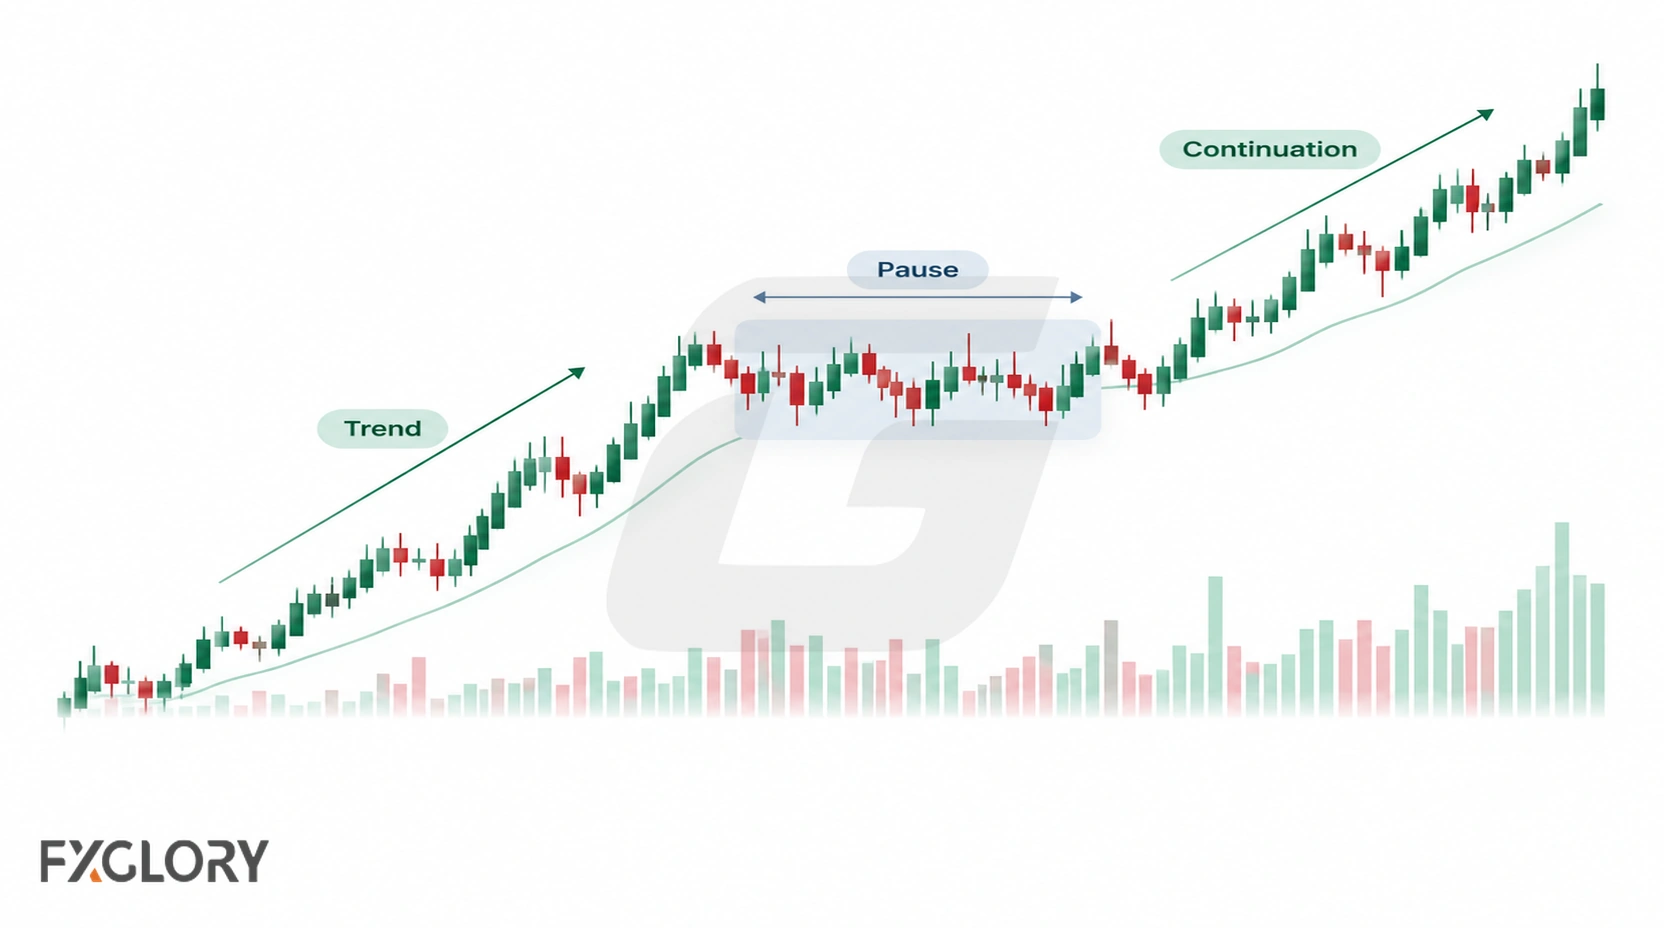
The defining context is the move before the pause: a similar consolidation without a prior trend may be a range or neutral formation. A breakout in the original direction is subsequent evidence, not a prerequisite for recognizing the pause.
A recognizable continuation formation is not automatically a trading signal. Confirmation evidence and a risk plan are separate decisions. For the broader chart-pattern framework, start with the full chart-pattern map.
How Continuation Patterns Form in Forex
After directional movement, price activity sometimes slows as participants take profits, reassess prices, or respond to nearby levels. These are possible explanations, not causes that can be established from the chart shape alone.
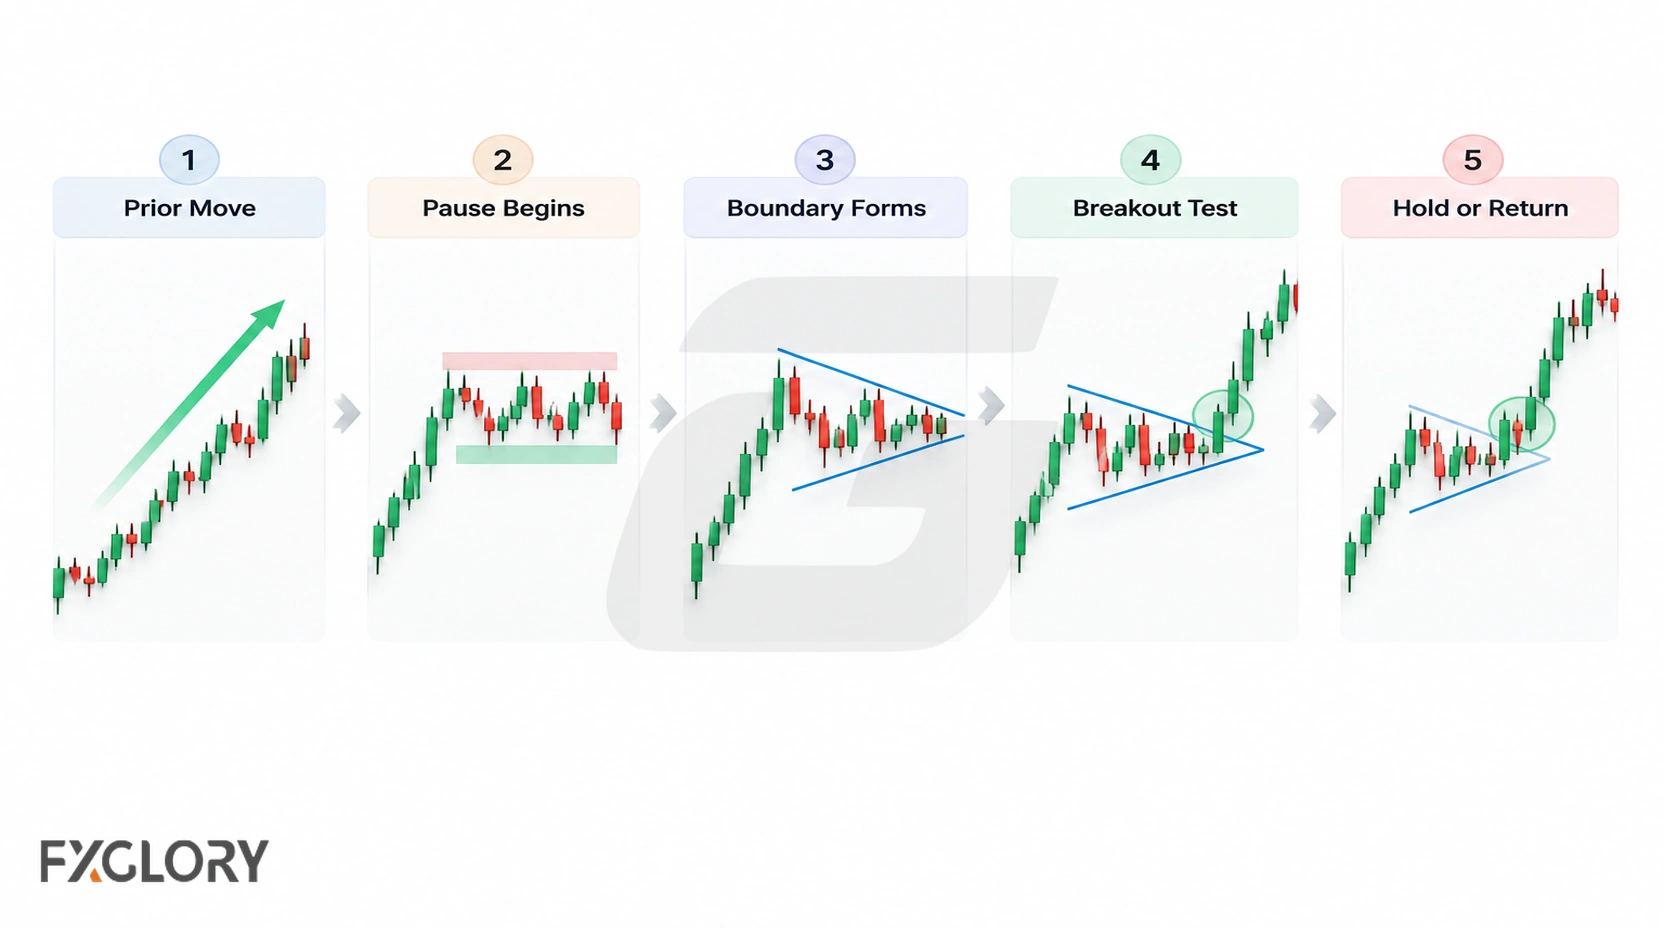
During this pause, price may create repeated highs and lows, a channel-like pullback, a small compression area, or a rectangle between support and resistance. If price later breaks from the pause in the direction of the earlier move and holds, the continuation idea becomes more developed.
- Prior movement: A trend or directional move exists before the pattern begins.
- Pause: Price stops moving strongly and starts consolidating or compressing.
- Boundary: The pattern has a visible edge, such as a range edge, trendline, channel boundary, or consolidation edge.
- Breakout attempt: Price tests one side of the structure.
- Follow-through check: Price either holds beyond the boundary or returns inside the pattern.
Without the prior movement, the same shape may simply be a range, a neutral pattern, or ordinary sideways movement.
Core Elements of a Forex Continuation Pattern
The first three elements describe the chart formation. The remaining rows describe how traders evaluate a possible breakout and plan a trade.
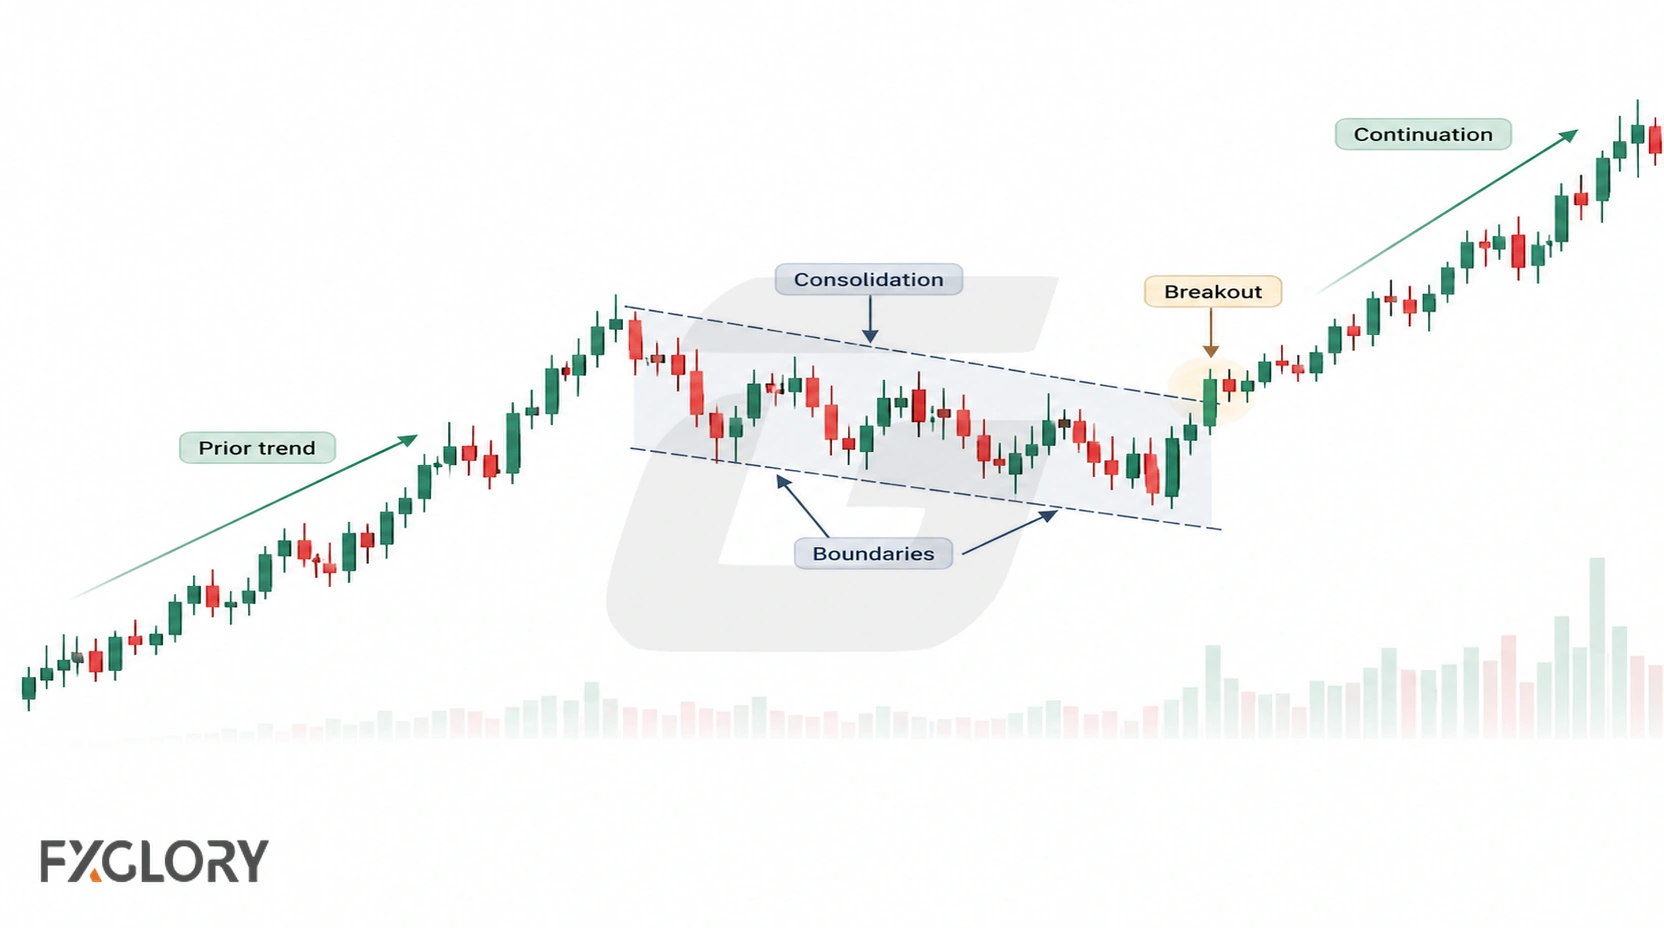
| Element | What It Means | Why It Matters |
|---|---|---|
| Prior trend | Price was moving in a clear direction before the pause | Continuation needs something to continue |
| Controlled pause | Price consolidates, compresses, or pulls back without fully breaking trend context | A messy pause may become a range instead |
| Visible boundary | The structure has a support, resistance, trendline, channel, or range edge | Provides a reference for a later breakout assessment |
| Breakout evidence | An initial boundary break may be followed by a close, hold, or optional retest | Evaluates continuation after the formation is recognizable |
| Scenario invalidation | A defined condition that contradicts the proposed continuation | Belongs to evaluating the setup, not defining the chart shape |
| Trade-risk plan | Entry, exit, position size, costs, and acceptable loss | Required before taking a trade, not before identifying a formation |
Bullish vs Bearish Continuation Patterns
A continuation pattern can form after an upward move or a downward move. The pattern group is similar, but the surrounding trend direction changes the scenario being studied.
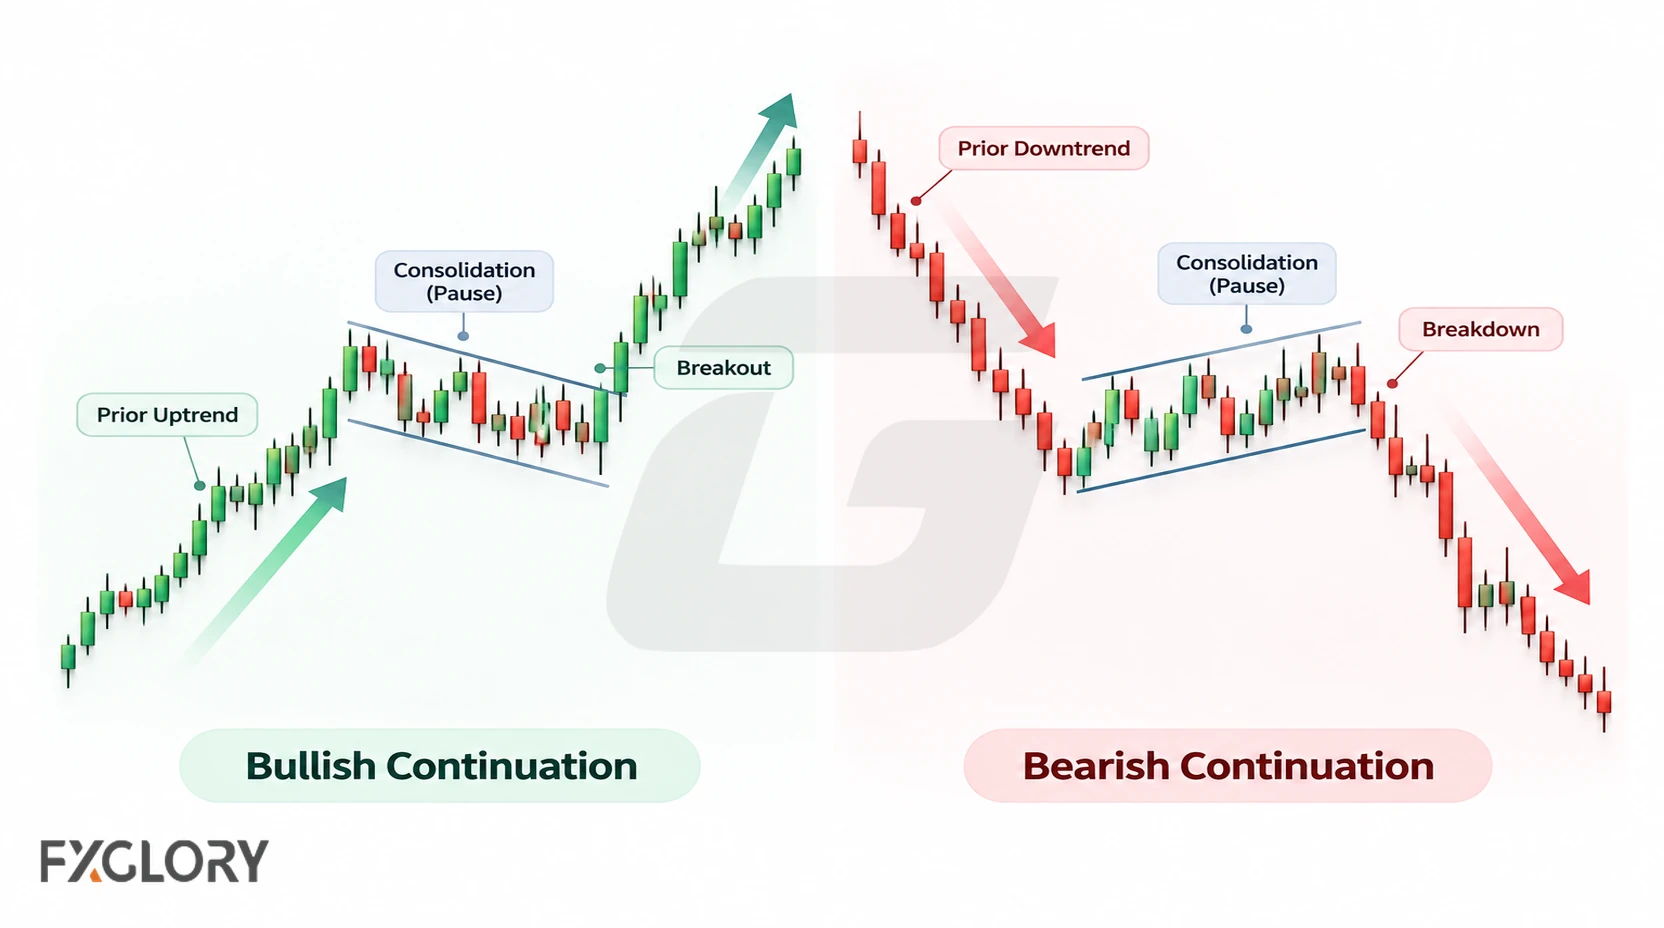
| Scenario | Prior Context | Pattern Idea | Careful Reading |
|---|---|---|---|
| Bullish continuation | Price has been moving upward before the pause | The market may be resting before another upward attempt | Do not assume continuation until price confirms the upper boundary or holds the structure |
| Bearish continuation | Price has been moving downward before the pause | The market may be resting before another downward attempt | Do not assume continuation until price confirms the lower boundary or holds the structure |
| Unclear continuation | The prior move is weak, choppy, or mixed | The pattern may not have enough trend context | Read it as consolidation or neutral structure until price gives clearer evidence |
Common Forex Continuation Patterns
Many chart structures can behave like continuation patterns when they form inside the right trend context. Distinguish the shape of each pause first; a breakout and risk plan are subsequent considerations.
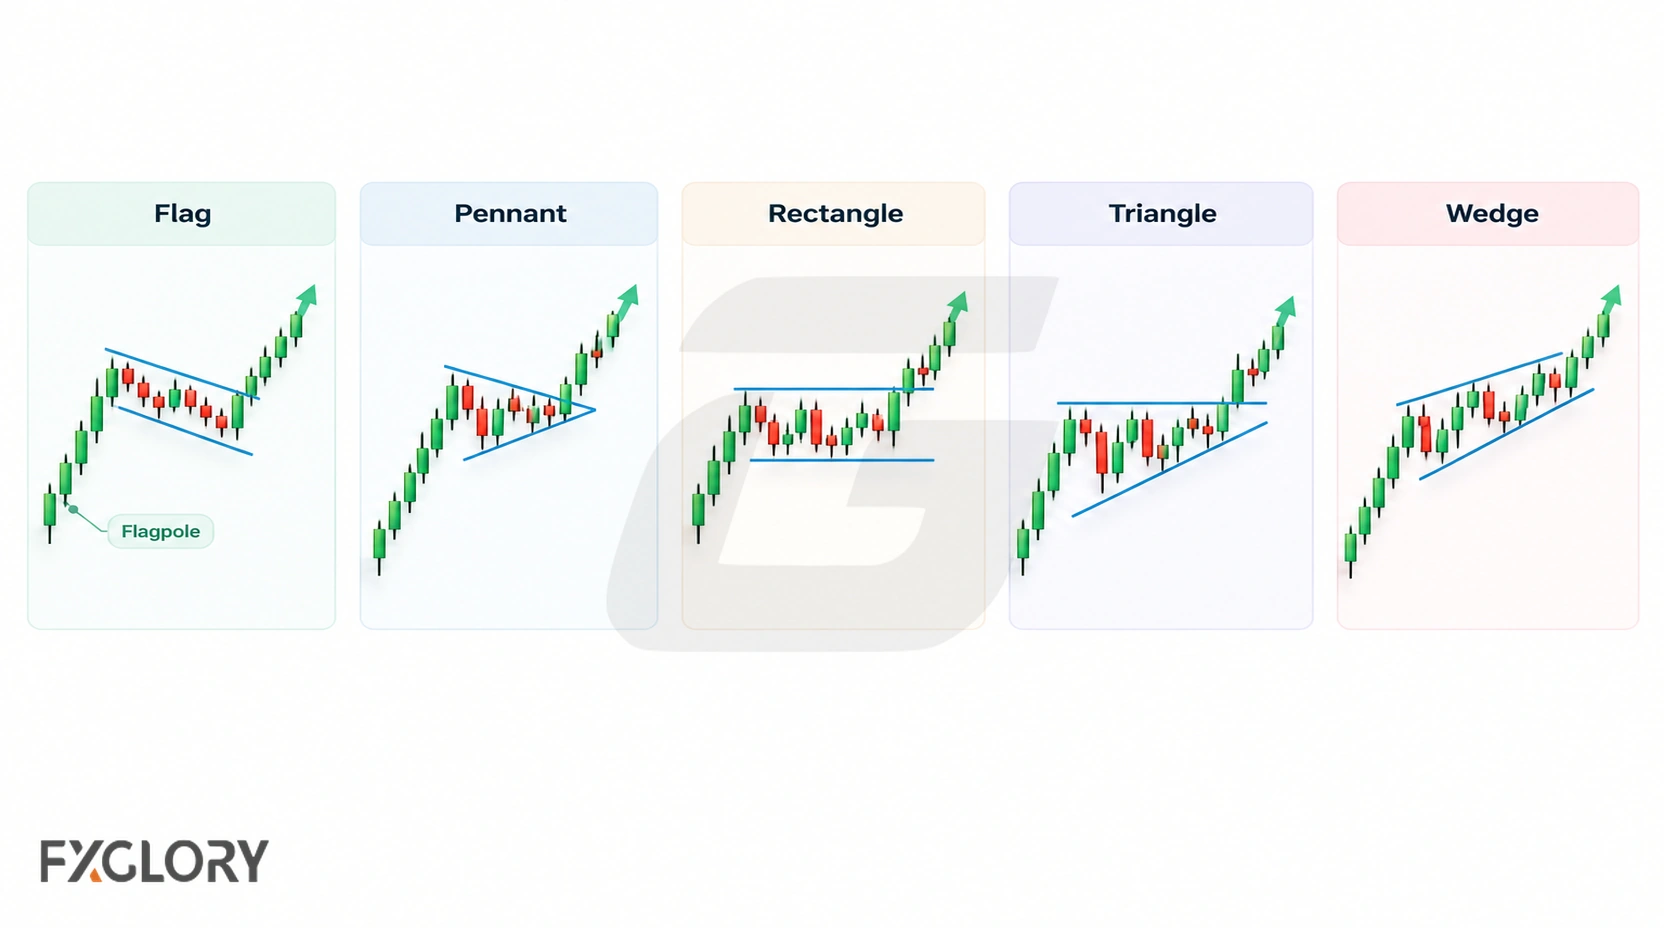
| Pattern | Typical Continuation Context | What to Check | Next Reading |
|---|---|---|---|
| Flag | A short channel-like pause after a sharp move | Whether price breaks from the pause in trend context | bullish and bearish flag patterns |
| Pennant | Small compression after a strong directional move | Whether compact consolidation breaks and holds | compact trend-pause structure |
| Rectangle | Sideways pause between repeated levels | Whether price leaves the range or rotates back inside | rectangle pattern in forex |
| Triangle | Compression during or after directional movement, only when trend context supports continuation | Which boundary breaks and whether direction is confirmed | narrowing price structure |
| Wedge | Narrowing movement inside a broader trend, only when location and confirmation support continuation | Trend context, slope, boundary behavior, and confirmation | angled compression behavior |
| Trend channel | Price moves between repeated angled boundaries | Whether channel behavior still supports the broader trend | Brief notes on this page |
| Cup and handle | Rounded recovery followed by a smaller pause | Whether the structure is clear enough to avoid forcing the shape | Brief notes on this page |
For a quick comparison of continuation patterns against reversal and neutral structures, use the chart-pattern reference sheet.
Strong vs Weak Forex Continuation Patterns
Chart quality depends on the prior trend, the clarity of the pause, and the boundaries. Whether a breakout holds and whether a proposed trade has acceptable risk are separate assessments.
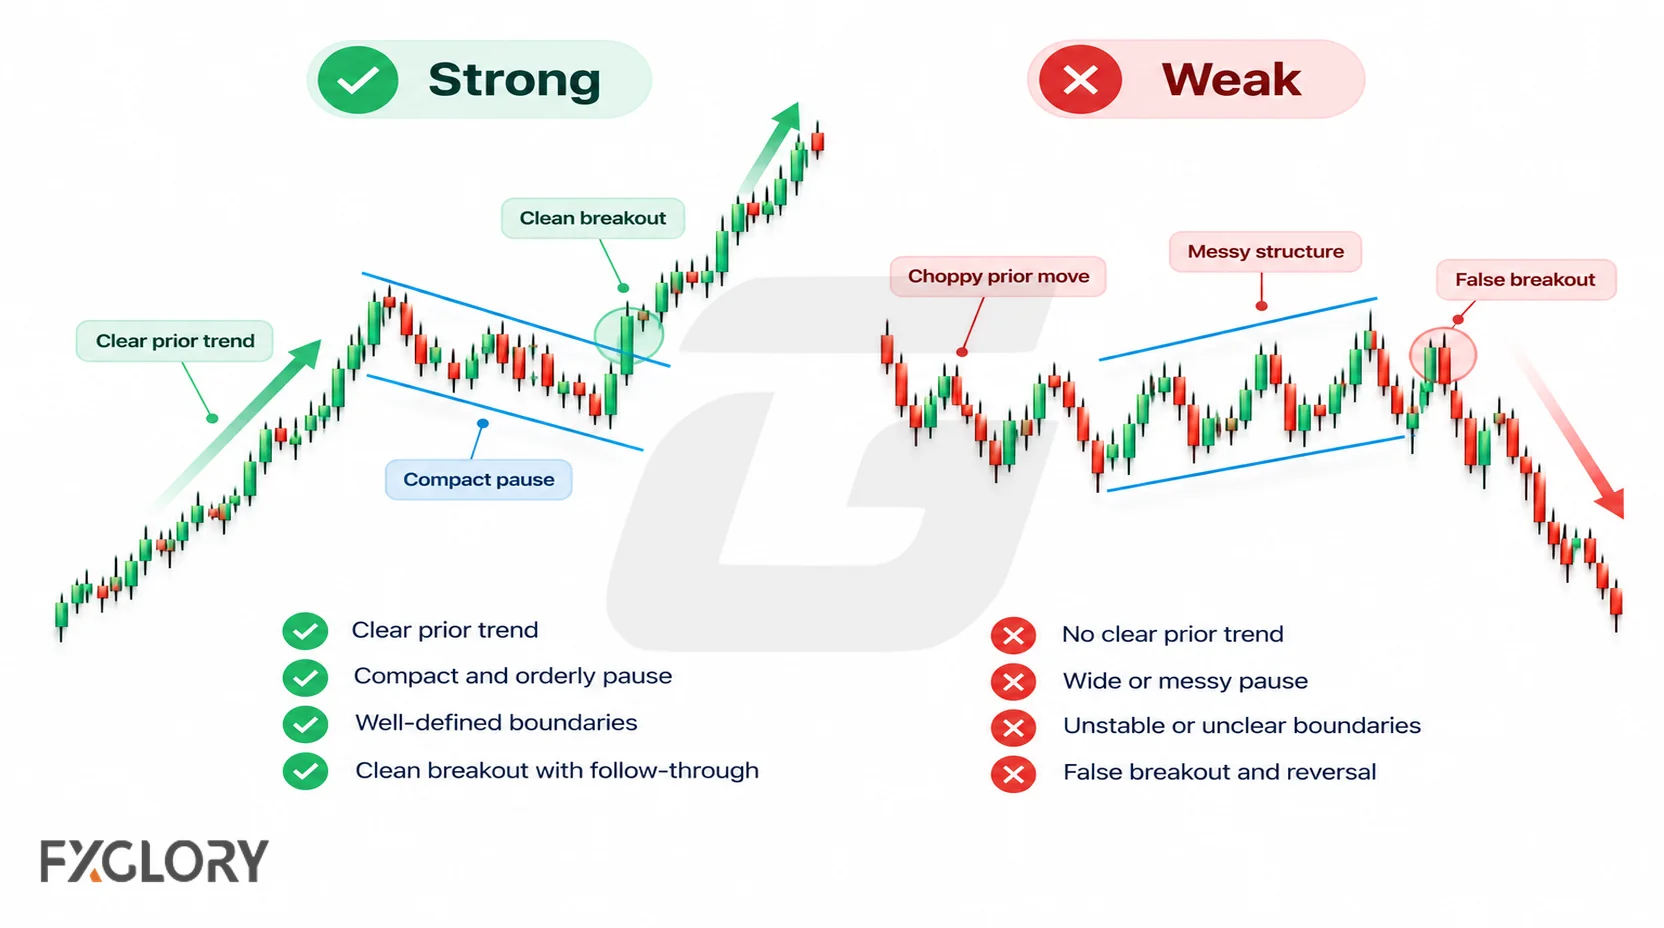
| Chart Factor | Stronger Continuation Condition | Weaker Continuation Condition |
|---|---|---|
| Prior trend | The direction before the pause is easy to describe | The market was already choppy or sideways |
| Pause structure | The pause is controlled, compact, or clearly bounded | The pause widens into an unclear range |
| Boundary | Support, resistance, channel, or trendline areas are visible | The boundary depends on one isolated wick or forced line |
| Breakout behavior | A break is followed by a clear close, holding behavior, or follow-through | Price spikes briefly and returns inside the pattern |
| Timeframe alignment | The lower-timeframe structure does not fight the higher-timeframe picture | A small pattern pushes against a stronger higher-timeframe level |
| Risk plan | Invalidation and position risk are defined before acting | The trader focuses on a possible target but not the wrong point |
How to Confirm a Forex Continuation Pattern
A recognizable trend-pause structure may exist before the breakout. Confirmation concerns what price does after testing or crossing its boundary; it does not guarantee continuation.
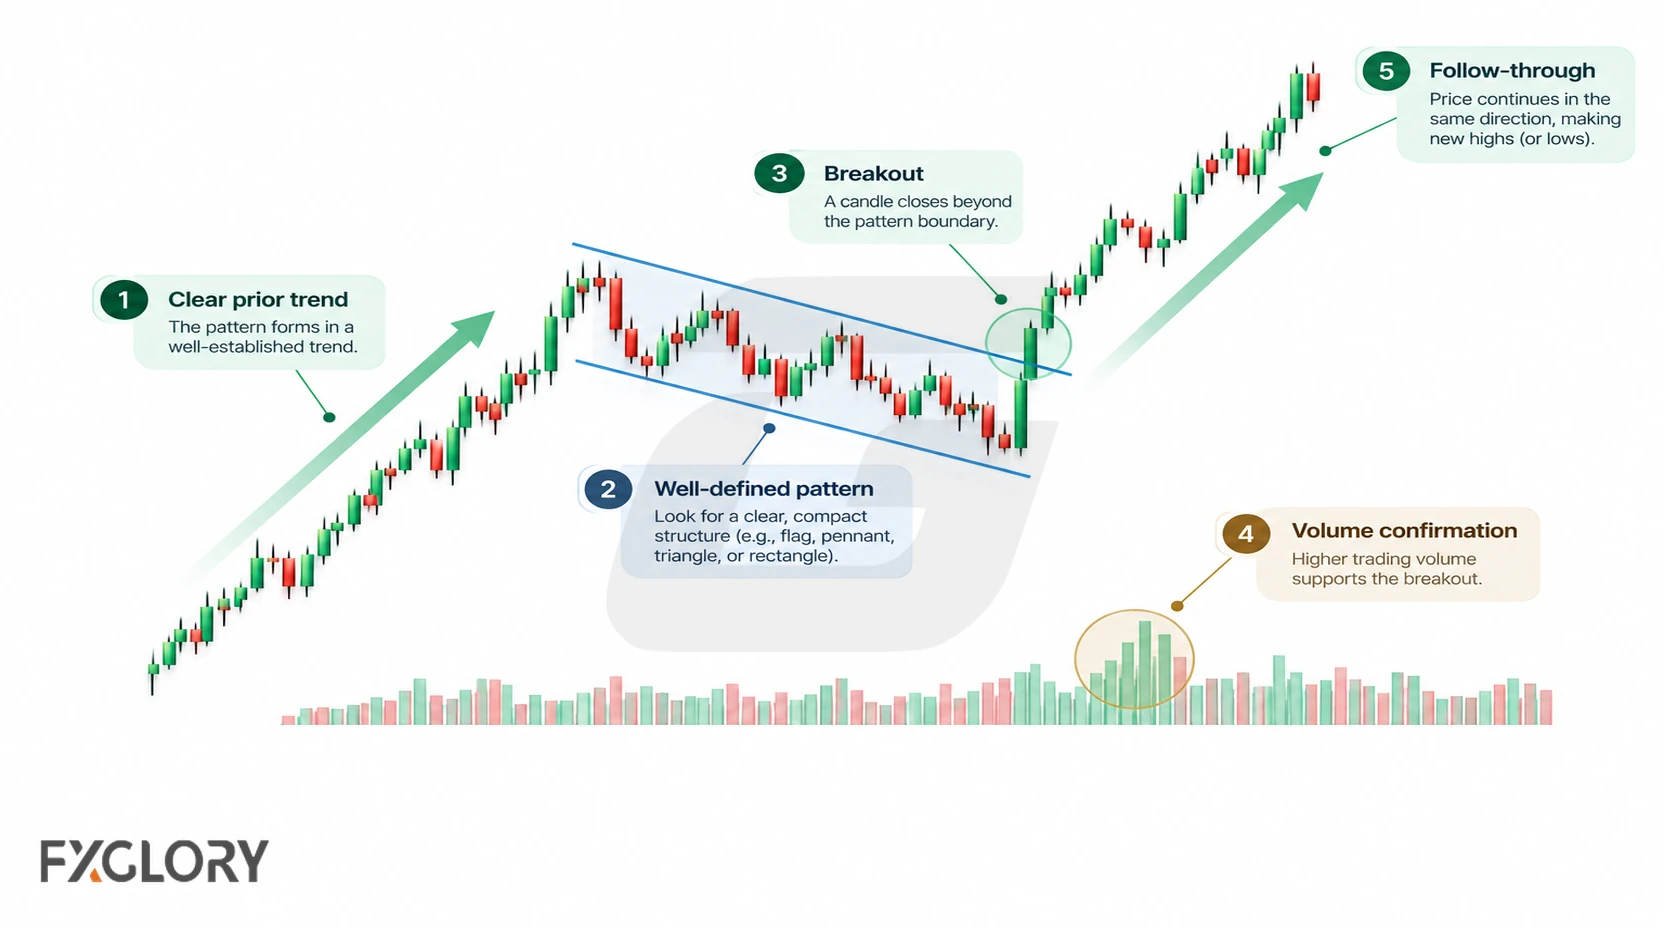
- Identify the formation: Check the prior move, type of consolidation, and relevant boundary without forcing the drawing.
- Observe the initial breakout: Price crosses a boundary in the prior trend direction. That event alone is not proof of sustained continuation.
- Evaluate further evidence: A close beyond the boundary, time spent outside, or follow-through may strengthen the scenario, depending on the method.
- Assess an optional retest: Price may return to the broken boundary. A brief return and a sustained move back inside are not equivalent.
- Consider trading separately: Review higher-timeframe levels, volatility, execution costs, and risk before deciding whether to act.
The breakout criteria should be specified before evaluating a signal. Different patterns and timeframes may require different evidence; a retest is never mandatory.
Invalidation: When the Continuation Idea Fails
Structural identification, a continuation breakout, and trade-risk limits are different questions. A recognizable pattern can remain inside its boundaries without being invalidated; continuation is simply unconfirmed.
- Failed breakout: Price crosses in the expected direction but then sustains a return inside the formation or violates a predefined holding condition. A brief retest alone need not signal failure.
- Opposite-direction break: A sustained break against the previous trend undermines the anticipated continuation but does not mean the earlier pause never existed.
- Structural deterioration: Consolidation widens or changes enough that the original pattern classification no longer fits.
- Contextual obstacles: Higher-timeframe levels, major news, and liquidity changes may weaken a trade case without automatically invalidating the chart structure.
Measured projections can organize possible scenarios, but the distance and reference level must be stated, and no projected target is guaranteed. A trader should independently define a stop or cancellation condition, position size, execution costs, and acceptable loss.
When a Pattern Is Not Really a Continuation Pattern
Some patterns look like continuation structures at first, but the market context does not support that reading. A continuation label should not be forced onto every pause.
| Situation | Why It Weakens Continuation | Better Reading |
|---|---|---|
| No prior trend | There is no clear movement for price to continue | Range or neutral structure |
| Messy consolidation | The pause is too wide, volatile, or unclear | Unclear market condition |
| Strong opposite break | The expected continuation fails after a recognizable pause | Failed continuation, potentially followed by a reversal scenario |
| Repeated false breaks | The market keeps trapping breakout attempts | Range, liquidity sweep, or unstable structure |
| Higher-timeframe conflict | A major level may impede follow-through | Context conflict, not necessarily an incorrect pattern label |
| News volatility | Price behavior is driven by fast event movement | Wait for structure to rebuild |
When a pattern starts behaving like a failed trend idea, compare it with reversal-pattern context instead of forcing a continuation label.
Forex Context: Sessions, News, Spread, Slippage, and Volume
Forex continuation patterns should be read with market conditions because currency pairs trade across global sessions. A structure may look clean in a quiet period but behave differently during a session overlap, economic release, or fast volatility shift.
- Session behavior: Breakout attempts during active sessions may behave differently from moves during thin liquidity.
- News events: Economic releases and central-bank comments can overpower a technical pause quickly.
- Spread and slippage: Fast movement around breakouts or retests can affect execution and risk.
- Pair behavior: Different currency pairs may react differently around trend pauses and key levels.
- Timeframes: A lower-timeframe continuation pattern can conflict with a higher-timeframe support or resistance area.
- Volume limits: Spot forex does not have one centralized exchange volume figure, so volume-style readings need careful interpretation.
Some traders use tick activity as one supporting clue rather than a complete market-volume answer. When volume-style context matters, tick-volume reading in forex should stay secondary to structure, confirmation, and risk.
Using Indicators and Candles With Continuation Patterns
Indicators and candlestick reactions can support continuation-pattern analysis, but they should not replace price structure. First identify the prior trend, pause, and boundary. Use indicators to evaluate subsequent breakout behavior, not to define whether the formation exists.
| Tool Type | What It Can Help Read | Careful Use |
|---|---|---|
| Trend indicators | Whether directional pressure still exists | They may lag after the move has already changed |
| Momentum indicators | Whether pressure is strengthening or fading | Divergence or momentum shifts need context |
| Volatility indicators | Whether movement is expanding or contracting | High volatility can increase execution risk |
| Candlestick reactions | Short-term rejection or hesitation near a boundary | One candle is not the same as a full chart structure |
| Tick activity | Activity around breakouts or retests | It is supporting context, not centralized market volume |
When momentum, trend strength, or volatility needs extra context, technical indicators for chart confirmation can help organize the reading. When the question is how much price is moving during a pause or breakout, ATR-based volatility context may be useful. When candle reaction matters near the boundary, candlestick behavior around key areas can add short-term detail.
Example: Reading a Continuation Pattern on EUR/CHF
Consider a hypothetical EUR/CHF advance from 0.9400 to 0.9500, a 100-pip upward move. Price then trades between 0.9470 and 0.9500, forming a 30-pip horizontal consolidation after the rise. With this prior move and bounded pause, a trader could describe a possible bullish rectangle continuation structure before any breakout.
Suppose price next trades at 0.9505, five pips above the upper boundary. That is an initial upside break, not proof of sustained continuation. A subsequent close and holding behavior above 0.9500 could strengthen the scenario. A brief retest of that level is optional; a sustained return inside the rectangle would weaken a breakout thesis. Price breaking below 0.9470 would raise a different question about the anticipated direction, not erase the historical consolidation.
The 100-pip initial move and 30-pip consolidation are measurements, not tested forecasts. This example does not assign a probability of success, a stop distance, or a guaranteed target; those require a separately specified methodology and trade plan.
Common Mistakes With Forex Continuation Patterns
Continuation-pattern mistakes often happen when traders see a pause and assume the trend must resume.
- Ignoring the prior trend: The trader labels a pattern as continuation even though the earlier move is unclear.
- Entering before confirmation: The trader reacts to a shape before price breaks, rejects, retests, or holds.
- Forcing a pattern name: A messy range is treated as a clean flag, pennant, triangle, or wedge.
- Ignoring false breakouts: Price leaves the structure briefly and then returns inside.
- Missing higher-timeframe context: A small continuation pattern pushes into a larger support or resistance area.
- Overusing volume assumptions: Volume-style clues are treated as if spot forex had one centralized exchange volume figure.
- No trade cancellation rule: A trader recognizes a real formation but enters without deciding what would invalidate that trade setup.
- Ignoring execution risk: Spread, slippage, fast volatility, and position size are left out of the plan.
Beginner Workflow for Forex Continuation Patterns
A clear process helps keep continuation patterns from becoming guesswork.
- Identify context: Mark the prior trend and describe the pause without assuming it will continue.
- Classify the structure: Use its boundaries to distinguish a flag, pennant, rectangle, triangle, wedge, or channel; avoid forcing a label.
- Separate the stages: Record when the structure is recognizable and what would constitute an initial breakout.
- Review the breakout: Evaluate closing behavior, follow-through, and any optional retest under your chosen criteria.
- Plan a trade separately: Consider sessions, news, costs, higher-timeframe context, cancellation conditions, and position risk.
- Review the result: Distinguish a correctly identified pattern from an unsuccessful continuation trade.
This process keeps the focus on market structure instead of treating continuation patterns as automatic entries.
A Safer Way to Read Continuation Patterns
Forex continuation patterns help traders organize pauses inside existing trends. They can make chart structure easier to describe, but they do not remove uncertainty from trading.
A recognizable structure starts with a clear prior trend, a distinct pause, and observable boundaries. Breakout evidence determines whether continuation becomes more plausible; risk limits determine whether an individual trader can responsibly act on that scenario.
Trend pauses are useful only when they are read with context. Session behavior, news, spread, slippage, volatility, timeframe alignment, pair behavior, position size, and account risk still matter.