
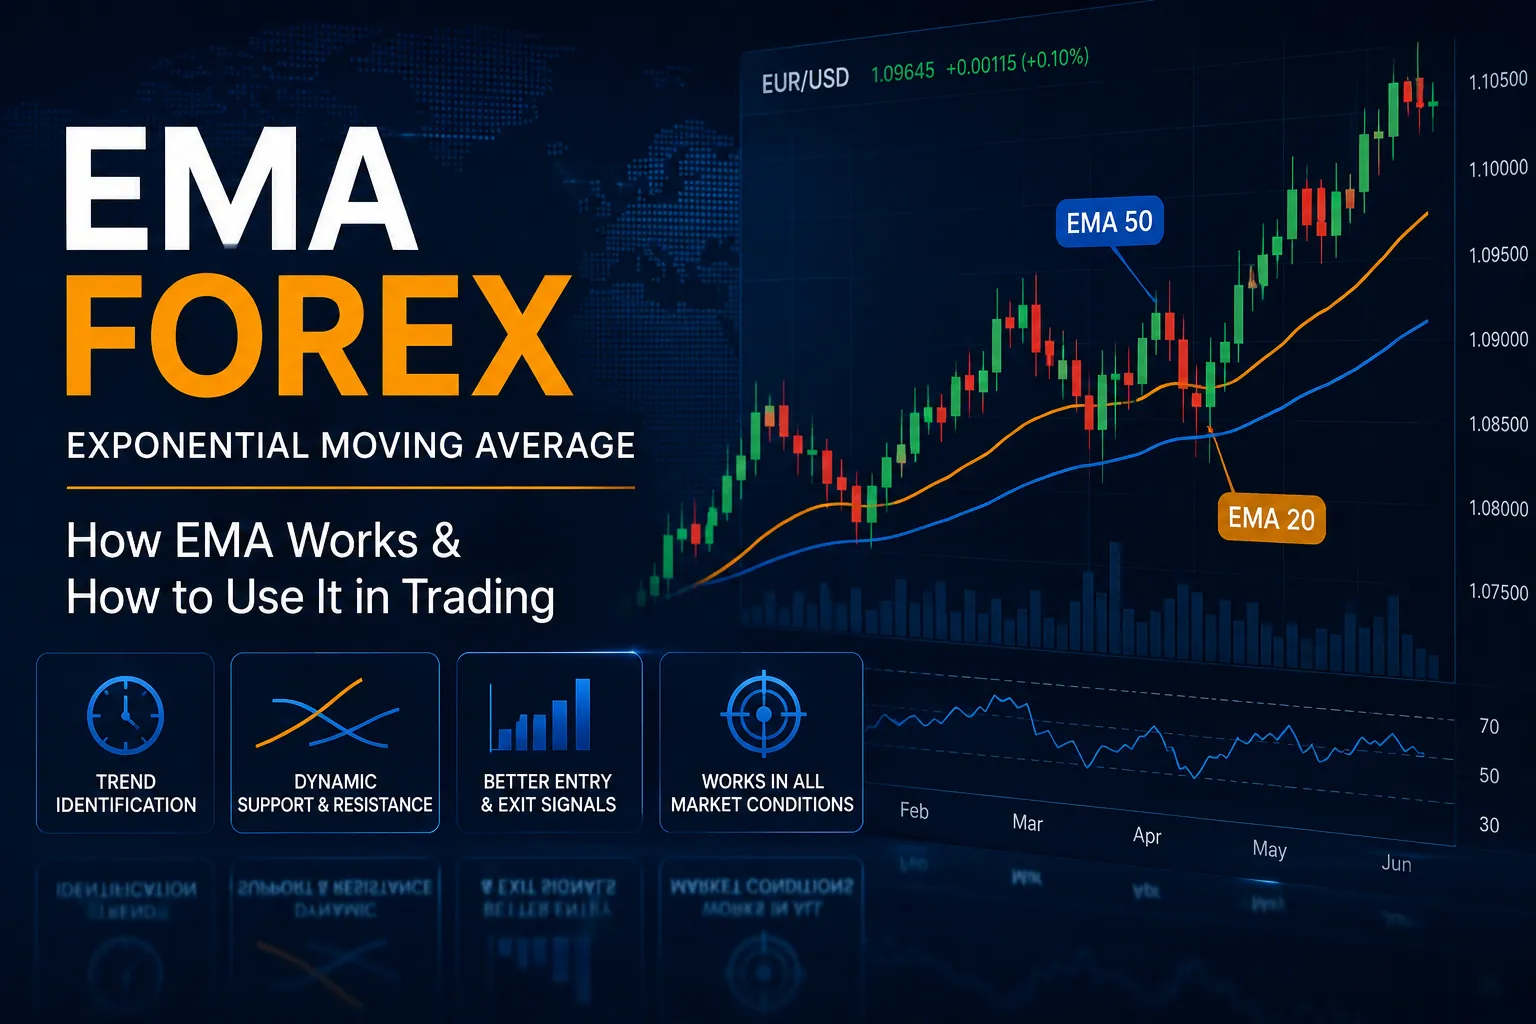
What Is EMA in Forex?
The exponential moving average is one of the most widely used indicators in forex trading. Unlike a simple moving average, which gives equal weight to every price in the period, the EMA applies a multiplier that gives more influence to the most recent prices. This makes it more responsive to current market conditions while still smoothing out short-term noise.
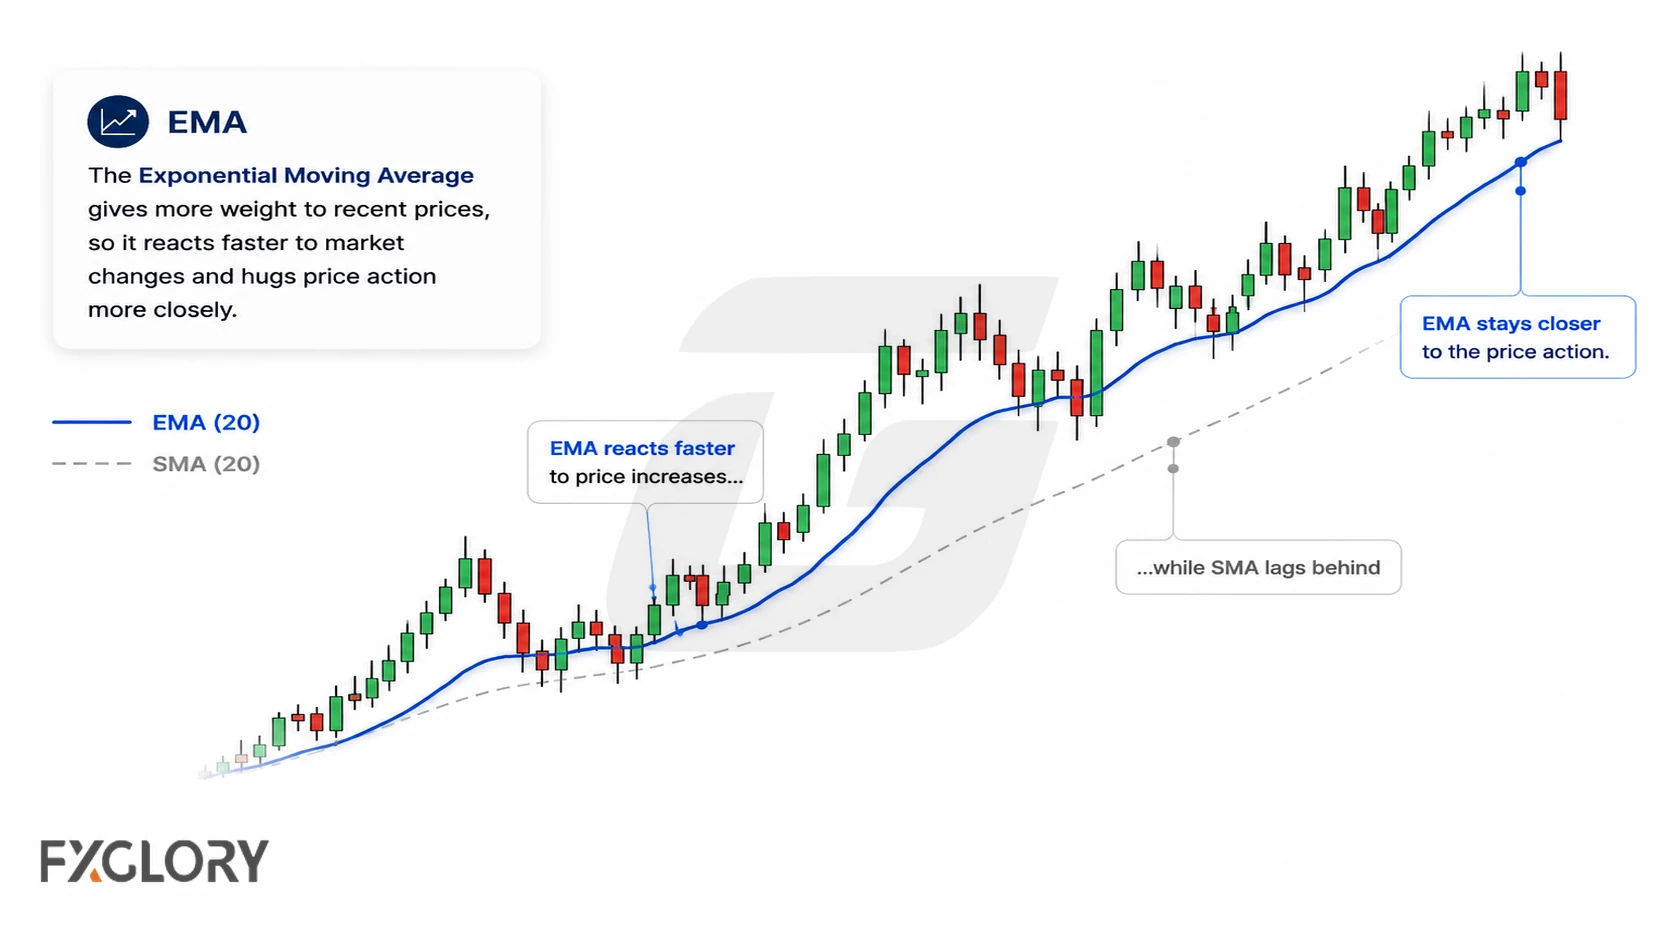
Traders use EMA in forex for several purposes: to describe trend direction, compare current price with a weighted average, watch pullbacks toward the line, and evaluate how price behaves around the EMA alongside known structure. Some strategies also use EMA position or crossovers as filters or signals, but those rules come from the strategy rather than from the EMA itself.
For the broader moving average category, including SMA and WMA comparisons, use forex moving average.
EMA vs SMA: Key Difference
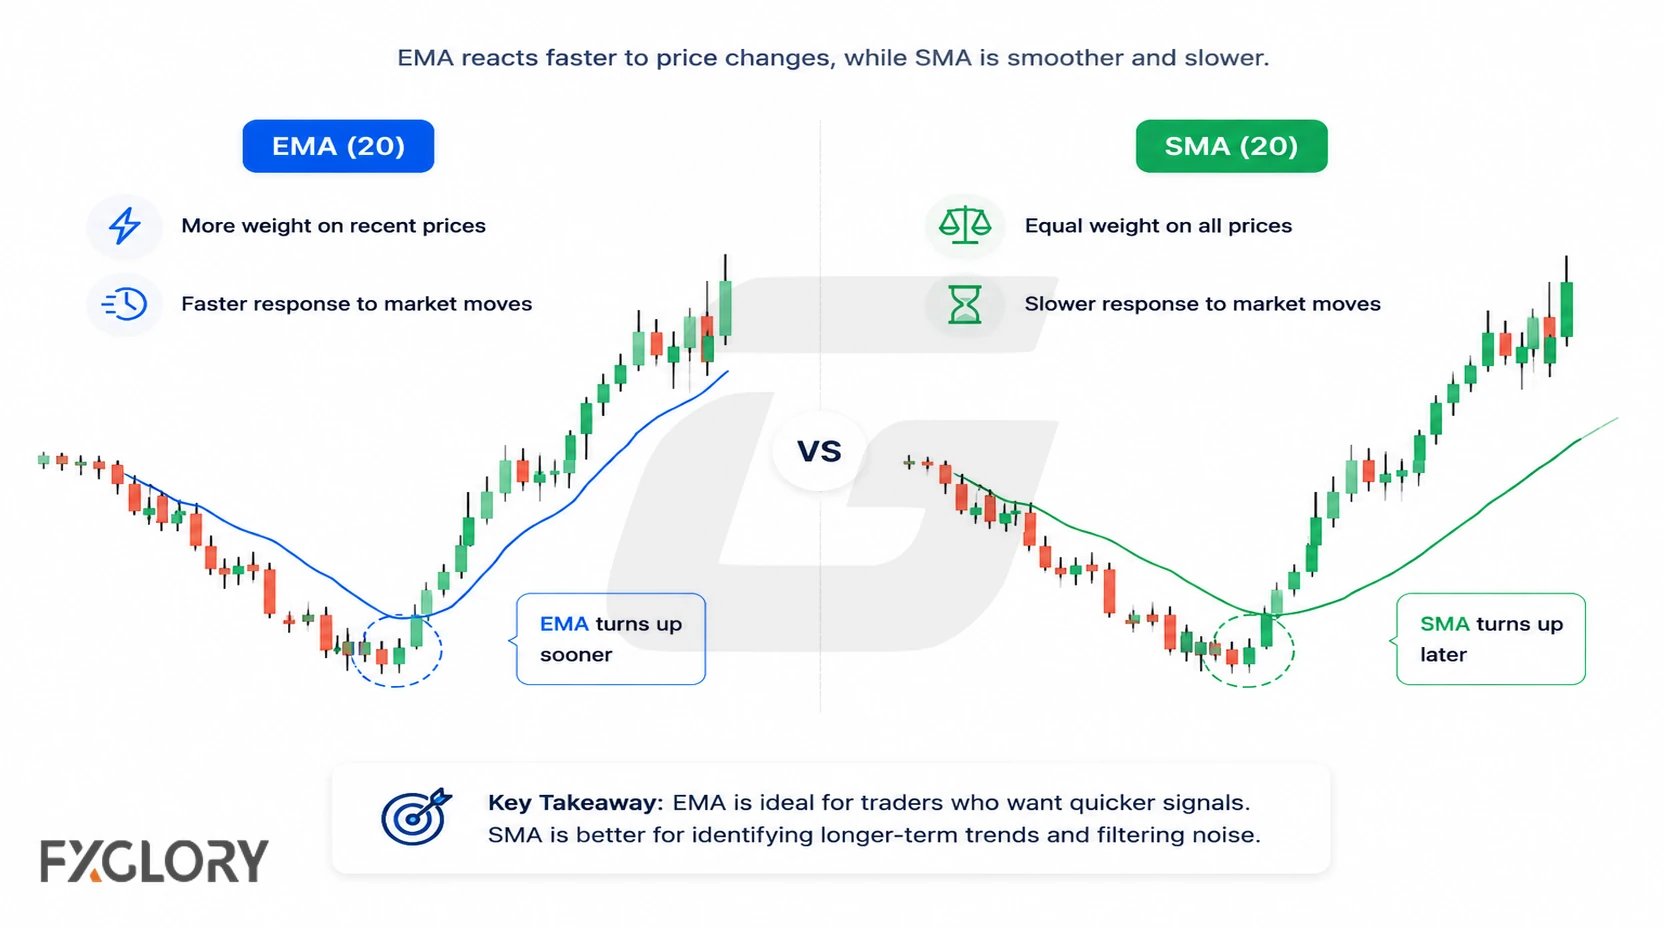
The most important distinction between EMA and SMA is how each indicator reacts to new price data. Both calculate a moving average, but the weighting method is different.
| Feature | EMA | SMA |
|---|---|---|
| Weighting | More weight given to recent prices | Equal weight given to all prices in the period |
| Reaction speed | Faster — responds more quickly to price changes | Slower — changes more gradually |
| Noise | Less smoothing; can react to short-term fluctuations | More smoothing; slower to reflect recent movement |
| Lag | Less lag than SMA for the same period | More lag; slower to confirm a new trend |
| Common use | Trend filter, dynamic reference, pullback zone, crossover signal | Longer-term trend direction, baseline reference |
| False signals in choppy markets | More potential false signals due to faster reaction | Fewer false signals in choppy markets, but later confirmation in trending markets |
How EMA Is Calculated
EMA is calculated recursively using a smoothing multiplier, the current selected price input, and the previous EMA value. The multiplier is determined by the chosen period.
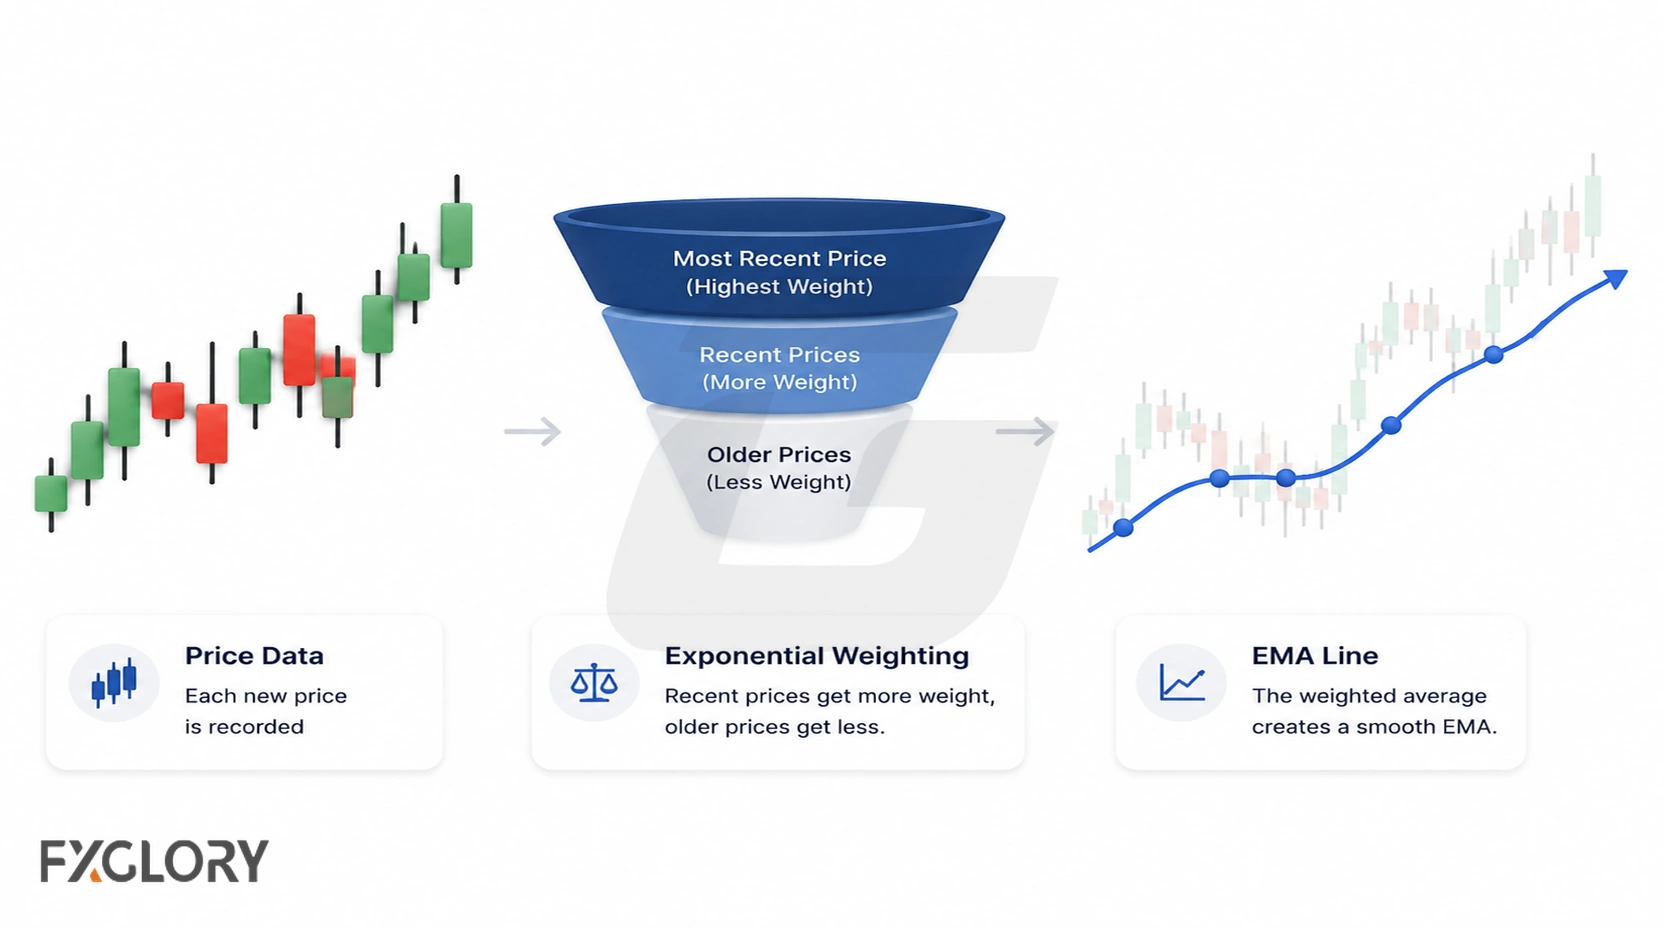
The smoothing multiplier is 2 divided by (number of periods + 1). For EMA(20), the multiplier is 2 divided by 21, or approximately 0.0952. For EMA(10), it is 2 divided by 11, or approximately 0.1818. A shorter period produces a larger multiplier, so the newest input receives more weight and the EMA responds faster.
For each new bar, the EMA can be expressed as: (Current Price Input multiplied by Multiplier) + (Previous EMA multiplied by (1 minus Multiplier)). The price input depends on the platform and settings; close is common, but other supported inputs may be available. Charting platforms handle the calculation automatically. The key point is that shorter-period EMAs respond faster because the newest observation receives more weight, while longer-period EMAs change more slowly.
Common EMA Periods in Forex
There is no single standard set of EMA periods for forex trading. The periods below are commonly referenced, but their usefulness depends on the timeframe, strategy, and market condition. Using a period only because it is widely mentioned does not mean it will work as a reference in every situation.
| EMA Period | Common Role | Typical Context |
|---|---|---|
| EMA(9) | Short-term trend reference | Used on lower timeframes or for faster signal generation; more noise in choppy markets |
| EMA(20) or EMA(21) | Short-to-medium trend filter | Widely referenced on 1H and 4H charts as a dynamic reference zone for pullbacks |
| EMA(50) | Medium-term trend context | Used to define broader intraday or swing direction; commonly paired with EMA(20) in crossover studies |
| EMA(100) | Longer-term trend reference | Less sensitive to short-term fluctuations; used to define the direction of larger moves |
| EMA(200) | Long-term trend orientation | Widely referenced as a major directional filter on daily and 4H charts; slow to change direction |
EMA Settings by Timeframe
EMA behavior changes with the timeframe. The same period on a 5-minute chart and a daily chart represents very different time spans. Traders often choose EMA periods based on the timeframe they use and the purpose of the indicator in their plan.
EMA Settings for Scalping and Short Timeframes
On very short timeframes, EMA periods are typically smaller because each bar covers a short time window. Smaller EMA periods react faster but produce more noise in sideways conditions.
| Timeframe | Commonly Studied EMA Periods | Typical Role | Main Risk |
|---|---|---|---|
| 1M | EMA(9), EMA(21) | Short-term direction filter; entry-level reference | Very noisy; frequent crossings with low directional meaning |
| 5M | EMA(9), EMA(21), EMA(50) | Short-term trend filter; scalping direction check | Spread and slippage can reduce usefulness at small targets |
| 15M | EMA(21), EMA(50), EMA(200) | Intraday direction; support and resistance zone reference | Conflicting signals when a higher-timeframe trend is not checked first |
EMA Settings for 1 Hour Charts
| EMA Period On 1H | Common Role | Typical Use |
|---|---|---|
| EMA(20) or EMA(21) | Short-term trend reference and pullback zone | Looking for pullbacks to the EMA area in trending conditions before seeking confirmation |
| EMA(50) | Medium-term directional filter | Checking whether price is above or below EMA(50) to define intraday bias |
| EMA(200) | Long-term reference on 1H | Large-scale directional orientation; not typically used as an intraday entry signal |
EMA Settings for 4H and Daily Charts
On slower timeframes, EMA periods represent longer time spans and the lines change direction more slowly. These are typically used for broader trend context rather than entry timing.
| Timeframe | Commonly Studied EMA Periods | Typical Role |
|---|---|---|
| 4H | EMA(21), EMA(50), EMA(200) | Trend direction, major pullback reference zones, swing context |
| Daily | EMA(50), EMA(100), EMA(200) | Long-term trend orientation; widely watched levels across market participants |
| Weekly | EMA(20), EMA(50) | Macro trend direction; rarely used directly for short-term entry timing |
How Traders Use EMA
EMA has several common applications in forex trading. The line itself is simply a calculated moving average; any entry, exit, crossover, touch, or filter rule comes from the strategy built around it.
| Use Case | How It Works | Rule To Define | Risk |
|---|---|---|---|
| Trend direction filter | Use EMA slope and price position to define which trade directions a strategy will consider | Which EMA period, which timeframe, and what counts as a rising or falling EMA | EMA can flatten in ranging markets and give a false directional reading |
| Dynamic support and resistance | Watch how price behaves around the EMA and use that behavior, together with structure, to evaluate a possible dynamic reaction area | Define whether a reaction means a candle close, a wick, or a specific pattern near the EMA | Price can pass through an EMA repeatedly without a meaningful reaction |
| Pullback zone identification | In a trending condition, wait for price to pull back toward the EMA area before looking for confirmation | What counts as a completed pullback and what confirmation is required before entry | Pullbacks to EMA can continue into a reversal rather than resuming the trend |
| Crossover signal | Watch for a faster EMA to cross a slower EMA as a potential directional shift reference | Which two periods, and whether additional confirmation is required before acting | Crossovers can be late in trending markets and frequent in choppy markets |
| Higher-timeframe context | Use EMA on a higher timeframe to define the broader direction before reviewing entries on a lower timeframe | Which timeframe provides context and which provides the entry setup | Higher-timeframe EMA can conflict with lower-timeframe setup if not checked first |
For rule-based approaches built around EMA as the main filter, use moving average forex strategy.
EMA Crossovers in Forex
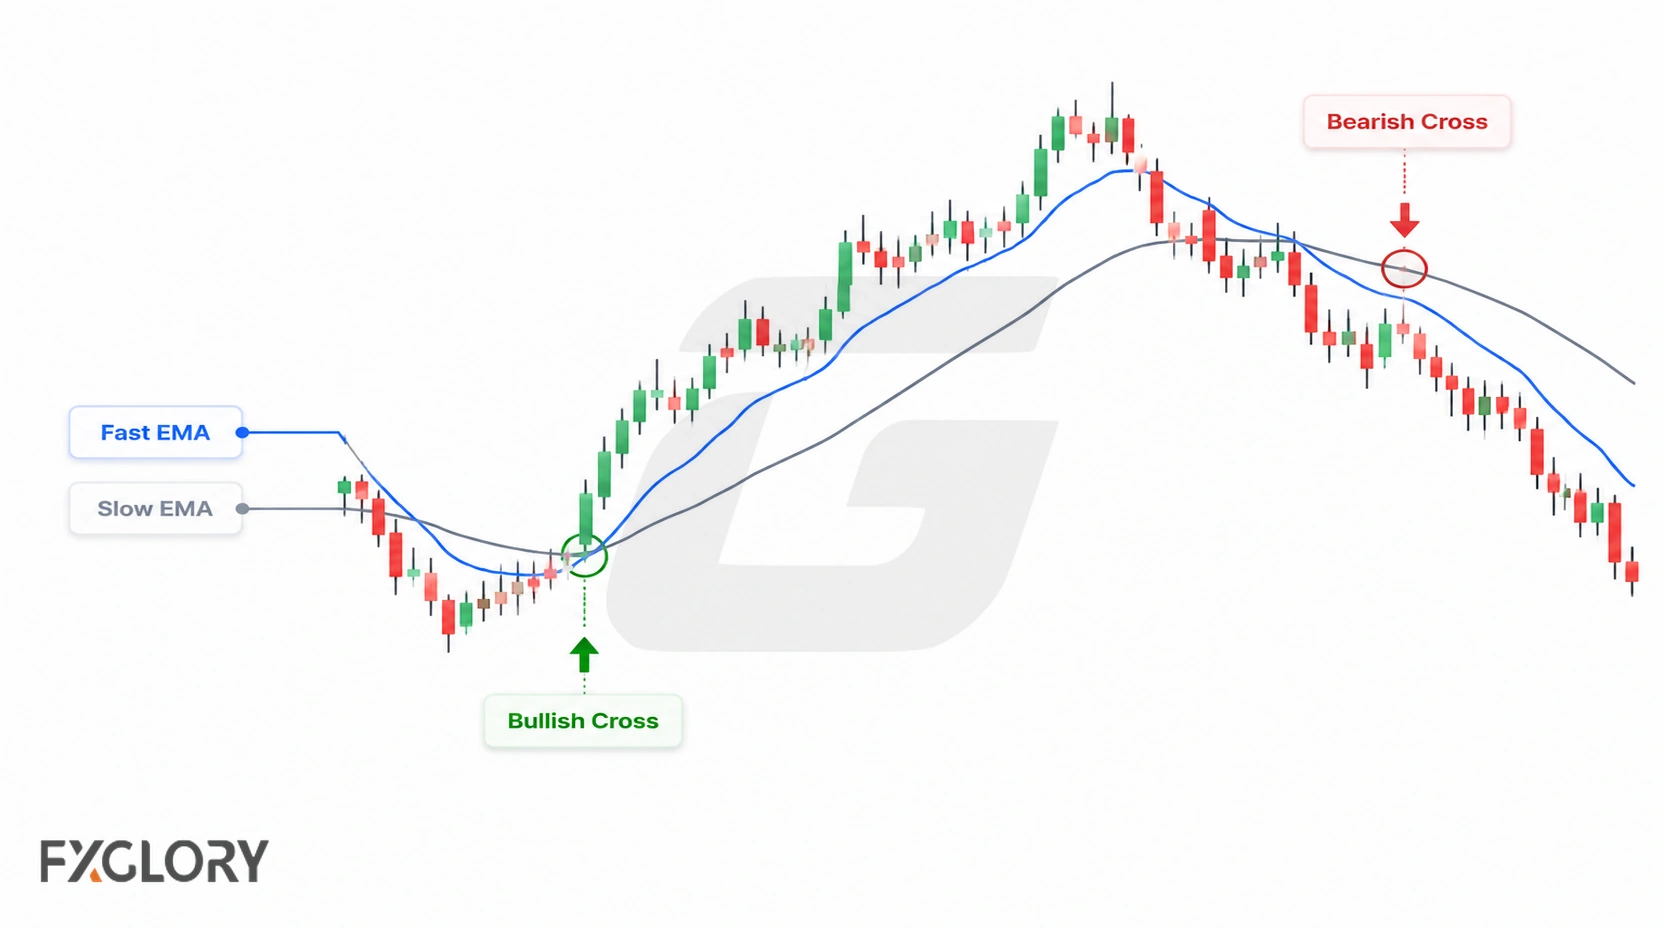
An EMA crossover is the point where a faster (shorter period) EMA crosses above or below a slower (longer period) EMA. Crossovers are one of the most discussed EMA applications in forex trading, but they are also among the most commonly misused.
| Crossover Type | What It Shows | Common Interpretation | Main Weakness |
|---|---|---|---|
| Fast EMA crosses above slow EMA | The shorter-term average has risen above the longer-term average | Sometimes described as a potential bullish directional shift | Can be late in a trending market; can produce false signals in a range |
| Fast EMA crosses below slow EMA | The shorter-term average has dropped below the longer-term average | Sometimes described as a potential bearish directional shift | Same weakness; may signal well after the actual move begins |
| Repeated crossings in a range | The two EMAs cross back and forth without directional follow-through | Often indicates a choppy or ranging condition | Can produce a series of false entries if the trader acts on every cross |
For crossover-specific rule models, use forex moving average crossover strategy.
EMA With Price Action and Support-Resistance
One common approach is to use the EMA line as a dynamic reference and then evaluate price action around it. The EMA itself is not a support or resistance zone; traders infer potential dynamic support or resistance from repeated price behavior around the line and the surrounding structure.
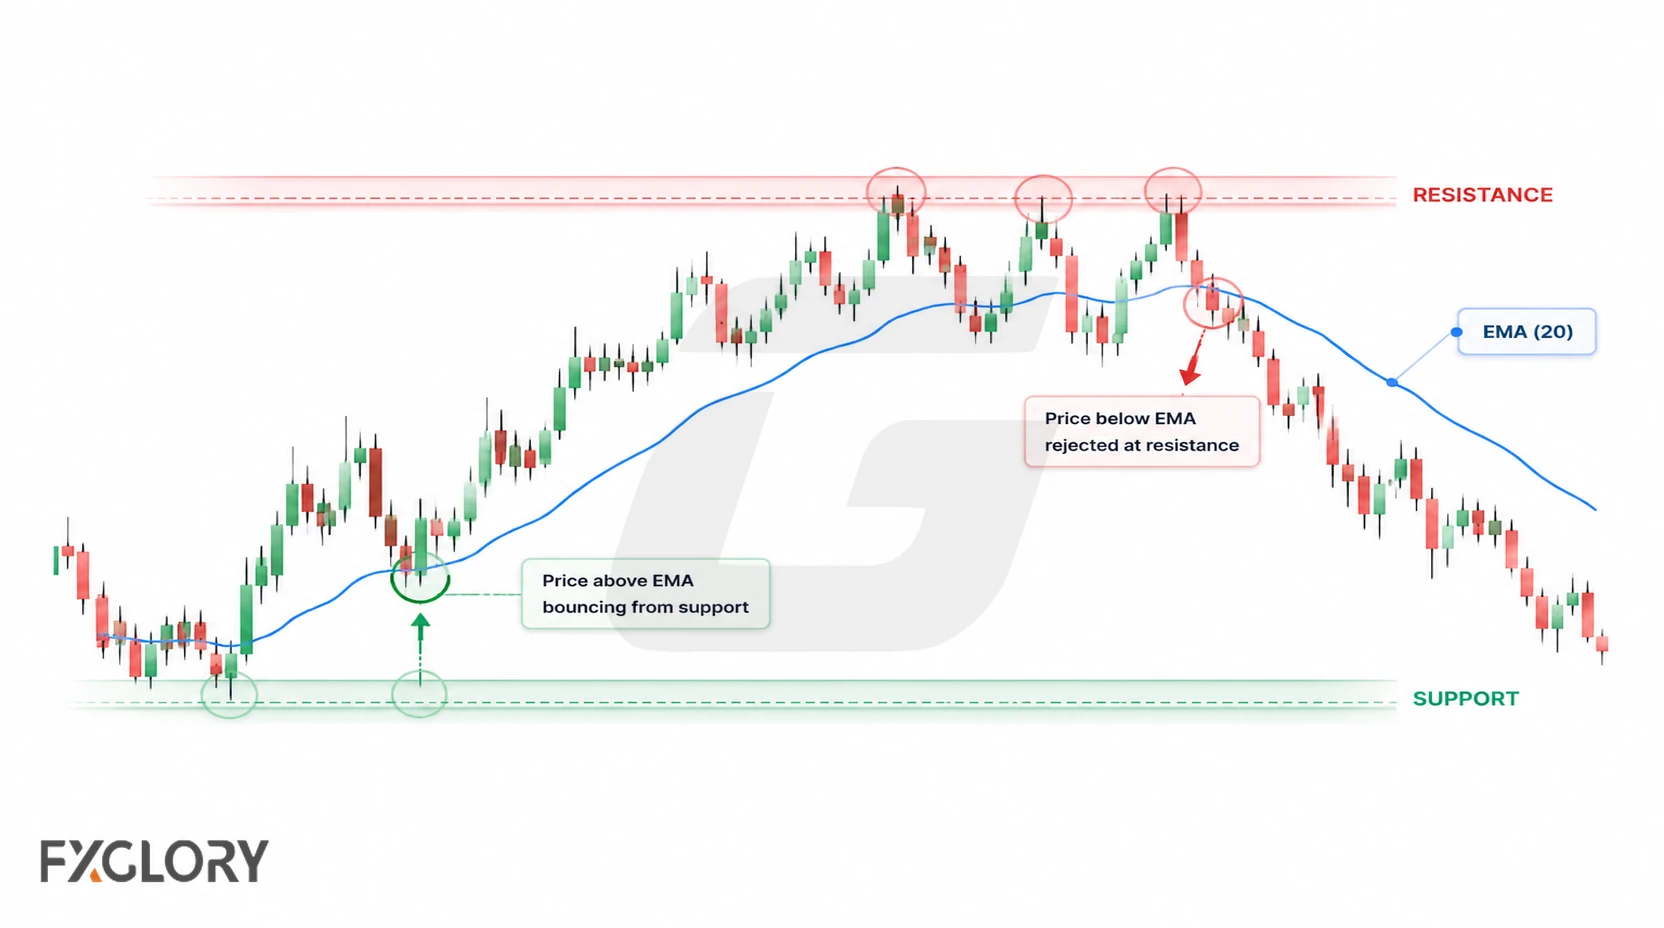
- Potential dynamic support: In an uptrend, a strategy may watch how price reacts around a rising EMA. A reaction can add context to a pullback setup, but the EMA line is not inherently support and may be crossed without consequence.
- Potential dynamic resistance: In a downtrend, a strategy may watch whether rallies stall around a falling EMA. That behavior can support a bearish trend interpretation, but the EMA line is not inherently resistance.
- EMA and range conditions: In a ranging market, EMA lines often flatten and price crosses them repeatedly. In this condition, EMA is less useful as a directional filter and should not be treated as meaningful support or resistance.
- EMA and price structure: EMA-based entries are stronger when the EMA zone coincides with a known price structure level such as a prior swing, a range boundary, or a breakout area. EMA alone without supporting structure is a weaker basis for an entry decision.
Is EMA Reliable? Limits and Risks
EMA can be a useful analytical reference, but its limitations matter because every reading is derived from current and past price data rather than future information.
- EMA is a lagging indicator: It calculates from past prices, so it always reflects what already happened, not what will happen next.
- EMA-based rules can struggle in sideways markets: When price is ranging or choppy, the EMA may flatten and price can cross it repeatedly. Strategies that interpret each crossover, touch, or price-position change as a signal can therefore generate frequent low-quality or losing signals.
- EMA does not define stop placement: The EMA line position is not a logically correct stop level. A stop placed only at the EMA rather than at a price structure level is arbitrary.
- EMA period selection is subjective: Any EMA period can be fitted to past data to appear useful. Past chart performance does not mean the same period will work the same way in the future.
- EMA recalculates on live bars: On an incomplete bar, EMA recalculates in real time. A reading on an open bar can look different after the bar closes.
- EMA does not account for news or fundamental context: Major news events can move price through EMA levels rapidly. EMA provides no warning of these events.
- Multiple EMAs add complexity without removing uncertainty: Adding more EMA lines creates more possible signals but does not make the underlying market more predictable.
For a broader review of indicator limitations, use non-repainting forex indicators and best indicators for forex.
EMA for Beginners
EMA is often one of the first indicators applied by traders new to forex because it is straightforward to add to a chart. However, ease of application does not mean ease of use. Understanding what EMA can and cannot do is more important than knowing how to add it.
- EMA does not define a buy or sell decision by itself: It shows a weighted average of the selected price input. A strategy must specify what EMA behavior matters and what additional conditions are required before acting.
- The period you choose changes the behavior: A 9-period EMA will look very different from a 200-period EMA on the same chart. Choose the period based on what you need it to do, not what looks clean on a historical chart.
- EMA needs context: An EMA touch or crossover without market structure context, session awareness, and a defined invalidation level is not a trading setup.
- EMA works better in trending conditions than in ranges: Before applying EMA logic, identify whether the market is trending or ranging. In sideways conditions, EMA-based signals are less reliable.
- Combine EMA with price structure, not just other indicators: Stacking multiple EMAs without understanding price structure does not make the analysis more reliable. Each tool should have a specific defined role in the trading plan.
- EMA does not replace risk management: Stop placement, position sizing, leverage review, and invalidation rules are separate from the EMA and cannot be replaced by it.
For indicator planning in a strategy context, use forex indicator strategies.