

What Is a Long-Legged Doji in Forex?
A Long-Legged Doji is a single candlestick with an extremely small real body and prominent upper and lower shadows. The opening and closing prices are nearly equal, while the high and low lie well beyond the body on both sides.
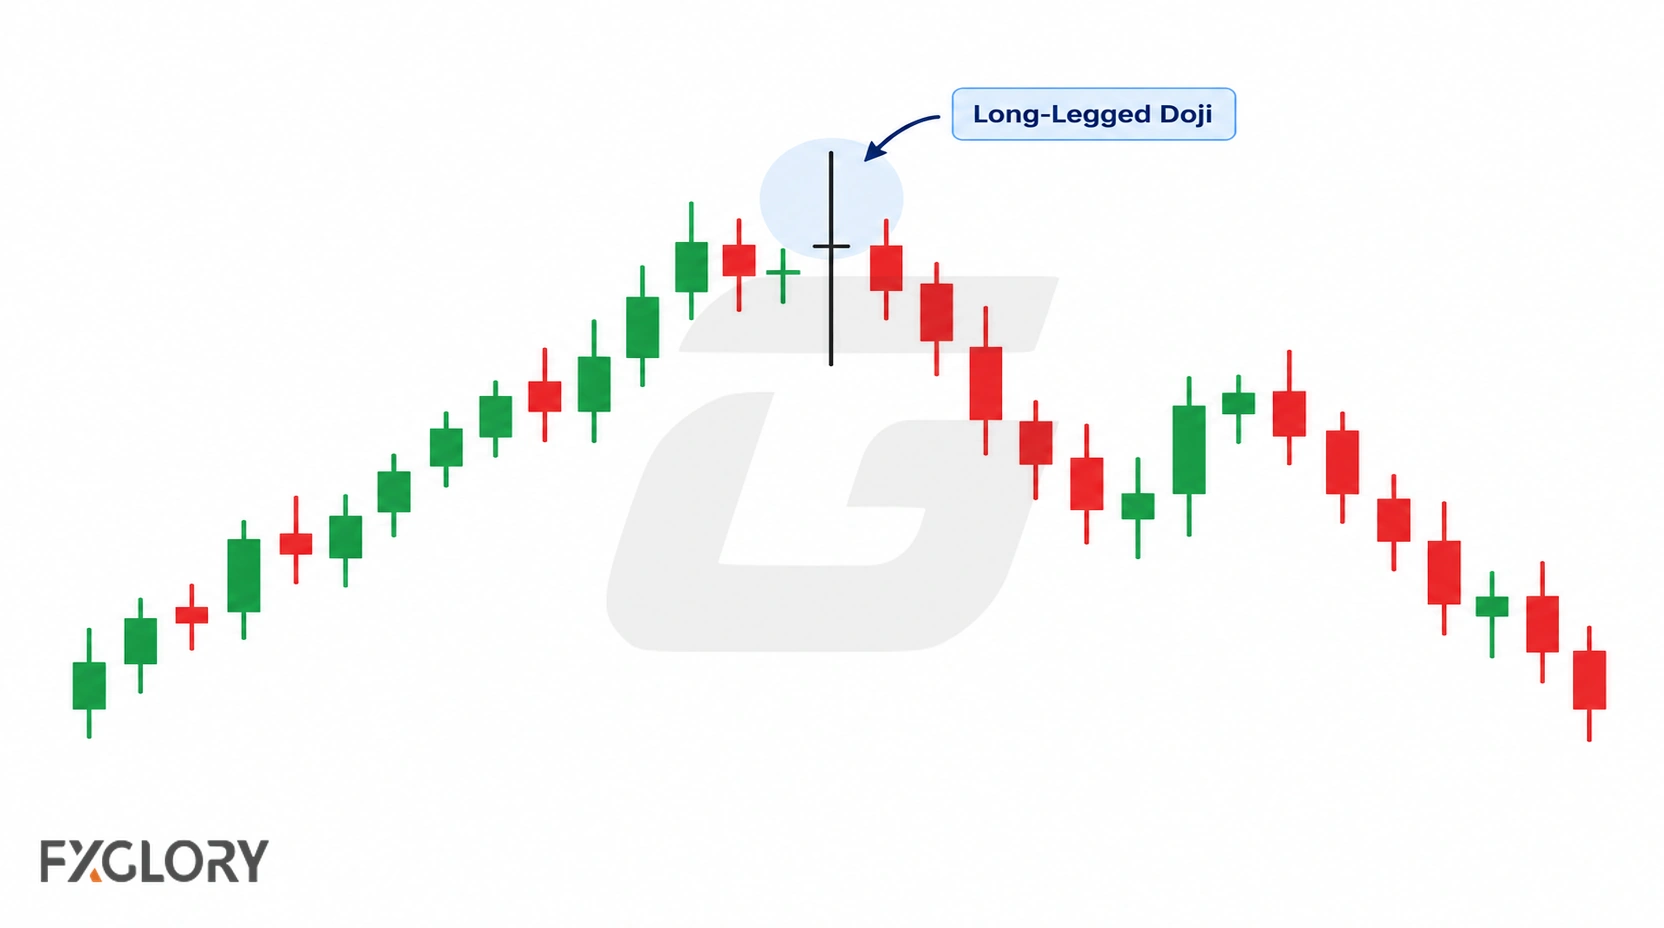
The name is also written as long legged doji. It belongs to the broader doji family; see open-close balance behind doji candles.
Its shadows show that price traded above and below the opening area during the candle and finished near its starting level. The shape does not establish who initiated those moves, the order of the high and low, or the next direction. Long shadows relative to the body do not necessarily mean unusually high volatility relative to recent candles.
Long-Legged Doji Anatomy
The key identification features are an almost absent real body and substantial shadows on both sides. There is no universally accepted body-to-range or wick-length percentage that separates a Long-Legged Doji from every other doji; compare the proportions within the candle and, when judging whether its range is unusual, against recent candles on the same timeframe.
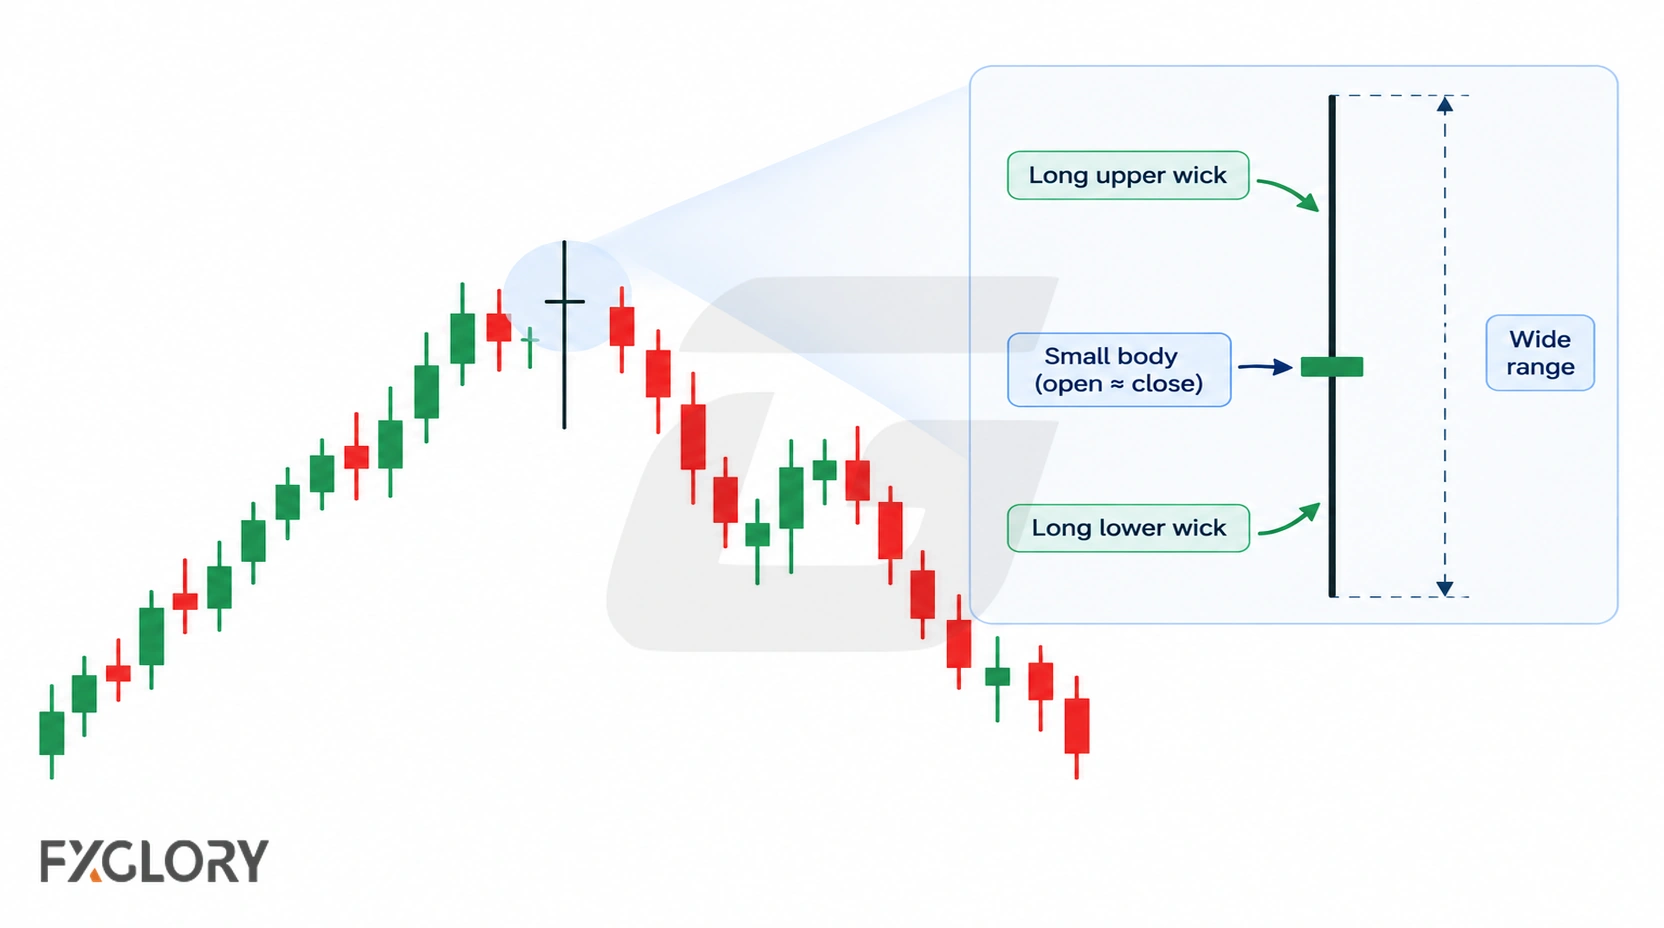
- Real body: The distance between open and close, usually very small compared with the full range.
- Upper shadow: The distance from the higher of open and close to the candle high; it records prices above the body.
- Lower shadow: The distance from the lower of open and close to the candle low; it records prices below the body.
- Full range: High minus low. It can be compared with nearby candles or ATR to assess relative movement, separately from identifying the shape.
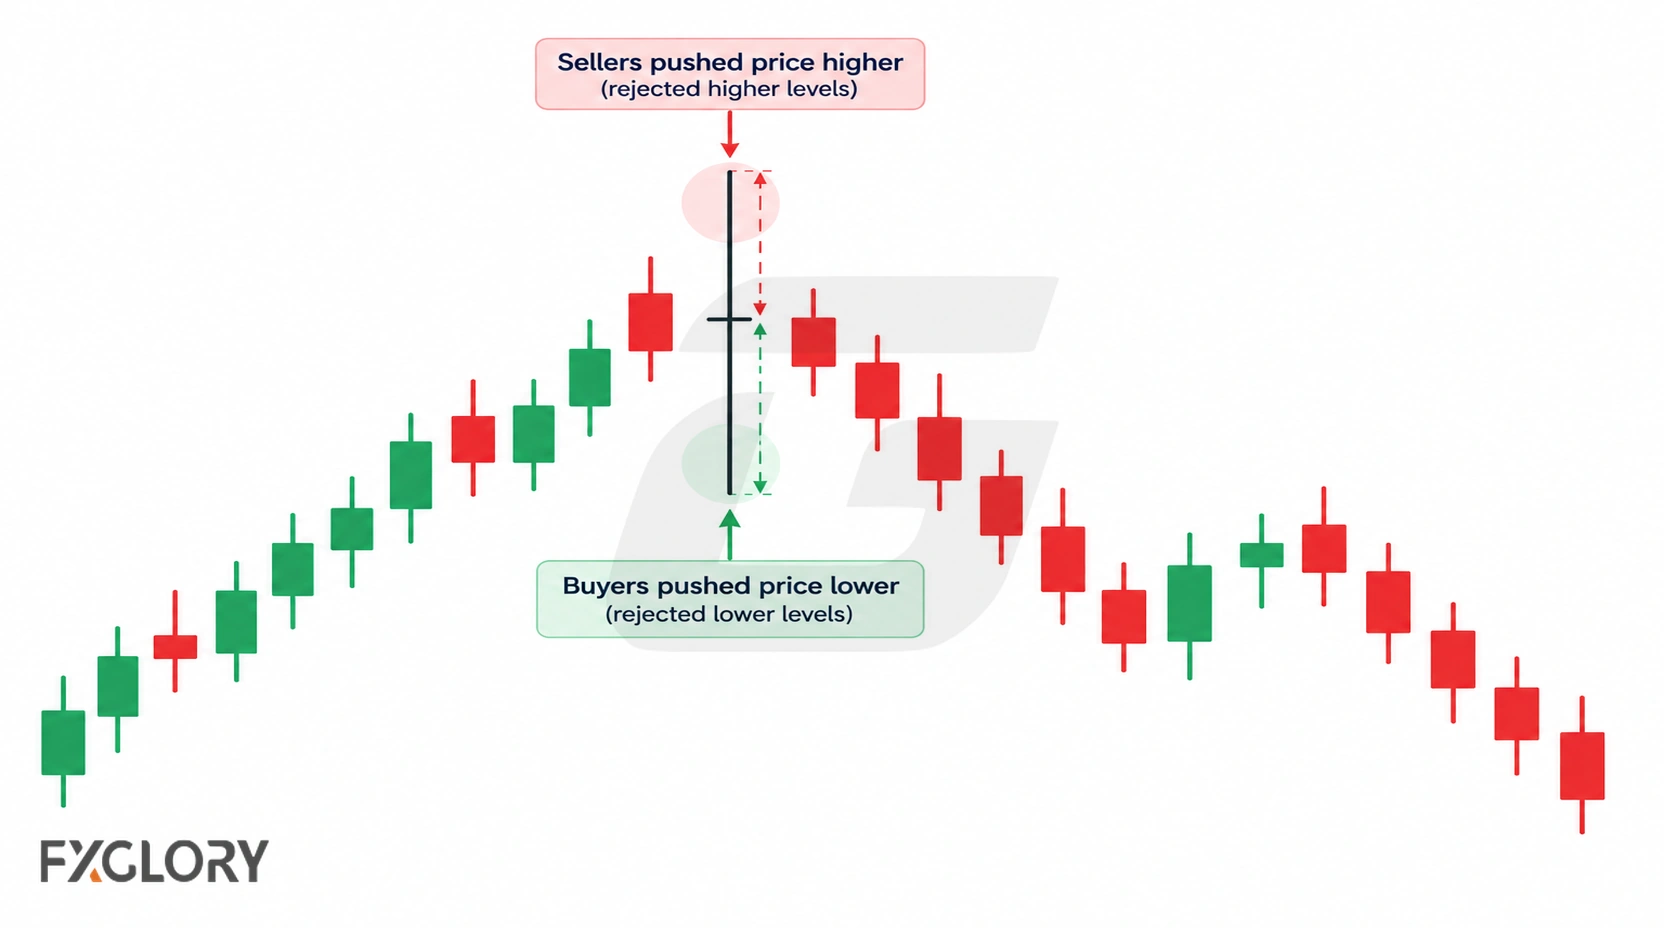
Both shadows should be visibly prominent; they need not be exactly equal. Unlike a one-sided Dragonfly or Gravestone Doji, this pattern records substantial movement on each side of the body. Its high and low can be useful reference levels, but they are not automatically support, resistance, or suitable stop locations.
Hypothetical OHLC example: If a candle opens at 1.1000, reaches 1.1030, falls to 1.0970 and closes at 1.1001, its body is 1 pip, upper shadow is 29 pips, lower shadow is 30 pips and full range is 60 pips (assuming a non-JPY forex pair where 1 pip is 0.0001). The example illustrates the proportions; it is not market data or a universal threshold.
What a Long-Legged Doji Means on a Forex Chart
A Long-Legged Doji records a near-equal open and close despite movement to both higher and lower prices. Whether that is significant depends on its position in the existing market structure rather than on an assumed struggle won by either side.
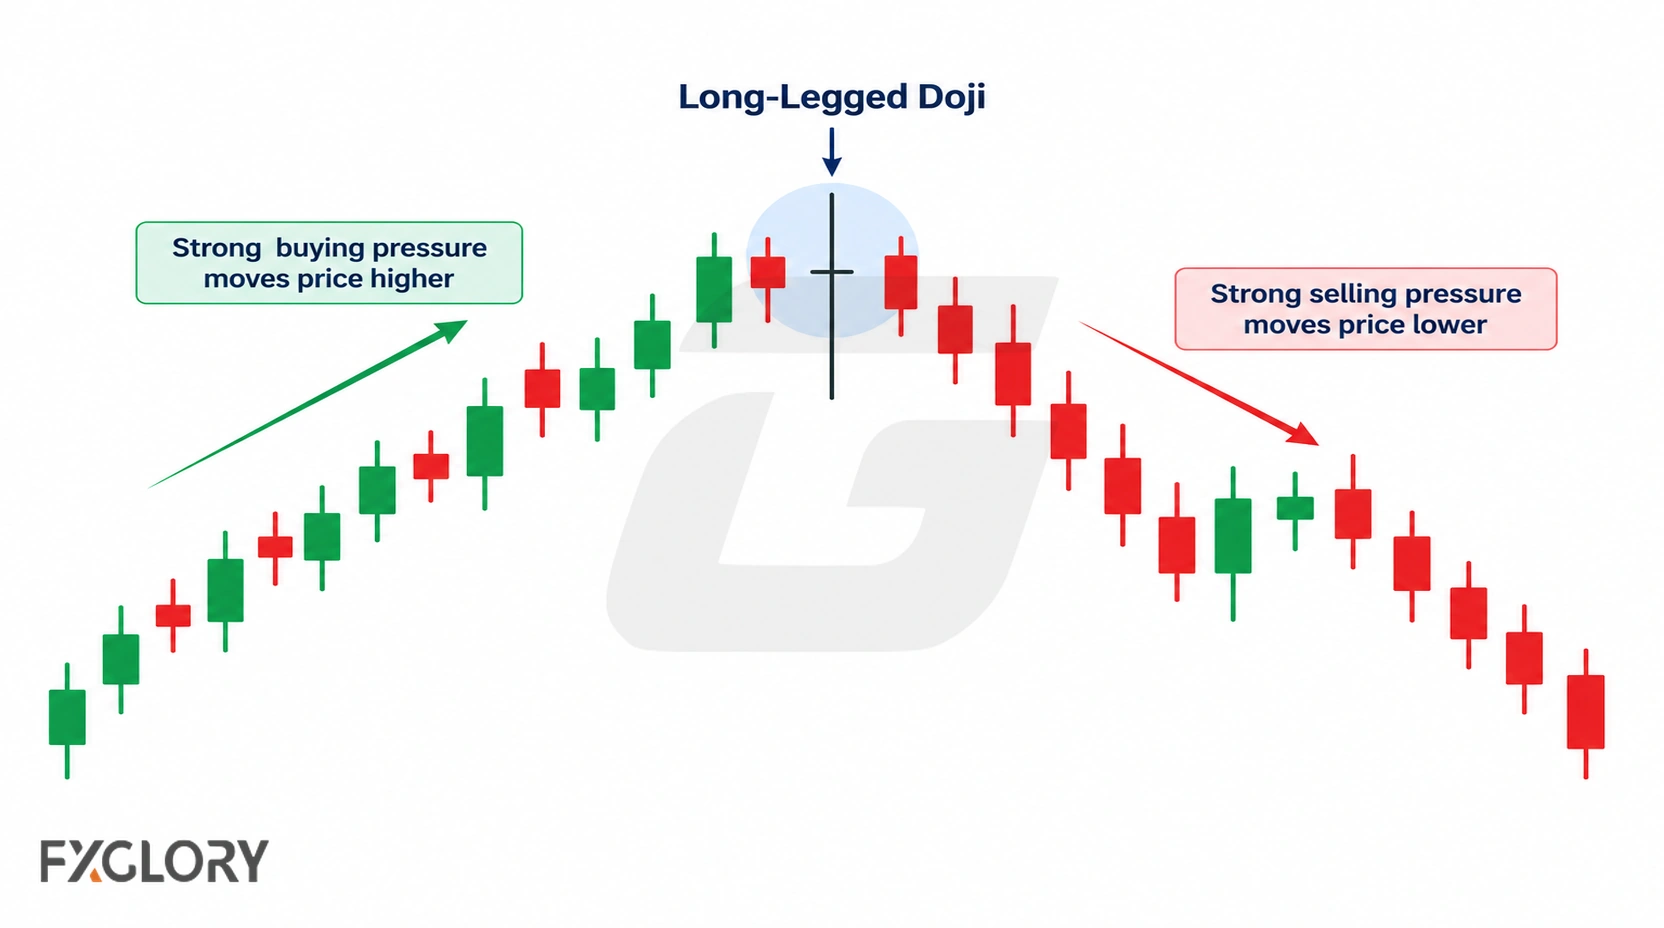
- After an advance or decline: It may be worth watching whether the existing move resumes or stalls.
- Near a tested support or resistance area: Its extremes can help frame subsequent price behaviour at that level.
- Inside an established range: It may simply be another range candle without a new directional implication.
For background on identifying relevant levels, see support and resistance in forex.
Long-Legged Doji vs Standard Doji
Both are doji candles because their open and close are nearly equal. A standard doji is the broad category; its shadow lengths can vary. A Long-Legged Doji is the variation with conspicuously long shadows above and below the small body.
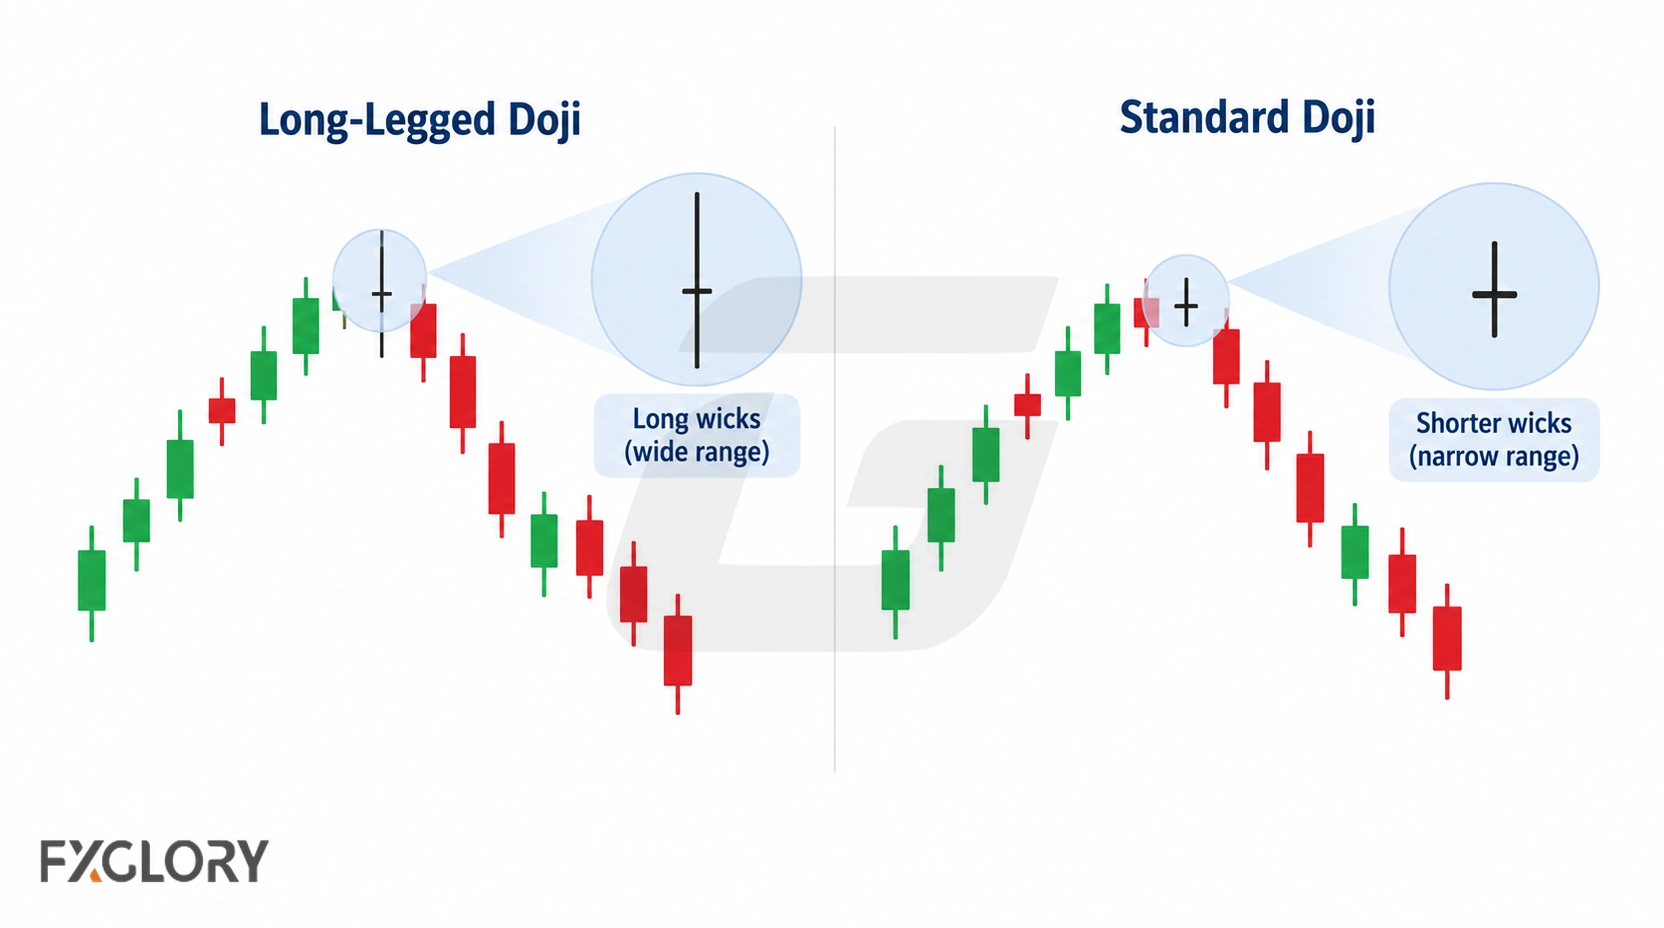
There is no fixed range cutoff for this distinction. In particular, longer shadows relative to the body do not automatically mean a larger absolute range or a stronger trading signal.
Long-Legged Doji vs Dragonfly and Gravestone Doji
The distinguishing feature is where the shadows sit relative to the near-zero body.
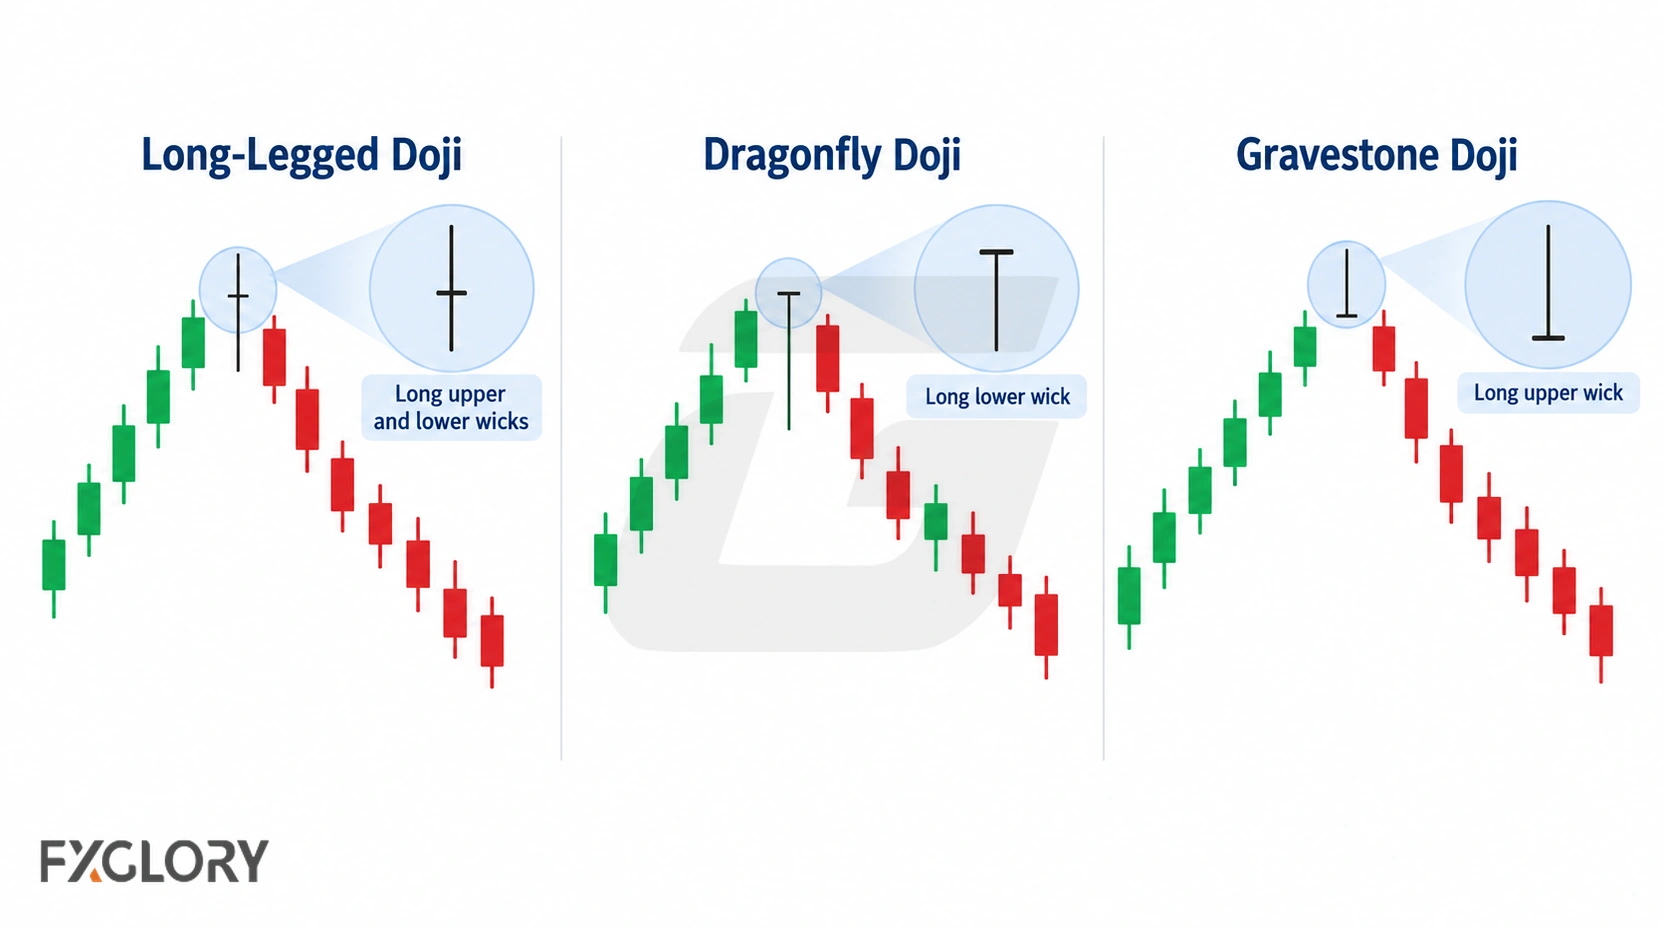
- Long-Legged Doji: Substantial upper and lower shadows.
- Dragonfly Doji: Long lower shadow, little or no upper shadow, with the body near the high.
- Gravestone Doji: Long upper shadow, little or no lower shadow, with the body near the low.
See Dragonfly Doji in forex and Gravestone Doji in forex for their separate interpretations.
Long-Legged Doji vs Spinning Top
The main distinction is the size of the real body relative to the candle's full high-low range. A Long-Legged Doji has an almost absent body and long shadows on both sides. A Spinning Top has a small but more noticeable real body, usually with shadows on both sides. Either can close slightly above or below its open, and borderline shapes may be classified differently by different analysts.
For more detail, see Spinning Top candle structure.
Rickshaw Man Doji
A Rickshaw Man is commonly described as a Long-Legged Doji whose near-zero body is positioned roughly around the midpoint of the high-low range, creating a more symmetrical shape. The labels overlap in common usage; the centre placement is the useful visual distinction, not a separate directional prediction.
Is a Long-Legged Doji Bullish, Bearish, or Neutral?
Its shape alone is directionally neutral. A potential bullish or bearish scenario comes from the surrounding structure and what later candles actually do.
- Potential bullish scenario: It appears after a decline near support and subsequent completed candles show buying progress, such as a close above a defined nearby level.
- Potential bearish scenario: It appears after an advance near resistance and subsequent completed candles show selling progress, such as a close below a defined nearby level.
- Range scenario: Price continues to close within the doji's high-low range or a larger sideways structure.
- Breakout scenario: Price moves beyond a specified boundary; whether an intrabar break, candle close, retest or follow-through is required must be defined separately.
For the broader subject, see forex reversal candles and their context.
How to Evaluate Confirmation and a Trading Setup
First identify the candle from its completed OHLC structure. Then define the directional idea, if any, and what would count as evidence for that idea. Identifying a Long-Legged Doji is not itself confirmation of a reversal or a trading entry.
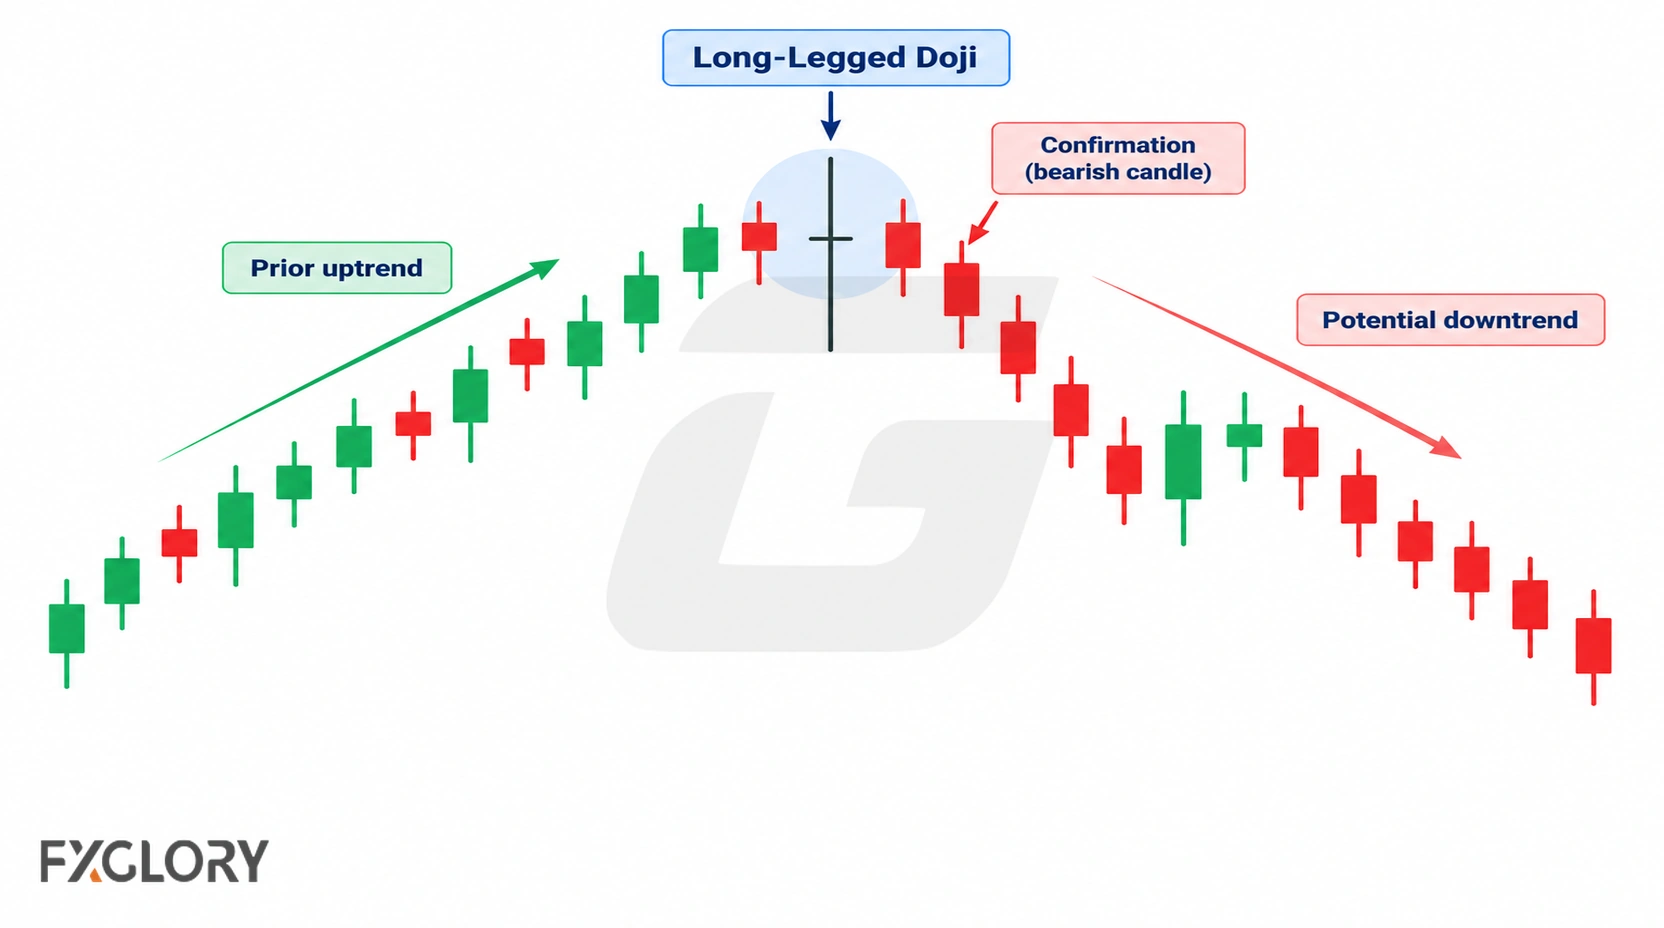
- Identify the pattern: Check the near-equal open and close and both prominent shadows; note the high and low.
- Establish context: Mark the prior trend, nearby structural levels and whether price is in a range.
- Choose a confirmation rule: For example, require a completed candle to close above the doji high for a bullish breakout scenario or below its low for a bearish one. An intrabar breach, a close beyond the level, a later retest and follow-through are different observations; none should be silently substituted for another.
- Assess the result: If price stays inside the range, the specified breakout condition has not occurred. A brief breach followed by a return inside may represent an unconfirmed attempt or a failed confirmed break, depending on the chosen rule.
- Evaluate trade readiness separately: If planning a trade, determine entry conditions, the trade-plan invalidation level, stop placement, position size, transaction costs and acceptable account risk. These choices do not affect whether the candlestick pattern exists.
The illustration shows one bearish follow-through scenario, not a required outcome or verified success rate. Practise applying the same rules consistently to historical and demo charts before using them in live decisions.
Failed Breakouts vs Trade Invalidation
An identifiable Long-Legged Doji does not become an invalid pattern because no trade follows. Keep three outcomes distinct:
- Unconfirmed scenario: No defined confirmation condition occurs, such as price remaining within the doji range.
- Failed confirmed scenario: A defined breakout condition occurs and subsequent price behaviour contradicts the expected direction, such as closing back inside the range.
- Trade-plan invalidation: Price reaches a separately chosen level or meets a condition at which a particular trade thesis is no longer acceptable. That point depends on the strategy and need not coincide exactly with a wick extreme.
A long wick may increase the distance to a proposed structural stop, but position sizing also depends on pip or contract value and the amount of account capital allocated to risk. A visually wide candle alone does not dictate a stop or position size.
Forex Trading Conditions: Volatility, Spreads, Sessions, and News
Candle shape and market conditions should be assessed separately. A Long-Legged Doji may have prominent shadows without being large relative to recent candles. Compare its high-low range with recent bars or an ATR measure when relative volatility is relevant; see ATR volatility context.
- Spread and liquidity: A bid-based or ask-based chart may display different extremes, and wider spreads can change entry or stop execution around quoted levels, particularly during thin liquidity.
- Sessions: Compare candles on equivalent timeframes while accounting for changing market participation across sessions.
- Economic releases and central-bank news: Rapid repricing can produce extended shadows, slippage and gaps between intended and available execution prices.
- Pair and timeframe: Typical ranges differ across currency pairs and timeframes; a small-timeframe candle should be interpreted within its higher-timeframe structure.
None of these conditions makes a candle automatically bullish, bearish or untradeable. They affect how reliably its levels can be interpreted and traded.