

What Is Forex Trading Using Fibonacci And Elliott Wave?
Forex trading using Fibonacci and Elliott Wave means using wave structure to create a market scenario, then using Fibonacci retracement or extension zones to define where that scenario is invalidated, where a setup may trigger, and where a target may be reviewed.
Fibonacci marks a possible retracement, extension, or projection zone; price action and invalidation decide whether the wave scenario survives. An Elliott Wave label is not a signal until the trader defines the trigger, stop, target, risk size, and cost assumption before entry.
FXGlory already has separate guides for Fibonacci in forex trading and Elliott Wave in forex. This strategy page focuses on combining those tools into trade setups and reviewing a mechanical test of those setups.
Is This The Todd Gordon Or Wiley Course?
No. This FXGlory Learn page is not the Todd Gordon/Wiley product, book, DVD, or course with a similar title. It is a free educational strategy article that converts common Fibonacci and Elliott Wave forex ideas into mechanical swing-proxy setup rules, then reviews the tested results.
That distinction matters because this article does not sell a course, does not forecast a live market, and does not claim that Elliott Wave counts can be made objective. It tests rule-based proxies for Wave-2 retracements, Wave-3 breakouts, Wave-4 pullbacks, ABC extensions, and Wave-5 exhaustion scenarios.
Fibonacci + Elliott Wave In 60 Seconds
- Elliott Wave gives the scenario: impulse, pullback, continuation, correction, or exhaustion.
- Fibonacci gives the zone: 23.6%, 38.2%, 50%, 61.8%, 78.6%, 127.2%, or 161.8%.
- A Wave-2 pullback often watches the 50% to 78.6% retracement area.
- A Wave-4 pullback often watches a shallower 23.6% to 50% retracement area.
- An ABC correction may use the 100% to 161.8% extension of Wave A to review possible Wave-C completion.
- A trade is not valid just because price touches a Fibonacci level. It needs direction, trigger, invalidation, risk, target, and cost logic.
Strategy Test Summary
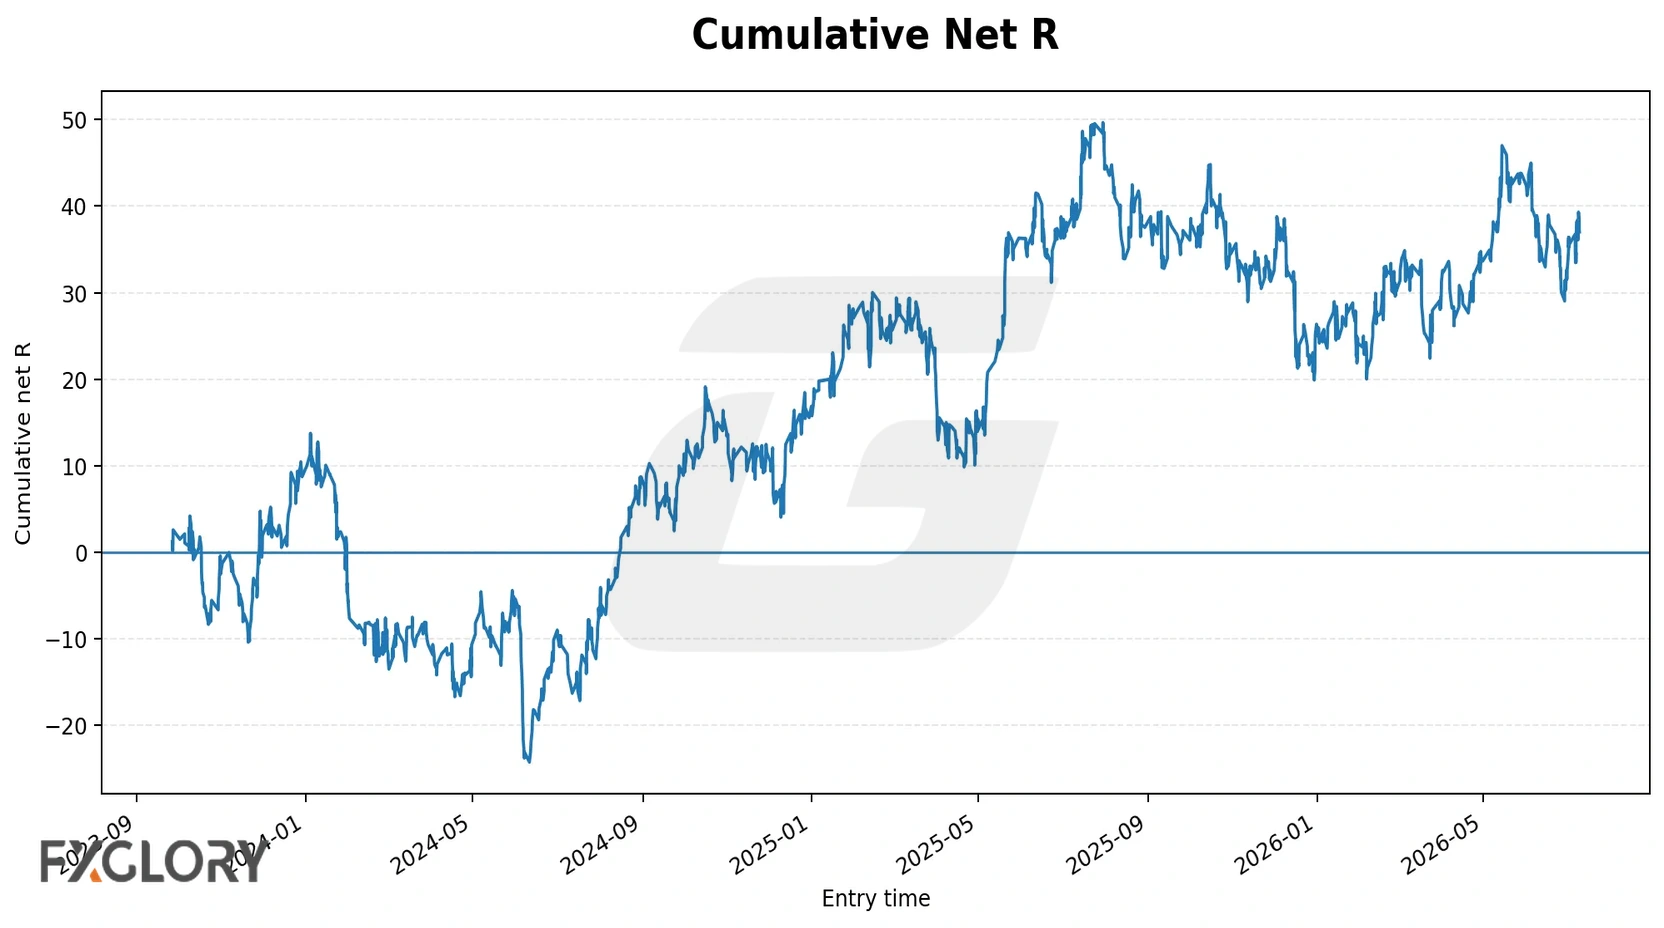
Bottom line: The tested Fibonacci + Elliott Wave mechanical proxy was only slightly positive at baseline. It produced 1,748 accepted trades, a 47.6% win rate, 0.0212R expectancy, 1.0443 profit factor, and 37.0218R total net R. The result turned negative under higher spread/slippage assumptions.
This does not prove that discretionary Elliott Wave trading works or that Fibonacci levels create an edge. In this mechanical swing-proxy test, Wave-2 retracement continuation and ABC extension reversal performed better than Wave-3 breakout and Wave-5 exhaustion.
Rules At A Glance
| Setup | Wave/Fibonacci idea | Trigger idea | Invalidation idea |
|---|---|---|---|
| Wave-2 retracement continuation | Wave 1 forms, Wave 2 retraces 50%-78.6% without breaking Wave 1 origin. | Enter after price turns back in the Wave-1 direction. | Wave 2 low/high fails. |
| Wave-3 breakout after Wave 2 | Wave 2 retracement forms, then price breaks the Wave-1 extreme. | Breakout beyond Wave-1 high/low. | Wave-2 pivot fails. |
| Wave-4 pullback continuation | Wave 3 extends, then Wave 4 retraces 23.6%-50% without overlapping Wave 1. | Enter after price turns back in Wave-3 direction. | Wave-4 pivot or overlap failure. |
| ABC extension reversal | Wave C reaches 100%-161.8% of Wave A. | Enter after price reverses away from Wave-C extreme. | Wave-C extreme fails. |
| Wave-5 exhaustion reversal | Wave 5 extends 61.8%-161.8% of Wave 1. | Enter after price reverses away from Wave-5 extreme. | Wave-5 extreme fails. |
How To Draw A Fibonacci Elliott Wave Setup
- Start on the higher timeframe and identify the most recent clear swing sequence before labeling waves.
- Mark the possible impulse or corrective structure first; do not draw Fibonacci levels before the wave scenario exists.
- For a Wave-2 idea, draw Fibonacci retracement from the Wave-1 origin to the Wave-1 extreme and watch the 50%-78.6% zone.
- For an ABC or Wave-5 idea, measure the prior swing and review the 100%-161.8% extension or projection zone.
- Wait for a trigger candle instead of entering only because price touched a Fibonacci level.
- Place invalidation beyond the wave pivot that would break the scenario.
- Reject the trade when the stop distance, spread, slippage, or holding risk makes the setup unattractive.
For Fibonacci drawing mechanics, use the FXGlory Fibonacci guide. For wave-count rules and Elliott Wave structure, use the FXGlory Elliott Wave guide.
Why This Page Does Not Claim Perfect Elliott Wave Counts
Elliott Wave counting is subjective. Two traders can label the same chart differently, especially before the move is complete. That is why this page does not claim that a script can identify the “true” Elliott Wave count.
The test uses mechanical swing proxies: 4H fractal pivots, ATR swing filtering, Fibonacci retracement or extension rules, and 1H trigger/exit rules. That keeps the test repeatable, but it also means the result is a simplified model of wave ideas rather than discretionary Elliott Wave forecasting.
Fibonacci Extension Vs Projection In Elliott Wave
In trader language, Fibonacci extension and Fibonacci projection are often used together, but they are not identical. An extension usually measures how far price travels beyond an existing swing. A projection usually copies or compares one wave length against another wave, such as comparing Wave C with Wave A or Wave 5 with Wave 1.
This article keeps the terminology practical: the ABC setup reviews a Wave-C extension/projection against Wave A, and the Wave-5 exhaustion setup reviews Wave 5 against Wave 1. The strongest cleaned zone in the test was the 127.2%-161.8% extension/projection group, but that result still depends on the mechanical proxy rules and does not prove a discretionary wave count.
Five Fibonacci And Elliott Wave Setups Tested
The test compared five setup families that appear frequently in Fibonacci/Elliott Wave education. The labels are strategy labels, not guarantees that the market completed a textbook count.
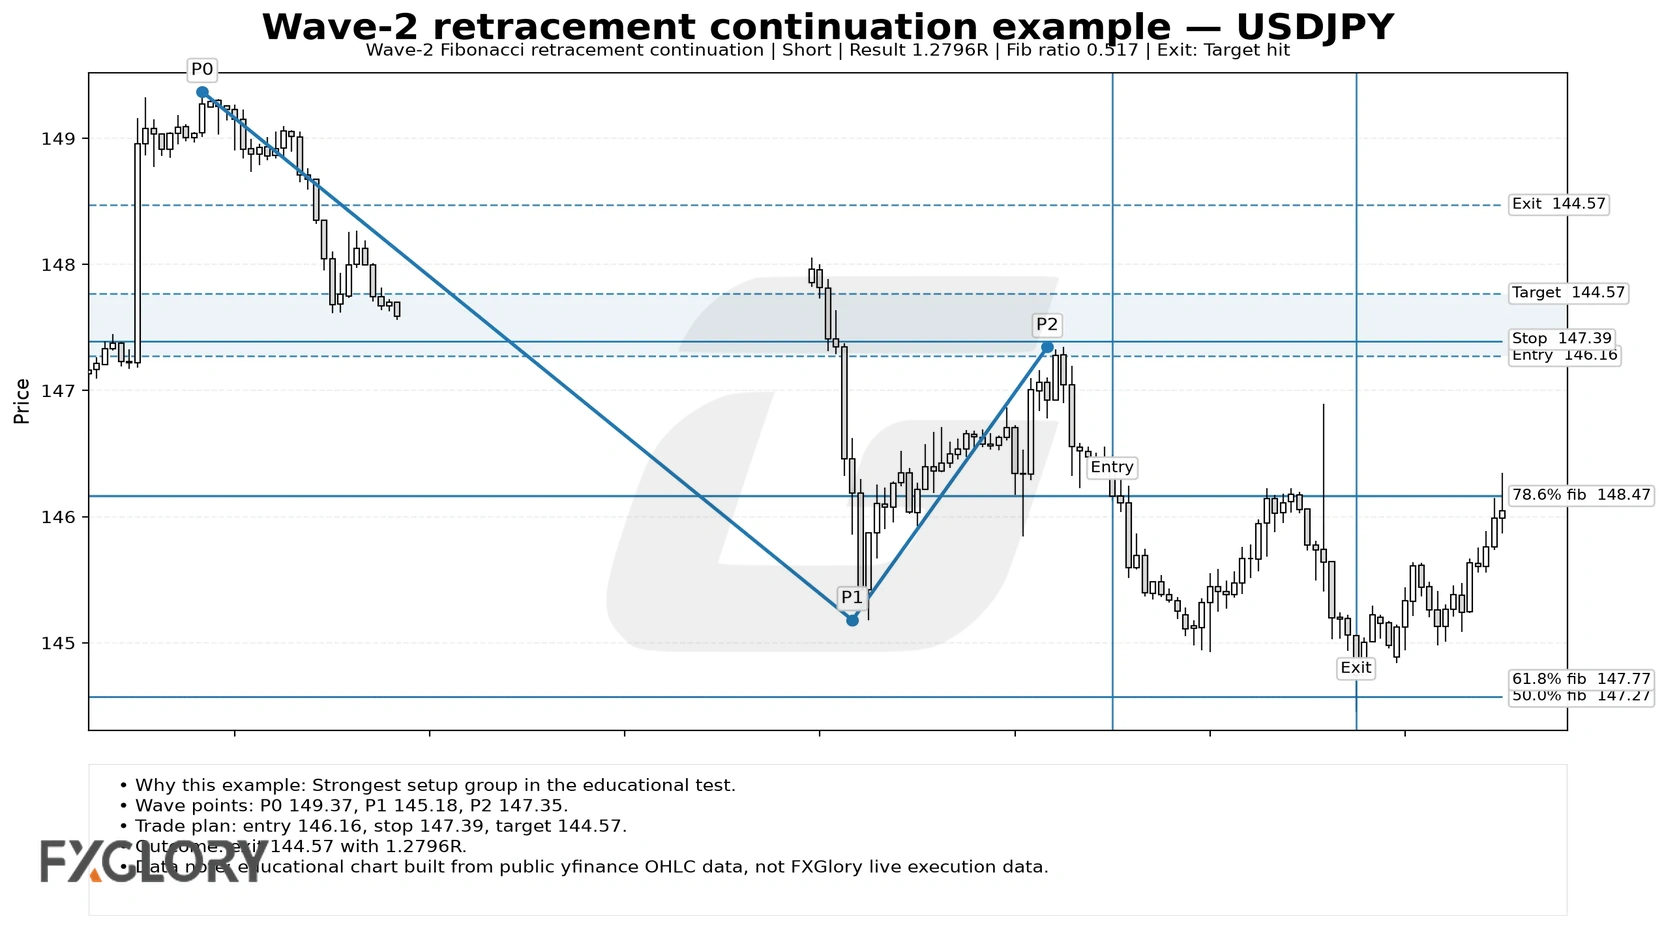
1. Wave-2 Fibonacci Retracement Continuation
This setup starts with an impulse swing, waits for a 50% to 78.6% retracement, and rejects the idea if the retracement breaks the Wave-1 origin. In the baseline test, this was the strongest setup by both expectancy and total net R.
Baseline result: 764 trades, 49.74% win rate, +0.0737R expectancy, 1.1576 profit factor, and +56.3276R total net R.
2. Wave-3 Breakout After Wave-2 Retracement
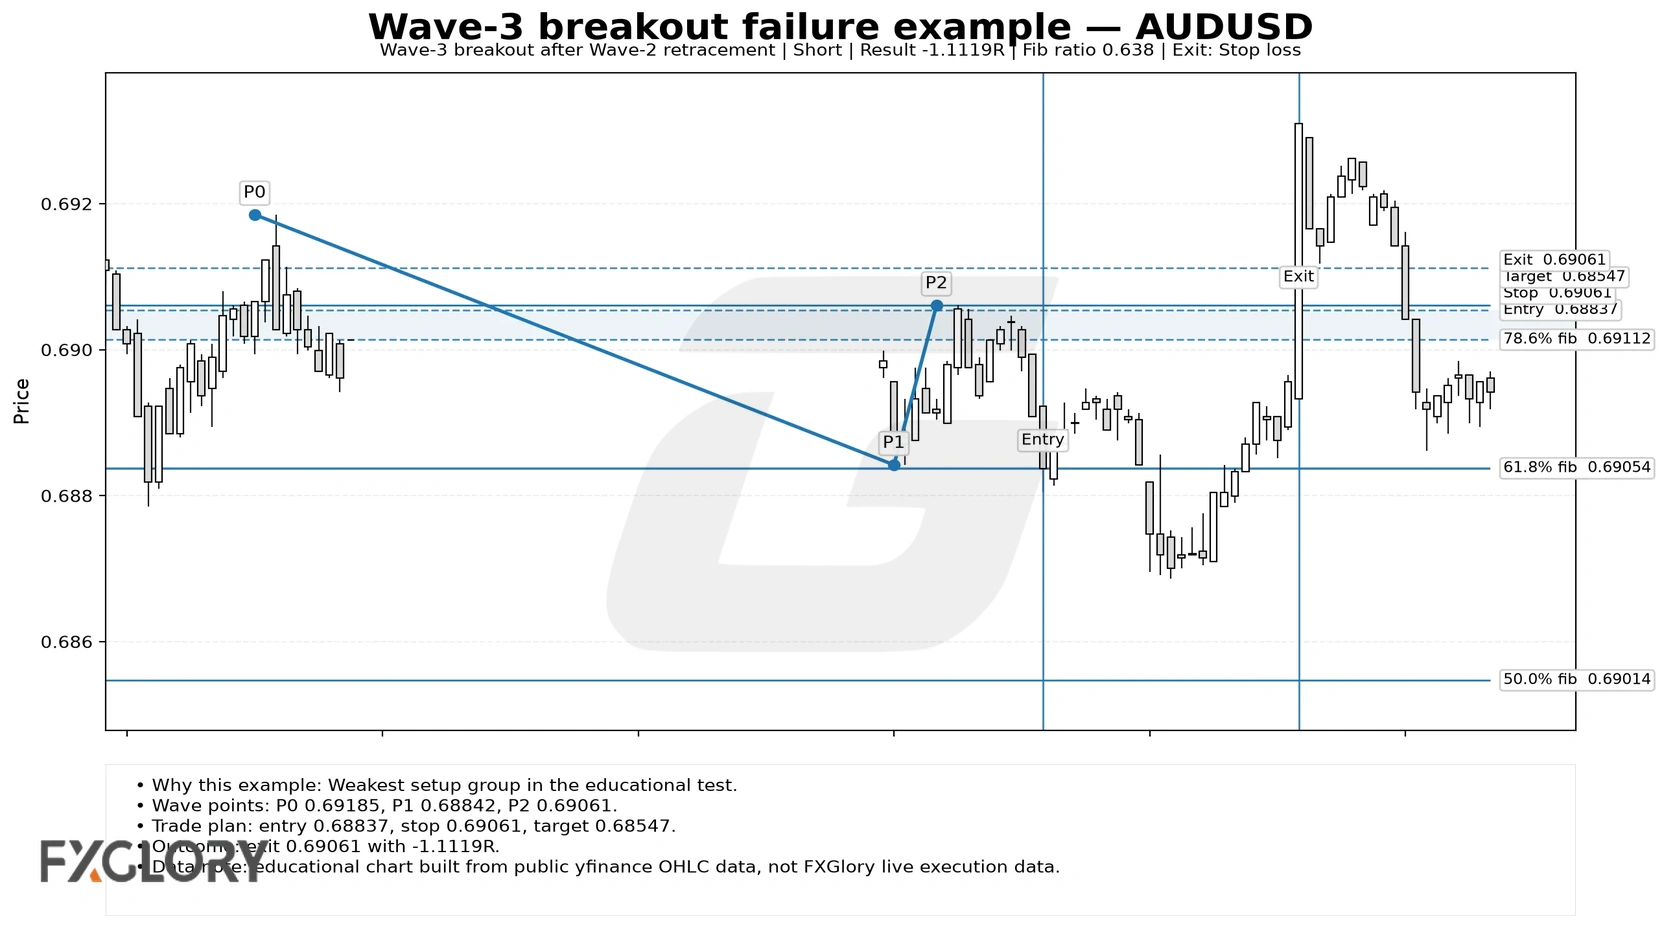
This setup waits for price to break beyond the Wave-1 extreme after a Fibonacci Wave-2 pullback. Many Elliott Wave lessons present Wave 3 as the attractive move, but this mechanical breakout proxy was the weakest tested setup.
Baseline result: 299 trades, 37.79% win rate, -0.1557R expectancy, 0.7014 profit factor, and -46.5534R total net R.
The test does not prove that every Wave-3 trade fails. It shows that buying or selling the breakout after a labeled Wave-2 retracement can be weaker than waiting for a cleaner retracement-continuation or ABC extension/reversal rule.
3. Wave-4 Fibonacci Pullback Continuation
This setup looks for a shallow 23.6% to 50% pullback after a strong Wave-3-style swing, with a no-overlap rule against the Wave-1 price area. It was slightly positive but much smaller in sample size than the Wave-2 and ABC models.
Baseline result: 108 trades, 47.22% win rate, +0.0274R expectancy, 1.0612 profit factor, and +2.9560R total net R.
4. ABC Fibonacci Extension Reversal
This setup uses a corrective A-B-C structure and reviews whether Wave C reaches a 100% to 161.8% extension of Wave A before reversing. It was the second-strongest setup in the test.
Baseline result: 475 trades, 51.16% win rate, +0.0654R expectancy, 1.1403 profit factor, and +31.0564R total net R.
5. Wave-5 Extension Exhaustion Reversal
This setup looks for a fifth-wave-style extension and then tests a reversal away from the final swing extreme. It was negative in this model, which warns against treating every extended Wave 5 as an automatic reversal.
Baseline result: 102 trades, 44.12% win rate, -0.0663R expectancy, 0.8720 profit factor, and -6.7648R total net R.
How FXGlory Tested The Strategy
The test used public yfinance 1H OHLC data for EURUSD, GBPUSD, USDJPY, AUDUSD, USDCAD, and USDCHF. The 1H candles were resampled to 4H for swing detection. The 1H chart was then used for trigger and exit logic.
| Method item | Value |
|---|---|
| Study type | Mechanical proxy test, not subjective Elliott Wave forecasting |
| Data source | Public yfinance 1H OHLC; not FXGlory broker execution data |
| Swing context | 4H fractal pivots with ATR swing filtering |
| Trigger/exit timeframe | 1H |
| Pairs | EURUSD, GBPUSD, USDJPY, AUDUSD, USDCAD, USDCHF |
| Target | Fixed 1.3R for comparability |
| Friday-flat rule | Open trades could be closed by a Friday-flat exit. The supplied structured results do not state the exact Friday cutoff time, so no cutoff is inferred here. |
| Costs | 1.5 pip spread and 0.5 pip slippage per side at baseline |
| Swap | Not included |
| Risk basis | R-multiple only; no leverage, account balance, or compounding simulation |
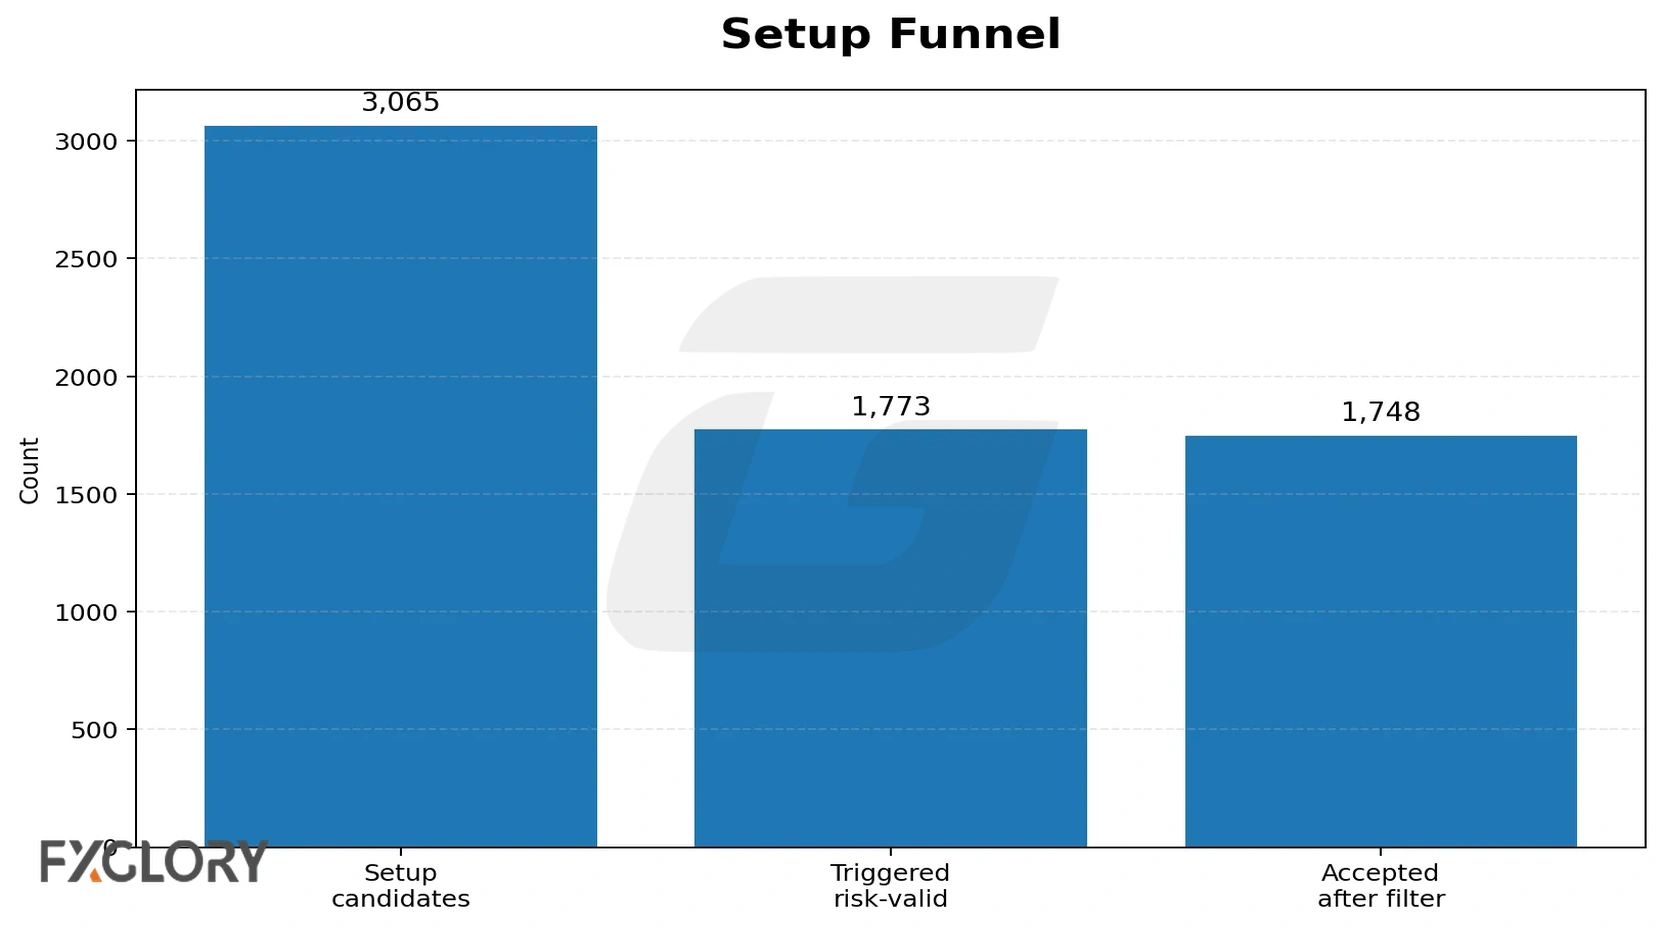
The model generated 3,065 setup candidates. Of those, 1,773 became triggered/risk-valid trades before overlap filtering, and 1,748 were accepted after 25 same-pair/setup overlap rejections. In other words, trades were removed when they overlapped another qualifying trade from the same currency pair and setup family. The supplied structured results record the number of overlap rejections but do not specify the tie-break rule used when two qualifying trades overlapped, so this article does not infer which candidate had priority.
Overall Backtest Results
The baseline result was positive but fragile. A +0.0212R expectancy means the average trade only slightly exceeded breakeven after the baseline spread/slippage model, and the high-cost case turned negative.
| Metric | Result |
|---|---|
| Trades | 1,748 |
| Win rate | 47.6% |
| Average win | 1.049R |
| Average loss | -0.9123R |
| Expectancy | 0.0212R |
| Profit factor | 1.0443 |
| Total net R | 37.0218R |
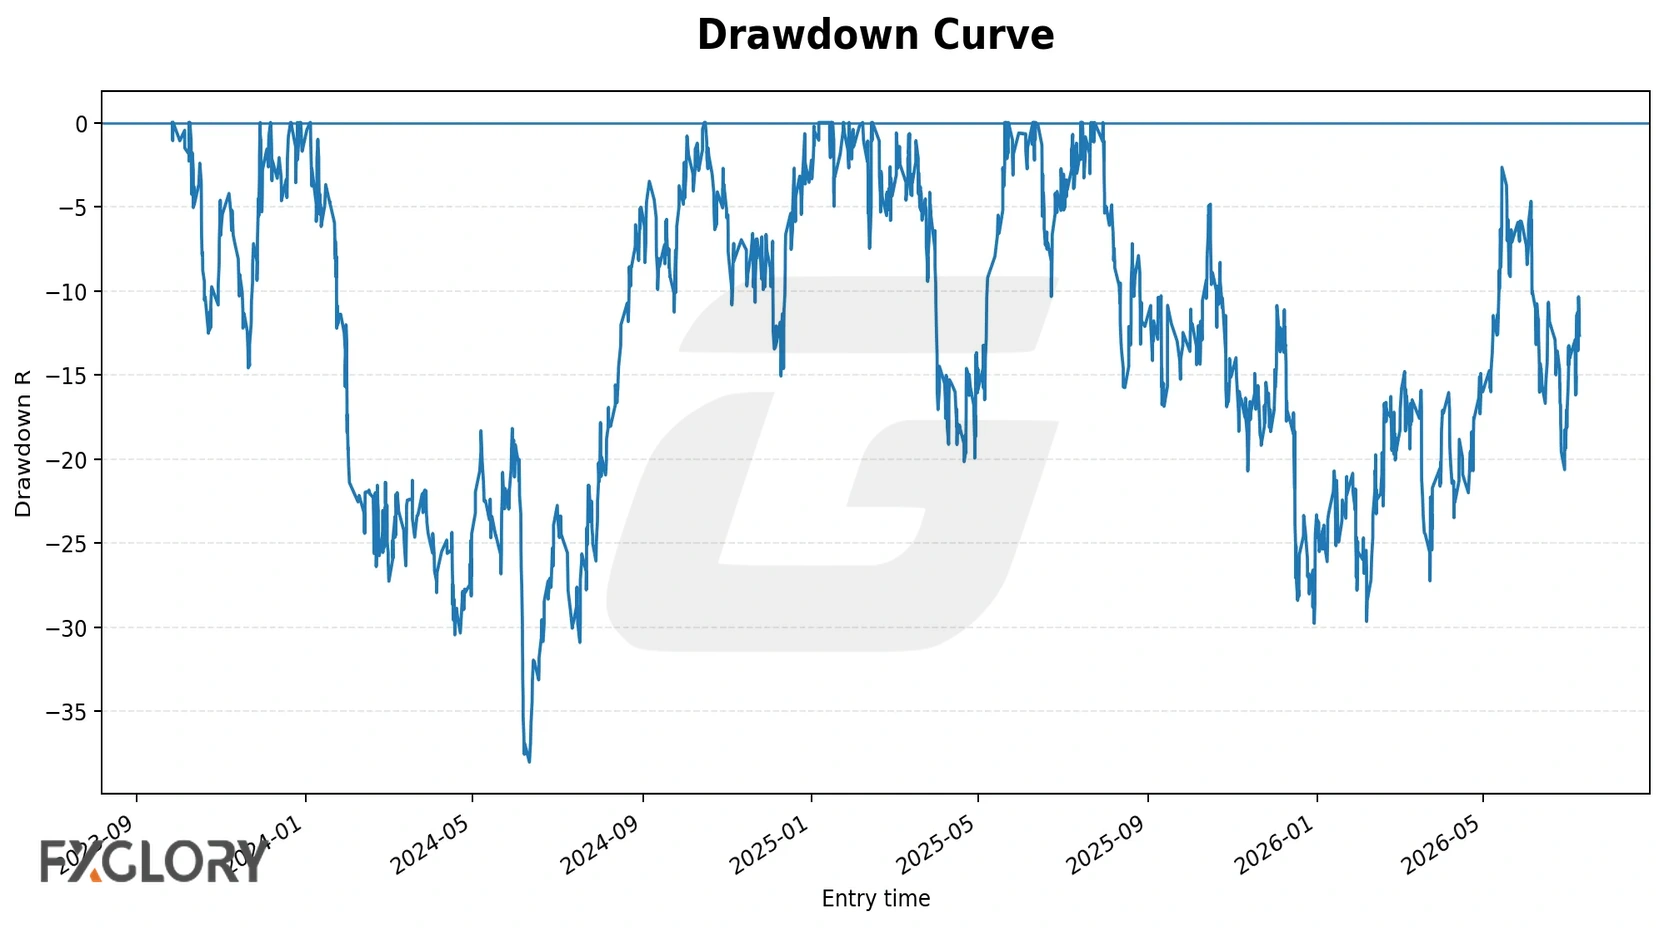
| Max drawdown | -38.0069R |
| Worst losing streak | 16 |
| Friday flat exit rate | 20.25% (354 exits) |
Setup-Type Results
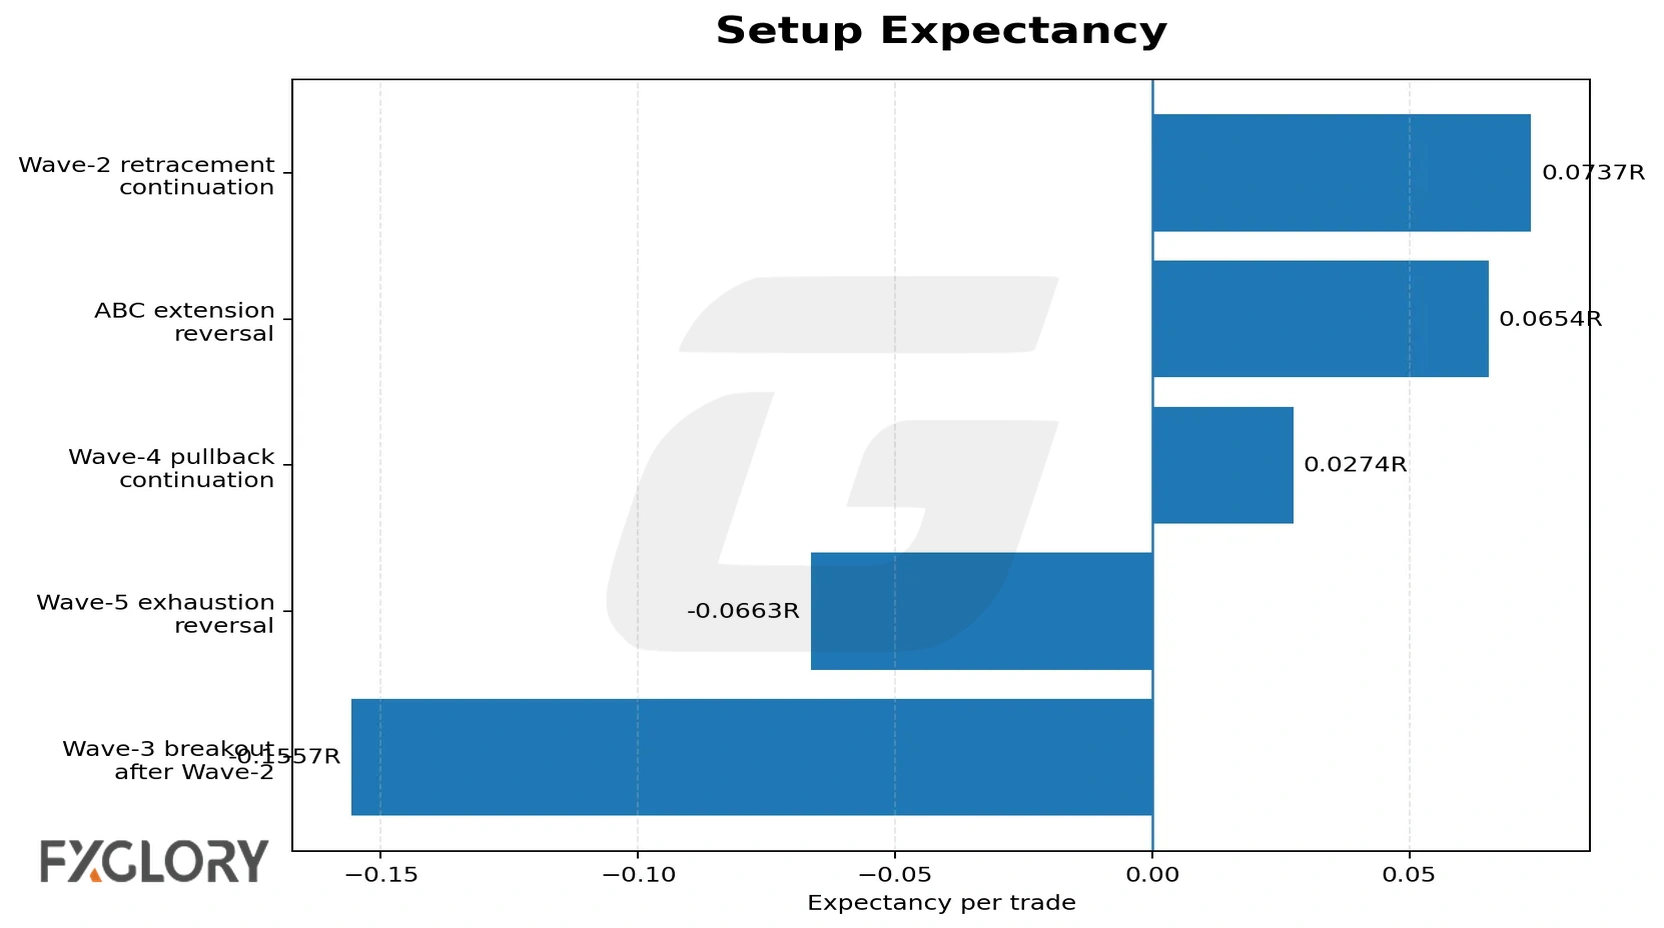
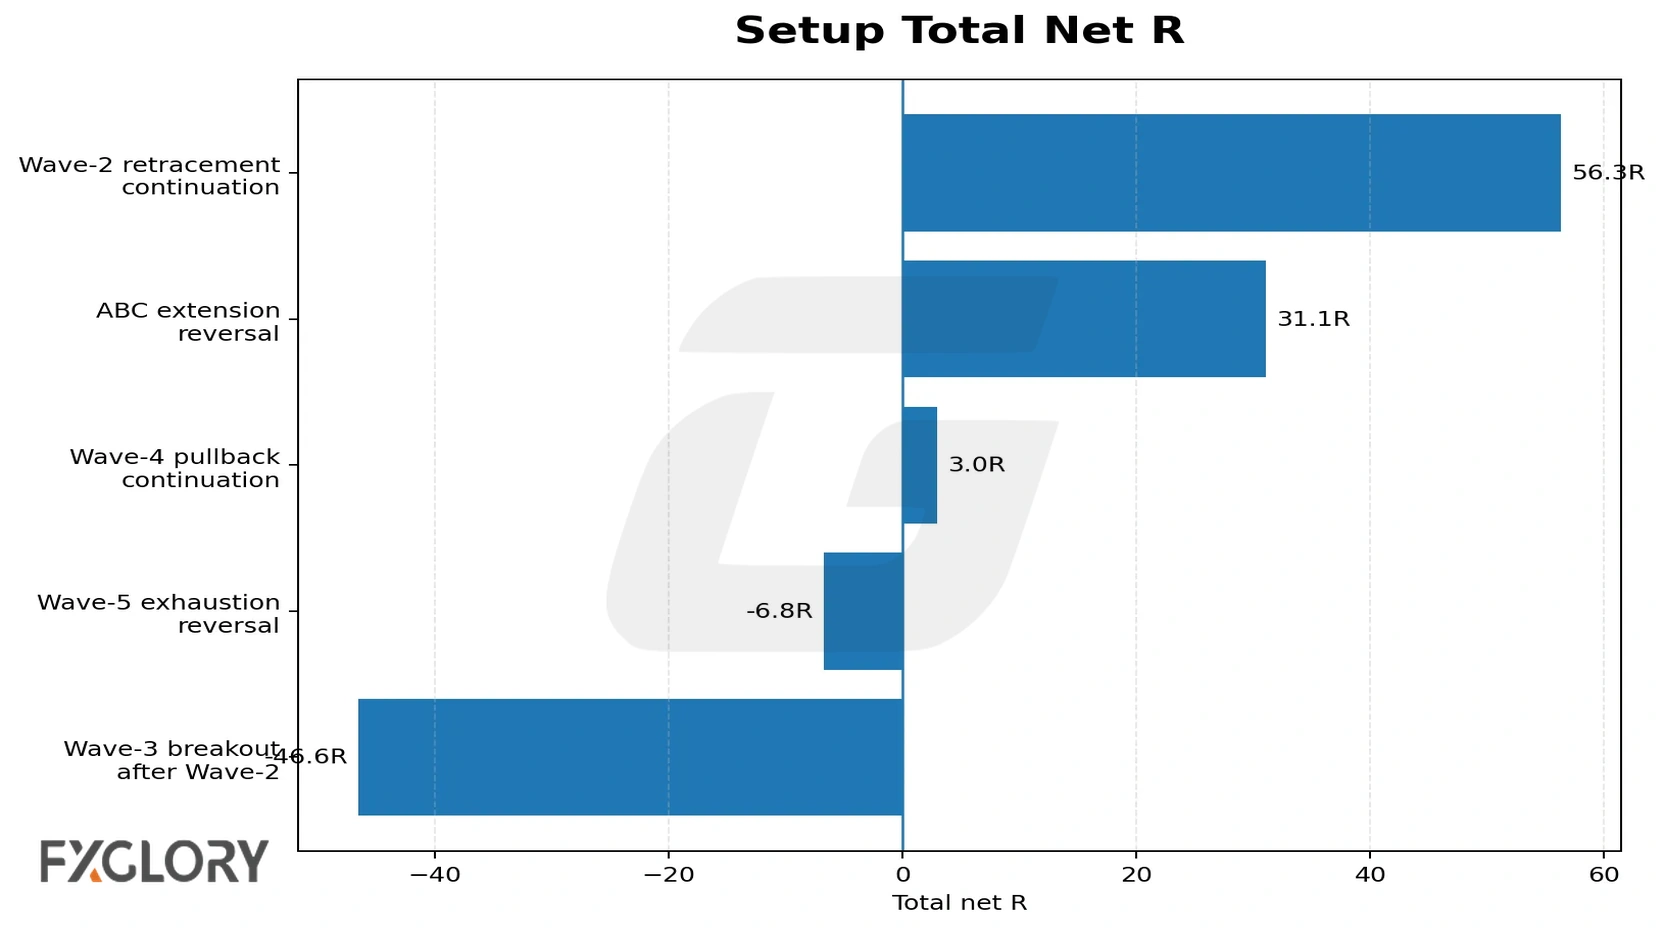
Setup-level results show where the baseline result came from. Wave-2 retracement continuation and ABC extension reversal carried the test; the Wave-3 breakout model pulled the result down.
| Setup | Trades | Win rate | Expectancy | Profit factor | Total net R | Max DD |
|---|---|---|---|---|---|---|
| Wave-2 Fibonacci retracement continuation | 764 | 49.74% | 0.0737R | 1.1576 | 56.3276R | -16.4259R |
| ABC Fibonacci extension reversal | 475 | 51.16% | 0.0654R | 1.1403 | 31.0564R | -27.0543R |
| Wave-4 Fibonacci pullback continuation | 108 | 47.22% | 0.0274R | 1.0612 | 2.956R | -11.6241R |
| Wave-5 extension exhaustion reversal | 102 | 44.12% | -0.0663R | 0.872 | -6.7648R | -10.5453R |
| Wave-3 breakout after Wave-2 retracement | 299 | 37.79% | -0.1557R | 0.7014 | -46.5534R | -54.5363R |
Fibonacci Zone Results
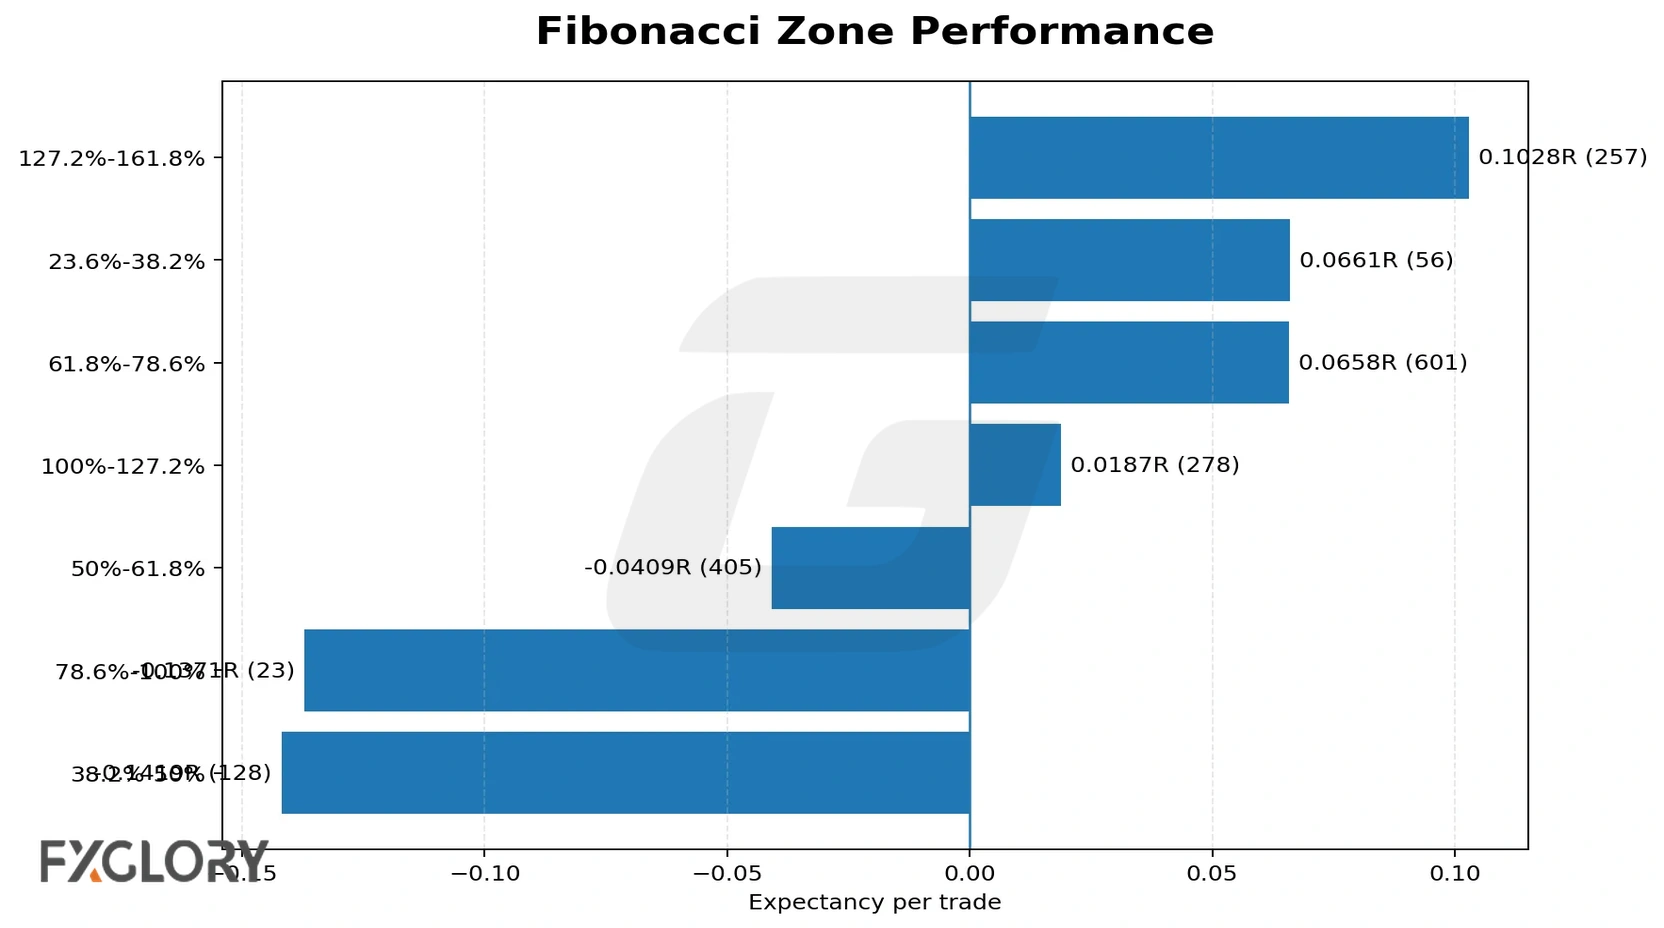
The cleaned Fibonacci-zone review groups trades by the retracement or extension zone used in the mechanical model. The 127.2%-161.8% extension and the 61.8%-78.6% retracement zones were among the strongest groups with enough trades.
| Zone | Trades | Win rate | Expectancy | Profit factor | Total net R |
|---|---|---|---|---|---|
| 127.2%-161.8% | 257 | 52.14% | 0.1028R | 1.2323 | 26.4274R |
| 23.6%-38.2% | 56 | 50.0% | 0.0661R | 1.1576 | 3.6999R |
| 61.8%-78.6% | 601 | 48.75% | 0.0658R | 1.1407 | 39.5532R |
| 100%-127.2% | 278 | 49.28% | 0.0187R | 1.038 | 5.207R |
| 50%-61.8% | 405 | 44.94% | -0.0409R | 0.919 | -16.5537R |
| 78.6%-100% | 23 | 43.48% | -0.1371R | 0.7248 | -3.1533R |
| 38.2%-50% | 128 | 37.5% | -0.1419R | 0.7175 | -18.1587R |
Pair Results
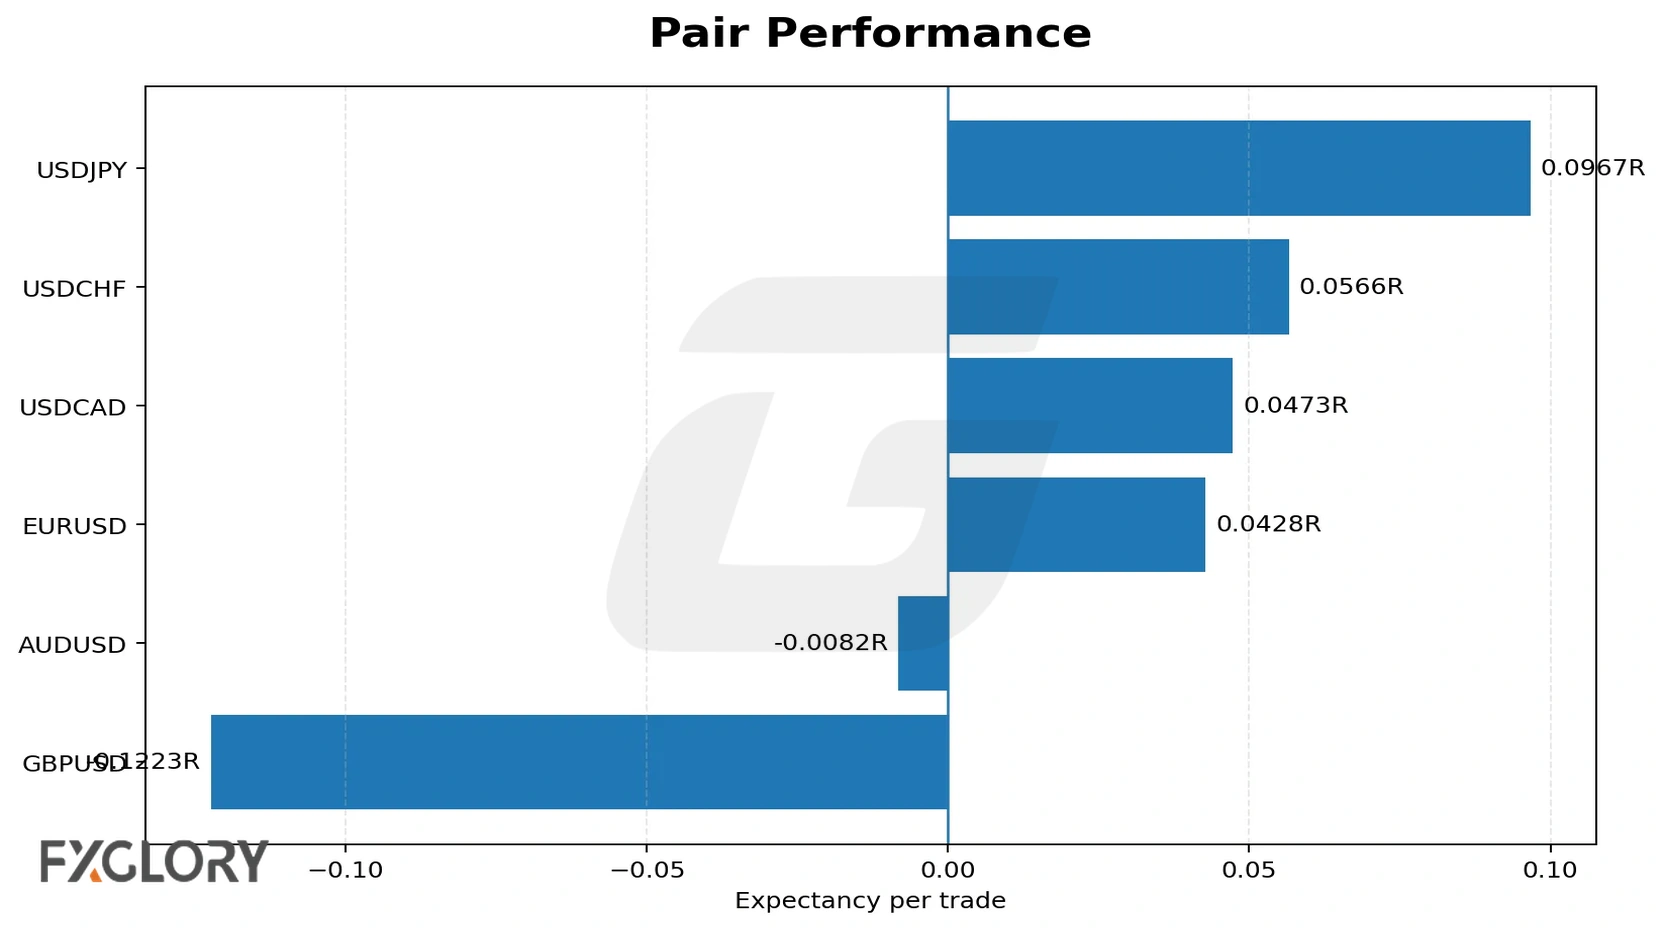
The same rule model did not behave equally across pairs. USDJPY had the strongest expectancy, while GBPUSD was the weakest pair in this run.
| Pair | Trades | Win rate | Expectancy | Profit factor | Total net R |
|---|---|---|---|---|---|
| USDJPY | 304 | 49.34% | 0.0967R | 1.2183 | 29.4107R |
| USDCHF | 315 | 49.52% | 0.0566R | 1.122 | 17.8179R |
| USDCAD | 315 | 50.79% | 0.0473R | 1.1065 | 14.9018R |
| EURUSD | 249 | 48.59% | 0.0428R | 1.0924 | 10.6637R |
| AUDUSD | 292 | 46.58% | -0.0082R | 0.9836 | -2.3855R |
| GBPUSD | 273 | 39.93% | -0.1223R | 0.7838 | -33.3867R |
Session Results
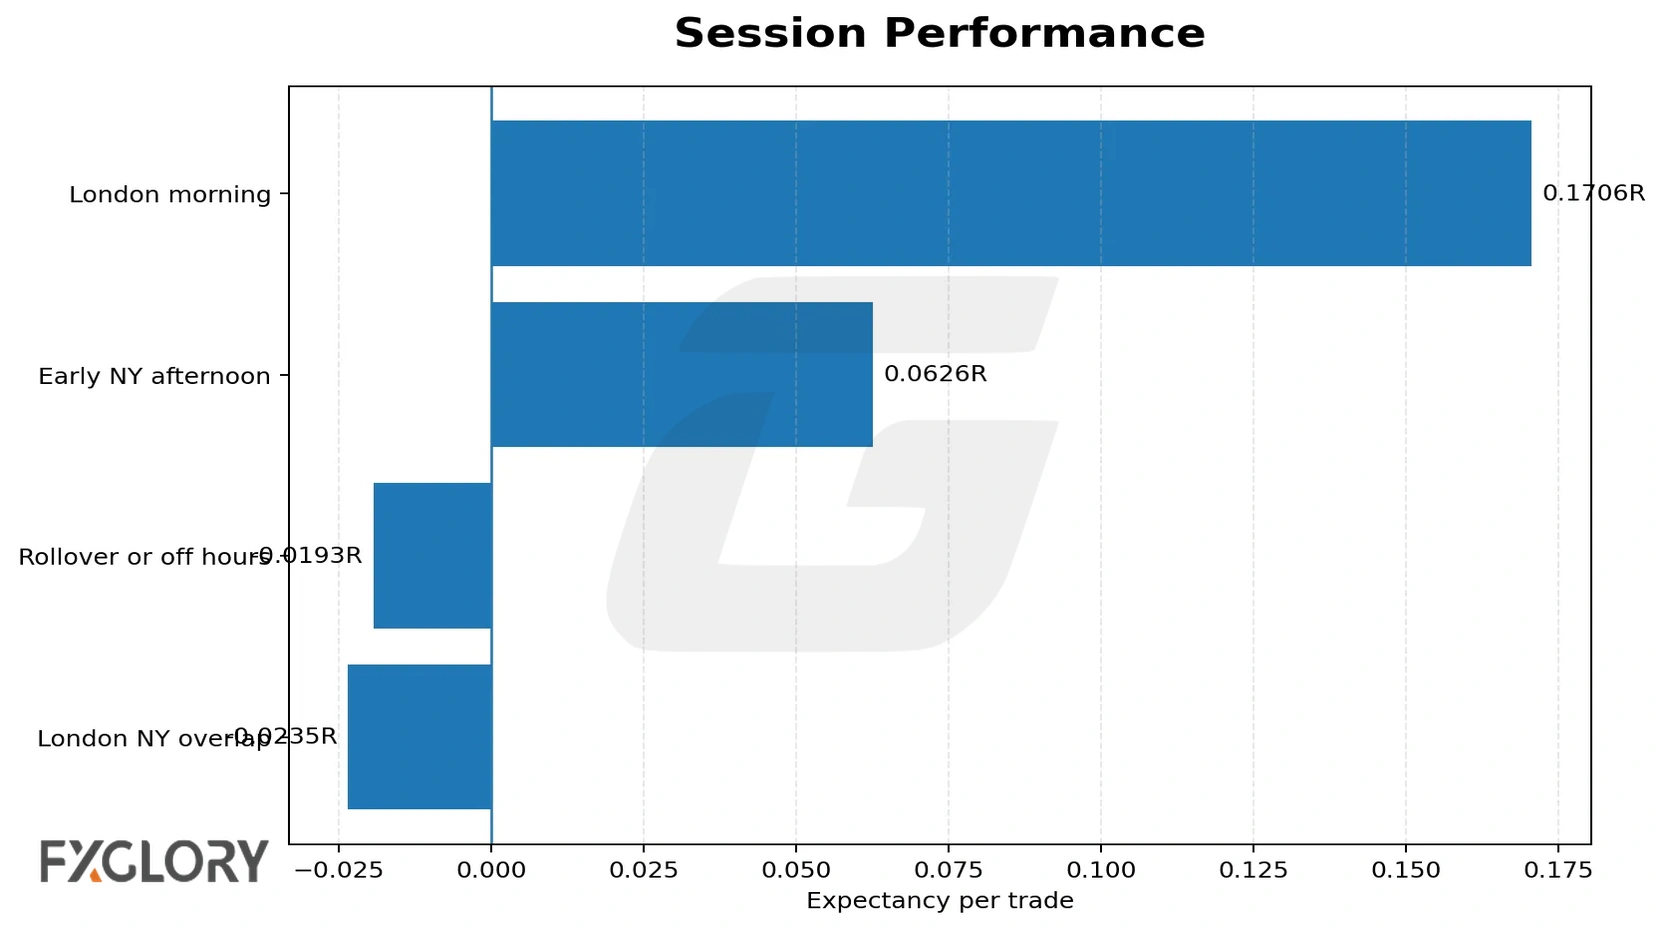
London morning entries were strongest in this educational test. Rollover/off-hours and London/New York overlap were weaker. This does not mean London morning will always perform better, but it does show that entry timing changed the tested result.
| Session | Trades | Win rate | Expectancy | Profit factor | Total net R |
|---|---|---|---|---|---|
| London morning | 262 | 53.82% | 0.1706R | 1.4043 | 44.7041R |
| Early New York afternoon | 273 | 48.35% | 0.0626R | 1.161 | 17.0807R |
| Rollover or off hours | 888 | 46.51% | -0.0193R | 0.9629 | -17.1405R |
| London New York overlap | 325 | 44.92% | -0.0235R | 0.9516 | -7.6224R |
Cost Sensitivity
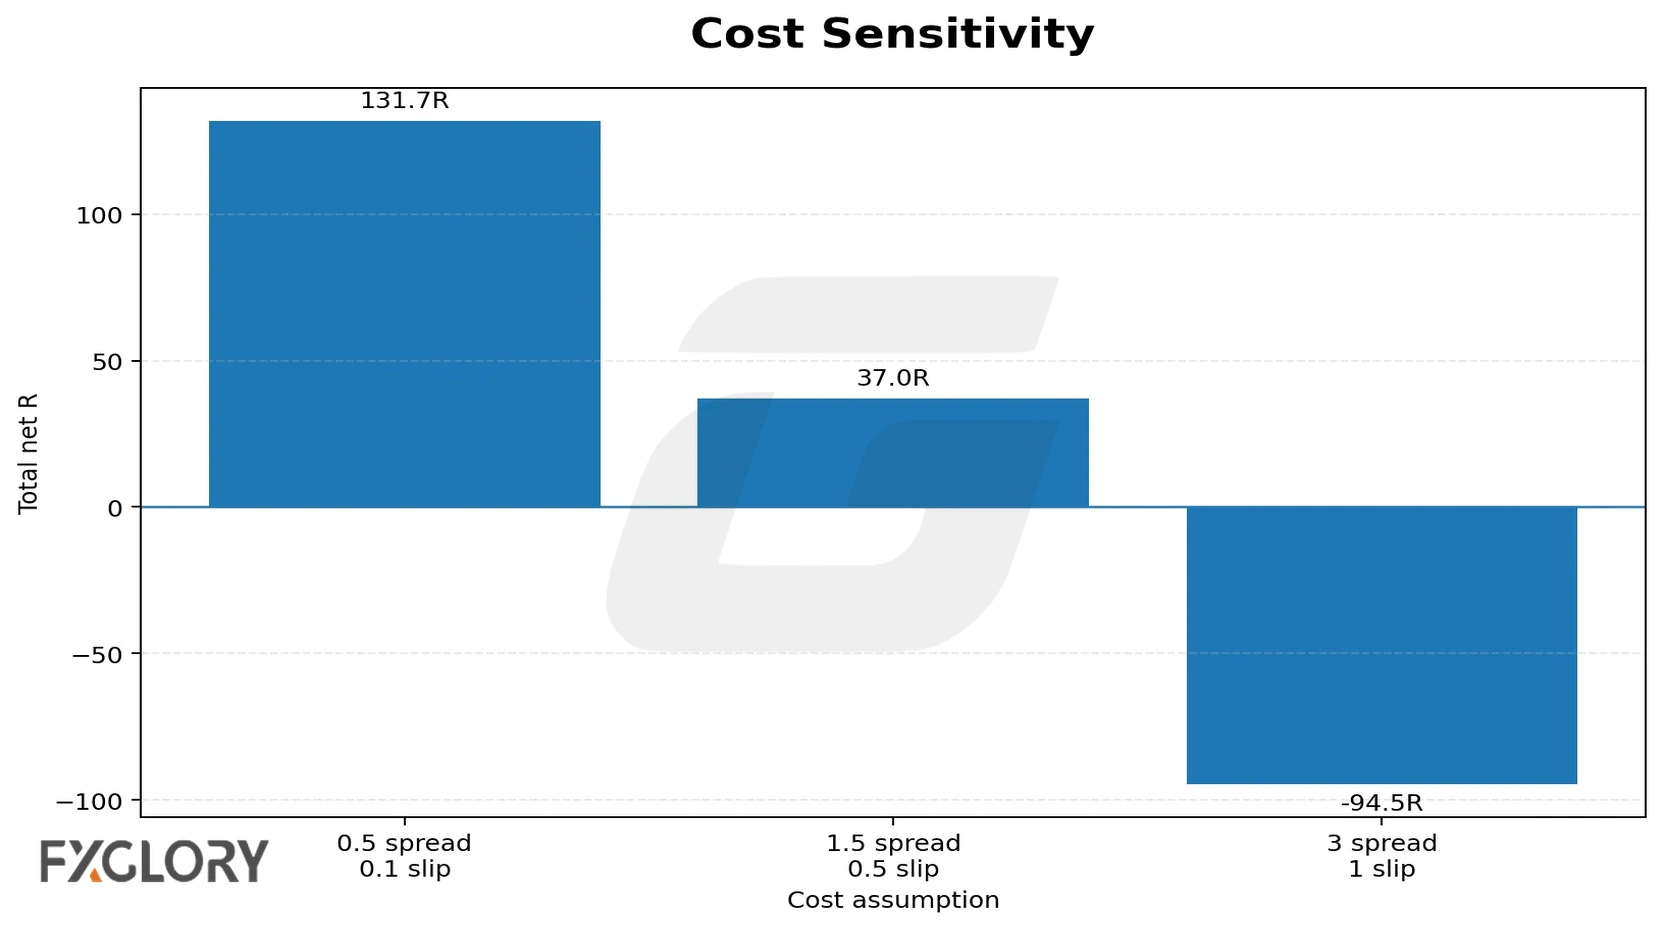
The strategy was highly cost-sensitive. The same accepted trades were positive under low-cost assumptions, barely positive at baseline, and negative under higher spread/slippage assumptions. That is the main risk warning for any trader trying to convert a chart theory into execution rules.
| Cost assumption | Win rate | Expectancy | Profit factor | Total net R | Max DD |
|---|---|---|---|---|---|
| 0.5 pip spread / 0.1 pip slippage per side | 48.68% | 0.0754R | 1.1669 | 131.7177R | -21.9013R |
| 1.5 pip spread / 0.5 pip slippage per side | 47.6% | 0.0212R | 1.0443 | 37.0218R | -38.0069R |
| 3.0 pip spread / 1.0 pip slippage per side | 46.62% | -0.0541R | 0.8952 | -94.5002R | -102.3951R |
Practical Rules Before Using Fibonacci And Elliott Wave Together
- Do not relabel waves after the outcome is known. Define the wave scenario before entry.
- Use Fibonacci levels as zones, not exact prices.
- Do not assume Wave 3 breakout is automatically the best entry; it was the weakest setup in this test.
- Separate retracement ideas from extension ideas. The tested 61.8%-78.6% retracement and 127.2%-161.8% extension groups were stronger than some shallower zones.
- Define invalidation before entry. A wave count without invalidation is just a chart opinion.
- Account for spread, slippage, and swap risk. The model turned negative under higher cost assumptions.
- Use position sizing and risk limits before applying any strategy to a live account.
What Not To Do
Do not buy every 61.8% retracement. Do not sell every 161.8% extension. Do not assume a five-wave count is complete because it looks complete. Do not treat a chart label as a signal.
The tested model was only slightly positive at baseline, and it turned negative when costs increased. That is enough reason to test every variation separately before using it in live trading.
Related FXGlory Guides
For the underlying drawing and wave-count mechanics, use Fibonacci in Forex Trading and Elliott Wave Forex. For broader swing structure, review Forex Swing Trading Strategy, Retracement Forex, and Forex Risk Management Strategy.
Final Takeaway
Forex trading using Fibonacci and Elliott Wave is strongest when it is treated as a structured scenario process, not as a prediction tool. In this FXGlory educational test, the mechanical model was only slightly positive at baseline, with Wave-2 retracement continuation and ABC extension reversal performing better than Wave-3 breakout and Wave-5 exhaustion.
Higher spread/slippage assumptions turned the same model negative. Define the wave scenario, Fibonacci zone, trigger, invalidation, target, and cost assumption before entry, then test the complete rule set rather than relying on the chart label alone.